It is rightly said that data is the new oil! Without data, it can be pointless unless it weaves a story. Knowledge graphs offer the ability to turn data into insights using knowledge management systems and platforms like InsightsHub.
Forrester suggests that between 60 and 73% of data never ends up being used for analytical reasons. These numbers broadly translate to even data collection in research. How can you harness data’s true potential by using knowledge graphs as a vital tool in your insights management process?
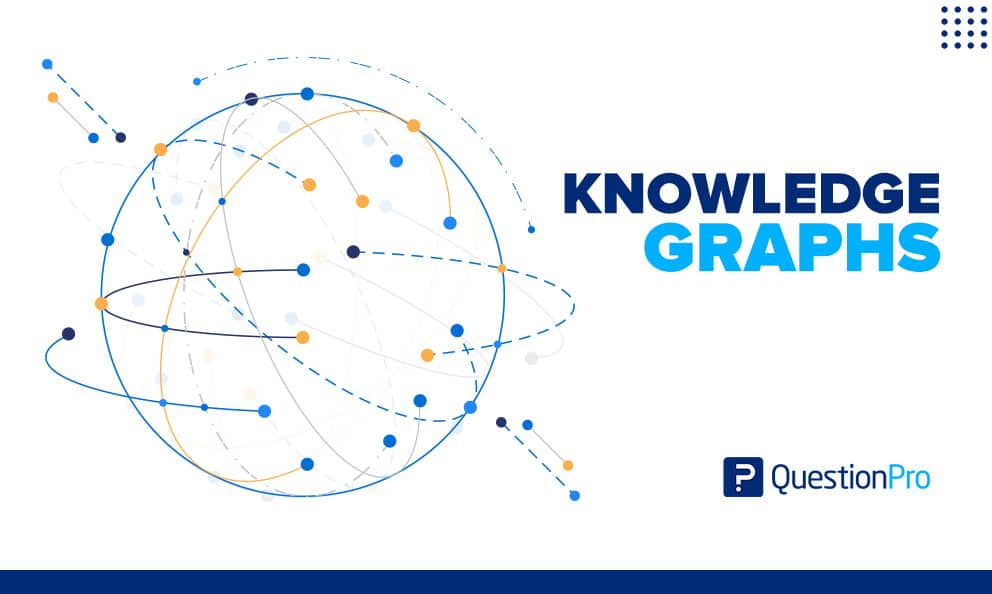
What are knowledge graphs?
Knowledge graphs (KG) are defined as a knowledge base that leverages a structured data model to represent real-world entities and their relationships. They are used to store the interlinking of various entities that include objects, events, situations, and concepts with data at their base. All of this interlinked data is a graphical model known as knowledge graphs.
Knowledge graphs put in place a structure to derive context in data by using linking and semantic metadata. Hence, they provide a framework to unify data, run analytics on it and share this data in the form of insights.
To top it all, KG is a dynamic concept that requires little to no manual intervention from humans and machines and can recalibrate and remodel with time, unlike traditional data models.
Such advanced data management techniques could help companies get out of the rut of conventional databases, using natural language processing, machine learning, and semantics power to utilize data better. They can be created from scratch, for example, by domain experts, learned from unstructured or semi-structured data sources, or assembled from existing knowledge graphs.
LEARN ABOUT: Data Management Framework
Usually assisted by a variety of semi-automated or automated data validation and integration mechanisms. In other words, a knowledge graph is a procedural method for modeling the domain of knowledge using domain experts, data linkage, and machine learning algorithms.
Due to the agile nature of depicting data and the speed of drawing inferences and insights, knowledge graphs are now a critical part of the market research process. They also help eliminate tribal knowledge and aid with creating a single source of the truth, all while building on past data and insights.
Difference between an ontology and a knowledge graph
Ontologies are very frequently referenced while talking about knowledge graphs, but there is a difference between them. While used interchangeably, there still is a difference between them. Since both of them also use nodes and edges, it heightens the confusion between what is an ontology and what is a knowledge graph.
Ontology
An ontology is a rigid data model that only defines the things in our ecosystem and the properties used to describe them. In an ontology, generalized models of data are created on the basis of shared properties without providing any specific information.
There are three main components of ontology which are:
- Classes: All line items of things that exist in data.
- Relationships: This provides the relationship between one or many classes
- Attributes: They define the properties that are used to describe an individual class.
Knowledge graph
A knowledge graph uses ontology as a framework to add real-life data and add weightage to the data. You can add granulate data such as identifying information and information that is sacrosanct to a particular individual or instance. There is an absolute representation of properties, relationships, nodes, and data in this instance.
Using this information, it is possible to create specific instances of ontological relationships within data.
Let’s consider a library ecosystem to signify the difference between an ontology and a knowledge graph with an example. In an ontology, the library would consist of a tabular representation of books, authors, and publishers as structured data since there are parallel’s between data.
However, when you want to create a knowledge graph, you can use the tabular representation of the ontology to draw up a graphical representation of a book, the author, the publisher, and more. It provides an over-encompassing view of the structured data and unique identifying information to provide a high-level view of information.
To put this simply, ontology is a framework for a knowledge graph. To simplify it even further, an ontology + data = knowledge graph.
How knowledge graphs work
Now that we know how to create knowledge graphs from ontology, it is imperative to know that it is impossible to draw inferences without structured data that is tagged and indexed. The raw data needs to be put into a knowledge management tool with the correct identifying information, tags, nuggets of information, identifying information, metadata, project details, and more.
This data has to be created in a structure that offers the best chances of success for artificial intelligence and natural language processing (NLP) to search, retrieve and share data.
In organizations with troves of information and data, a process to create, tag, and manage data has to be well-established and published so that stakeholders of research data and owners of the knowledge database are well aware of their responsibilities and the importance of how data is managed.
This eliminates tribal knowledge, creates a single source of the truth, and houses multi-variate data to draw inferences from, compare situations too, and get to decisions faster.
Knowledge graphs are created based on queries run by users in a knowledge management tool. These are predefined queries but also living graphs based on intelligent triggers. When a query comes through – schemas have identified that match the keys, and the data is searched for items with these identified schemas. The information is returned in a graphical format to the relevant stakeholders.
It is quick and agile and provides high value in the insights management process.
If you have time please give a visit to QuestionPro. They recently published a blog about Knowledge Management Software.
Knowledge graphs examples
While a relatively new concept, knowledge graphs are still being used by brands and organizations all around us. They use inherent data and leverage machine learning and AI to input variables from different fields to provide the most accurate version of the truth and the most relevant data.
Some examples of knowledge graphs are listed below.
Google search algorithm
The perfect example of a knowledge graph is the Google search or any other search engine. A question like “How many matchsticks can fit in an Olympic-sized pool” would be impossible to answer question one would think. However, the Google search index can correlate the query to multiple data sources and arrive at a conclusion based on relational data to provide a numerical value.
A global retail giant using knowledge graphs for supply chain and inventory management
How do global retail behemoths know they want and need for certain products, discounts, and more? By using multi-variate historical data and nuggets of information from past purchase trends, shopping and shopper behavior, ongoing longitudinal study research, continuous discovery from varied demographic sources, etc.
It is possible to gauge demand and supply and tailor marketing strategies, spending, supply chain management and more to offer the best possible user experience by using the principles of atomic research and leaning on knowledge management tools.
Netflix recommendations on what to watch next!
How often do you wonder what next to watch on Netflix? Netflix uses an intelligent engine to tailor content based on past watching habits, rating on content, time spent watching content, and more, which helps them derive knowledge graphs not just on a micro-scale per user smartly but also on a macro scale based on demographic information.
But you also have recommendations to pick from. These recommendations often work for you, and you find something you would like to watch.
Making knowledge graphs an integral part of insights management
Knowledge graphs are becoming an integral part of research and research teams since they provide model real-world information, use AI and machine learning to perform quick turnaround logical reasoning, provides structured data, and reduces redundancy. Such graphs also help with analytics and are a better way to store and manage information.
Organizations across the globe are leveraging knowledge management systems and tools such as InsightsHub to manage data better, reduce the time to insights and increase the efficiency of past data while lowering costs and increasing ROI.
Incorporating a knowledge graph in your research process for insights management is critical to staying ahead of the curve and making the data do the heavy lifting.