It is usual practice to quantify linear relationships through the Pearson correlation coefficient. To Indicate the strength and direction of the connection between two variables, it takes on a value between -1 and 1.
It can help investors diversify. Calculations from scatter plots of historical returns between pairs of assets, such as equities-bonds, equities-commodities, bonds-real estate, etc., will help investors build risk-return portfolios.
Therefore, we will learn about the Pearson correlation coefficient and know how to measure the relationship between two related variables using it.
What is the Pearson correlation coefficient?
Pearson correlation coefficient or Pearson’s correlation coefficient or Pearson’s r is defined in statistics as the measurement of the strength of the relationship between two variables and their association with each other.
Simply put, Pearson’s correlation coefficient calculates the effect of change in one variable when the other variable changes.
For example, Up till a certain age (in most cases), a child’s height will keep increasing as his/her age increases. Of course, his/her growth depends upon various factors like genes, location, diet, lifestyle, etc.
This approach is based on covariance and, thus, is the best method to measure the relationship between two variables.
When to Use the Pearson Correlation Coefficient?
The Pearson coefficient correlation has a high statistical significance. It looks at the relationship between two variables. It seeks to draw a line through the data of two variables to show their relationship. The relationship of the variables is measured with the help of the Pearson correlation coefficient calculator. This linear relationship can be positive or negative.
For example:
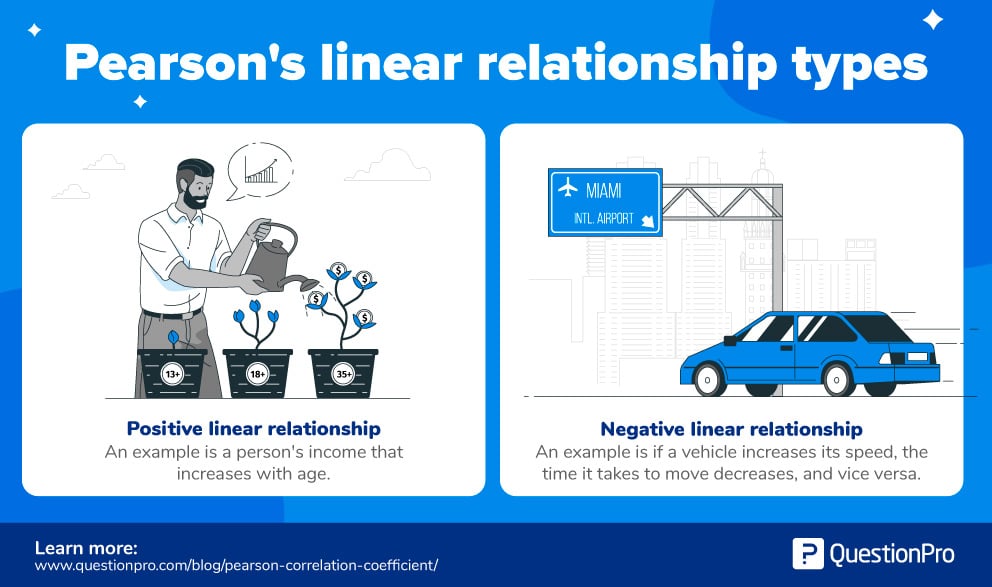
- Positive linear relationship: In most cases, universally, the income of a person increases as his/her age increases.
- Negative linear relationship: If the vehicle increases its speed, the time taken to travel decreases, and vice versa.
From the example above, it is evident that the Pearson correlation coefficient, r, tries to find out two things – the strength and the direction of the relationship from the given sample sizes.
Pearson Correlation Coefficient Formula and Calculation
The correlation coefficient formula finds out the relation between the variables. It returns the values between -1 and 1. Use the below Pearson Coefficient Correlation Calculator to measure the strength of two variables.
Pearson Correlation Coefficient Formula:
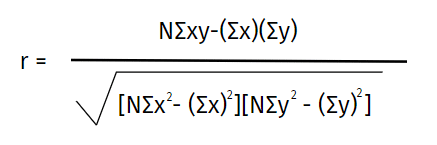
Where:
N = the number of pairs of scores
Σxy = the sum of the products of paired scores
Σx = the sum of x scores
Σy = the sum of y scores
Σx2 = the sum of squared x scores
Σy2 = the sum of squared y scores
Calculation
Here is a step-by-step guide to calculating Pearson’s correlation coefficient:
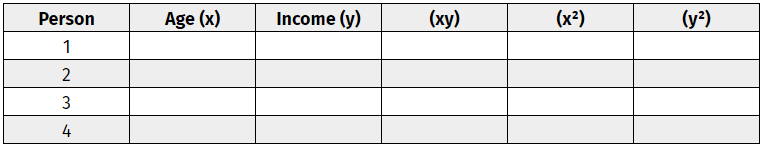
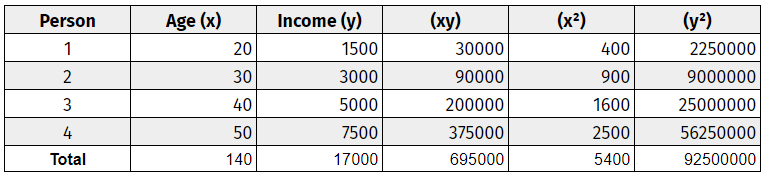
Step one: Create a correlation coefficient table.
Make a data chart, including both variables. Label these variables ‘x’ and ‘y.’ Add three additional columns – (xy), (x^2), and (y^2). Refer to this simple data chart.
Step two: Use basic multiplication to complete the table.
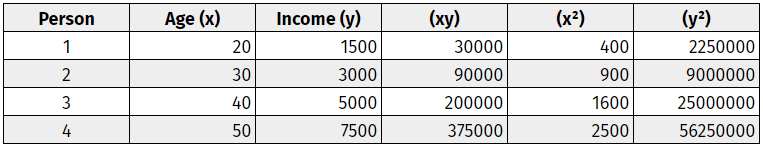
Step three: Add up all the columns from bottom to top.
Step four: Use the correlation formula to plug in the values.
If the result is negative, there is a negative correlation relationship between the two variables. If the result is positive, there is a positive correlation relationship between the variables. Results can also define the strength of a linear relationship, i.e., a strong positive relationship, a strong negative relationship, a medium positive relationship, and so on.
Determining the Strength of the Pearson Product-Moment Correlation Coefficient
The Pearson product-moment correlation coefficient, or simply the Pearson correlation coefficient or the Pearson coefficient correlation r, determines the strength of the linear relationship between two variables.
The stronger the association between the two variables, the closer your answer will incline toward 1 or -1. Attaining values of 1 or -1 signify that all the data points are plotted on the straight line of ‘best fit.’ It means that the change in factors of any variable does not weaken the correlation with the other variable. The closer your answer lies near 0, the more variation in the variables.
How to Interpret the Pearson Correlation Coefficient?
Below are the proposed guidelines for the Pearson coefficient correlation interpretation: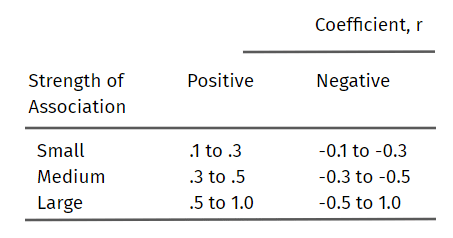
Note that the strength of the association of the variables depends on what you measure and the sample sizes.
On a graph, one can notice the relationship between the variables and make assumptions before even calculating them. The scatterplots, if close to the line, show a strong relationship between the variables.
The closer the scatterplots lie next to the line, the stronger the relationship between the variables. The further they move from the line, the weaker the relationship gets. If the line is nearly parallel to the x-axis due to the scatterplots randomly placed on the graph, it’s safe to assume that there is no correlation between the two variables.
What do the Terms Strength and Direction Mean?
The terms ‘strength’ and ‘direction’ have statistical significance. Here’s a straightforward explanation of the two words:
- Strength: Strength signifies the relationship correlation between two variables. It means how consistently one variable will change due to the change in the other. Values that are close to +1 or -1 indicate a strong relationship. These values are attained if the data points fall on or are very close to the line.
The further the data points move away, the weaker the strength of the linear relationship. When there is no practical way to draw a straight line because the data points are scattered, the strength of the linear relationship is the weakest. - Direction: The direction of the line indicates a positive linear or negative linear relationship between variables. If the line has an upward slope, the variables have a positive relationship.
This means an increase in the value of one variable will lead to an increase in the value of the other variable. A negative correlation depicts a downward slope. This means an increase in the amount of one variable leads to a decrease in the value of another variable.
Examples of Pearson Correlation Coefficient
Let’s look at some visual examples to help you interpret the correlation coefficient table:
Large positive correlation
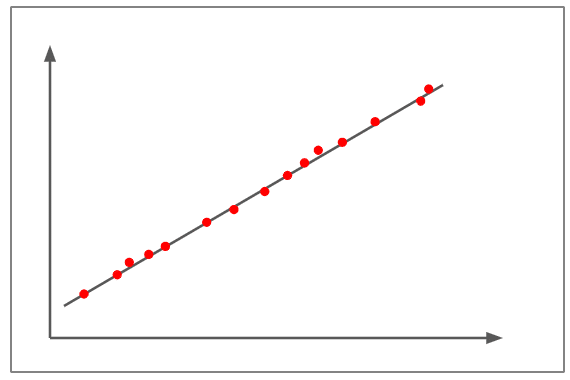
- The above figure depicts a correlation of almost +1.
- The scatterplots are nearly plotted in a straight line.
- The slope is positive, which means that if one variable increases, the other variable also increases, showing a positive linear line.
- This denotes that a change in one variable is directly proportional to the change in the other variable.
- An example of a large positive correlation would be – As children grow, so do their clothes and shoe sizes.
Medium Positive Correlation
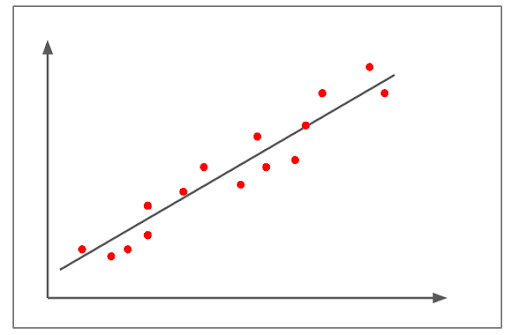
- The figure above depicts a positive correlation.
- The correlation is above +0.8 but below 1+.
- It shows a pretty strong linear uphill pattern.
- An example of a medium positive correlation would be – As the number of automobiles increases, so does the demand for the fuel variable increases.
Small Negative Correlation
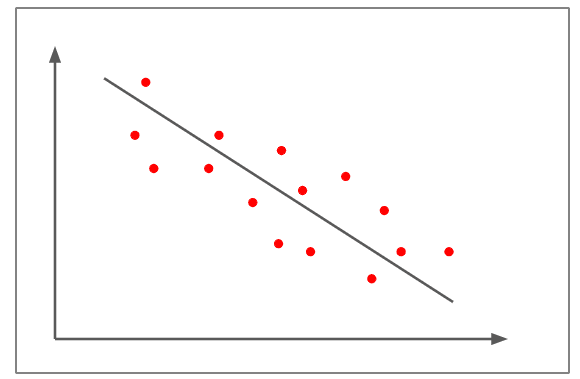
- In the figure above, the scatter plots are not as close to the straight line compared to the earlier examples
- It shows a negative linear correlation of approximately -0.5
- The change in one variable is inversely proportional to the change in the other variable, as the slope is negative.
- An example of a small negative correlation would be that the more somebody eats, the less hungry they get.
Weak / No Correlation
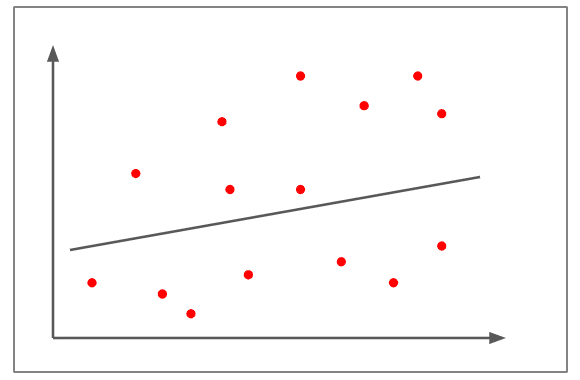
- The scatterplots are far away from the line.
- It is tough to draw a line practically.
- The correlation is approximately +0.15
- It can’t be judged that the change in one variable is directly proportional or inversely proportional to the other variable.
- An example of a weak/no correlation would be that an increase in fuel prices leads to fewer people adopting pets.
T-Test vs Pearson Correlation: What’s the difference?
When analyzing data, it’s important to choose the right statistical method based on what you’re trying to achieve. A T-test and Pearson correlation might seem similar, but they serve different purposes:
- T-test: Used to compare the means of two groups and determine if they are significantly different from each other.
- Pearson Correlation: Measures the strength and direction of the relationship between two continuous variables.
In simple terms, use a T-test when comparing groups and use Pearson correlation when exploring relationships between variables. Understanding the difference helps you make better data-driven decisions!
Final Words About Pearson’s r
The Pearson correlation coefficient can be determined by collecting data on two variables of interest through a survey. You can use this to learn whether the correlation between the two variables is positive or negative and how strong it is.
QuestionPro Research Suite is a suite of tools to leverage research and transform insights that can be used to collect data for Pearson correlation coefficient analysis. After exporting survey data from QuestionPro and importing it into a spreadsheet or statistical application, you can conduct the correlation analysis.
QuestionPro offers helpful data analysis tools such as cross-tabulation, data visualization, and statistical testing, in addition to calculating the correlation coefficient. These qualities can assist in your research and understanding your variables’ interrelationships.
Ready to discover the relationship between your variables and advance your data analysis? Start a QuestionPro free trial today to see how our survey software can help you determine the Pearson correlation coefficient easily. Don’t miss this chance to improve data analysis and research.
Frequently Asked Questions (FAQs)
A good Pearson correlation value is close to +1 or -1. Here, +1 indicates a strong positive correlation, and -1 indicates a strong negative correlation.
0.90 to 1.00 → Very strong
0.70 to 0.89 → Strong
0.40 to 0.69 → Moderate
0.10 to 0.39 → Weak
0.00 to 0.09 → No correlation
Pearson’s correlation is significant if the p-value is less than the chosen significance level (e.g., 0.05 or 0.01), indicating a statistically meaningful relationship between the variables.