Survey data collection can be used to measure many different things, and one of the most key measurements you can make is the perception of your customer base.
Measuring consumer perceptions is key to seeing how they value different features or determine their brand loyalty, and creating a perceptual map template is a great way to diagram these opinions visually.
In this article, we will define perceptual mapping, talk about some of its best applications, and break down how to build one yourself.
What is a Perceptual Map?
A perceptual map is a diagram used by businesses to determine how their customers perceive different items, products, or brands. Gathering customer data builds a viewpoint on how your principal users understand the relative positioning of different products or brands within the greater ecosystem.
While some people compare perceptual maps to positioning a map, they’re actually very different. It only measures the perceived traits of a brand or product, while a brand positioning map compares the actual traits.
For example, compare the viewpoints of a young adult analyzing a car’s safety and a veteran insurance salesman doing the same. Based on commercials, young adults might perceive that Ford makes the safest car. At the same time, the insurance salesman knows through experience and data analysis that Volvo cars get in accidents and boast better passenger safety.
This example helps demonstrate the key difference between perceptual maps and a product positioning map. Perceptual maps only measure the customer’s perception of reality and might not reflect the truth.
Perceptual data mapping is still very helpful to businesses, and it helps create informed decisions about how customers view the general positioning of different brands. Depending on the data collected, they can also accommodate different scopes of comparison, helping businesses compare specific attributes or advantages.
This knowledge is critical to businesses because it helps create strong marketing campaigns based on the feedback you’re receiving from your customer’s journey.
Why Use a Perceptual Map?
A customer’s opinion of your business can be analyzed with the help of a perceptual map. They are essential tools for marketing people. Product managers use perceptual maps to find and talk with product managers.
With the help of it, you can figure out what and how people feel about your product. As such, it is a vital tool for marketing and product teams. Product and marketing involved people can benefit from perceptual maps in the following ways:
Identify market gaps for new products
This shows brands against two or more parameters based on customer perception. Product managers can uncover gaps between consumer wants and existing goods if they evaluate them attentively. From the customer’s perspective, the holes in the perceptual map indicate unmet market needs. This helps begin your study on how a new product might meet those demands.
Launch effective marketing campaigns
Businesses can also use perceptual maps to look at how well a recent marketing effort or change to the marketing mix worked. In fact, a perceptual map is one of the best ways to make a business plan.
Enhance brand identity
A perceptual map helps businesses learn what customers think about their products, which is important for figuring out how to meet their wants by adding new features. This information helps to improve the use of features, customer satisfaction, and company identity.
Understand market segment
Understand market segmentLastly, perceptual maps rely to help you learn more about the different market segments, look at how competitors position themselves over time, figure out how customers’ needs change, and track new goods introduced to the target market segment over time.
Types of Perceptual Map
There are two types of perceptual maps: the standard and the multi-dimensional. Their use depends on the situation. Let’s take a look at each one.
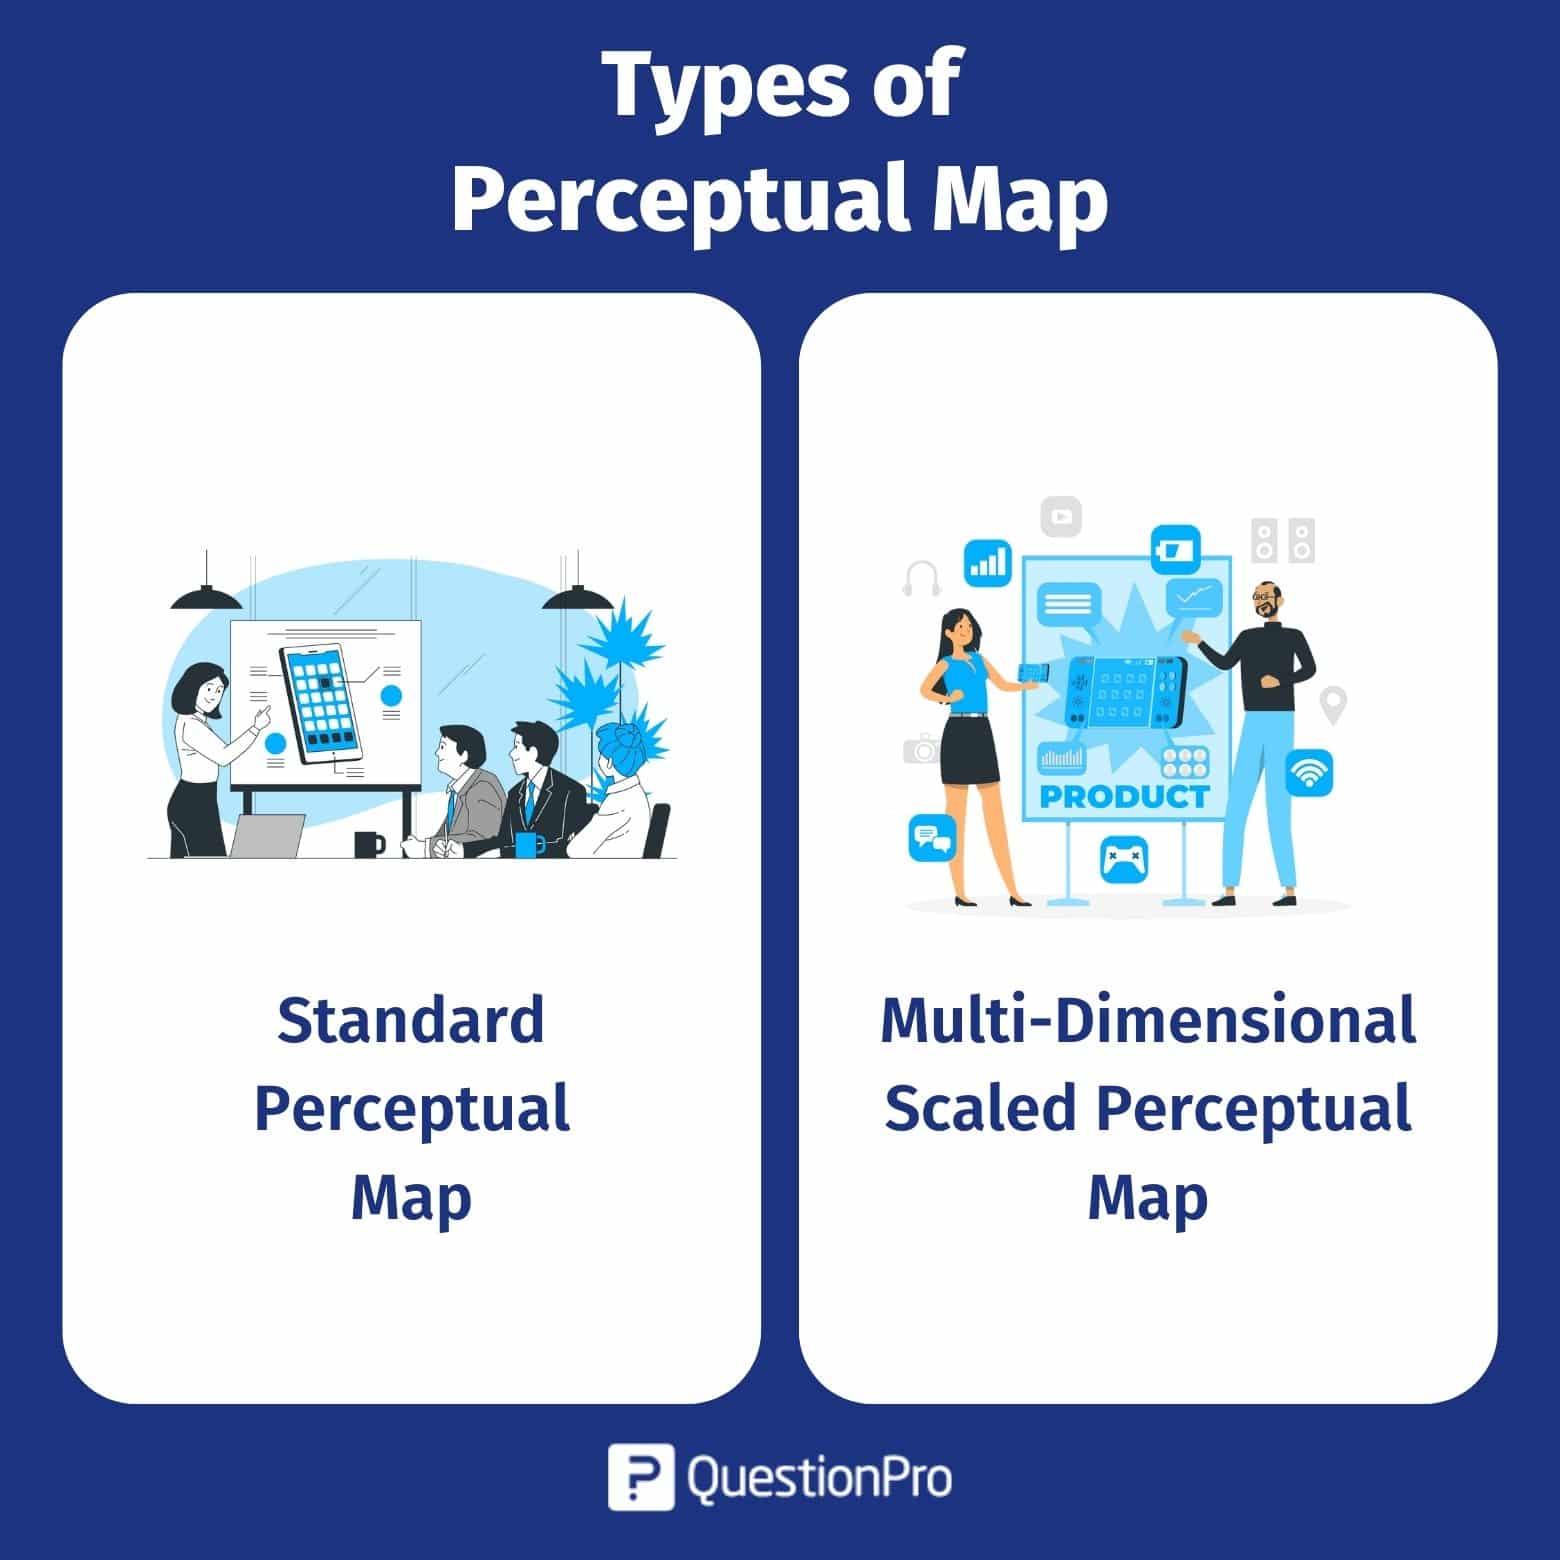
1. Standard perceptual map
The standard perceptual map has two axis and uses visuals to show the most important facts. In other words, a standard perceptual map shows the most important results of a study quickly and with as little trouble as possible.
2. Multi-dimensional scaled perceptual map
A multidimensional scaled perceptual mapping template is used to show overall market research. Statistical tools like the Excel template are used to give more information. Plus, it needs a professional who knows how to map and interpret properly to show important information. This type of perceptual map is used for study on a large scale.
How to Build a Perceptual Map?
To make an accurate perceptual map, you need to know how people see your brand or product and the brands or products of competitors. So, you’ll need to do thorough target market research before building the map.
Follow our steps to create perceptual maps:
1. Pick parameters
When building a perceptual map, the first step is deciding what parameters you want to compare and focus on. These variables will be on your map and placed on the X and Y axes. These variables will usually be determinant attributes.
Determinant attributes are features of a product/service that ultimately convince the buyer to choose that option. They might not be the most important feature, but they are important to the customer.
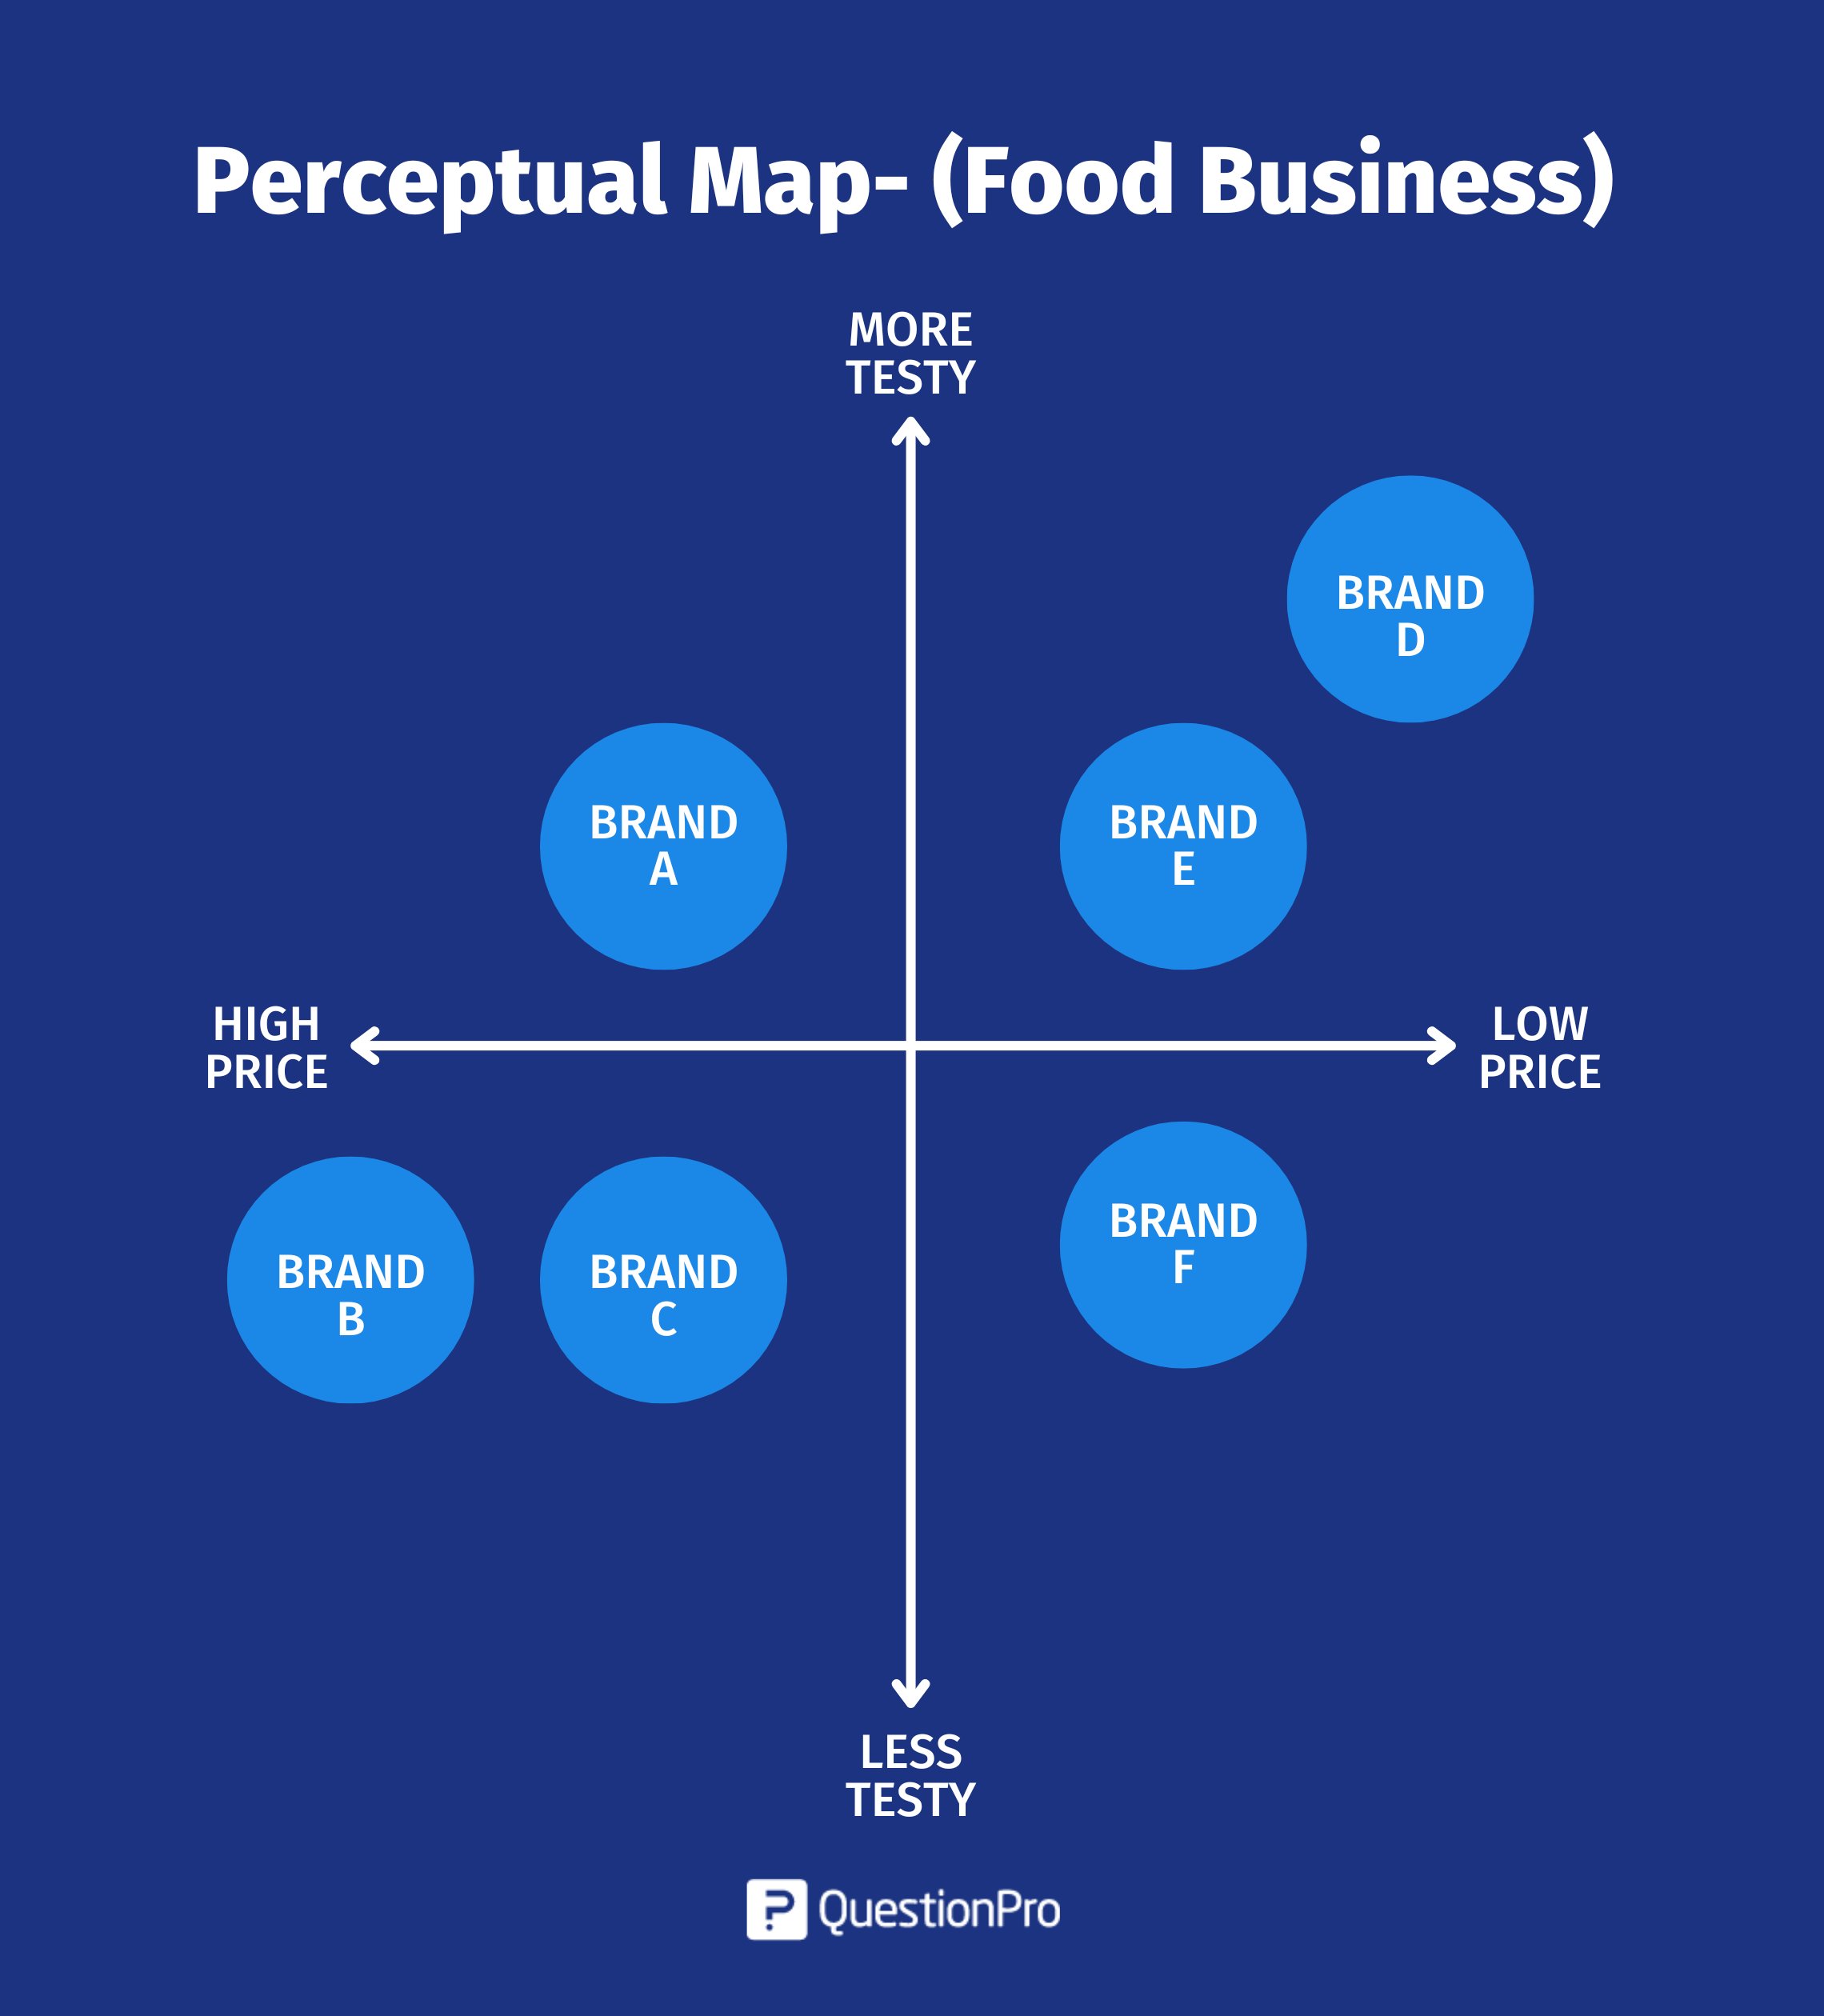
In our car example, some determinant attributes might be comfort, price, top speed, interior design, or safety rating.
Usually, depending on these parameters, the scale is from low to high on each axis, creating different general relations in each quadrant. The placement in the quadrant is important, but the placement relative to the other variables is equally as important. This way, you can analyze your factor’s individual performance and their performance relative to their competition.
2. Define competitors
Once you determine which parameters you want to use, it’s time to distribute surveys, gather customer feedback, and identify competitors. The second part of making a perceptual map is figuring out who your rivals are. The more rivals you add, the better, so try to include at least 10 of them. A big sample size will give you the best idea of where you stand in relation to your competitors.
The best way to do this is to look at what your competitors are doing. A competitive analysis will show you who your main and indirect rivals are, as well as your strengths and weaknesses in comparison to them. QuestionPro offers an incredibly easy way to distribute surveys to your target audience and analyze their feedback. Check out our survey portal to learn more about how to create your own surveys.
3. Place competitors
The next step of building your perceptual map is placing your competitor factors in the matrix and seeing how they compare to one another. Online whiteboards make creating and analyzing a perceptual map incredibly easy while allowing you to manipulate it in whichever way you need.
You can start making your map once you know your business’s parameters and competitors. Draw your map and put the competitors where you think they should be based on what you learned from your competitive analysis.
For example, if you’re trying to figure out where to place your new fashion brand, add ten or more competitors in the fashion business before placing yourself.
By putting your company last, you can look at your competitors first and better understand where you fit. Returning to our car example, the perceptual map might look something like this.
Finally, it’s time to build and share your map when you have all the required elements. The most common diagram for a perceptual map is a simple XY Matrix, with the vertical axis representing one variable and the horizontal axis representing the other. Lastly, show your marketing partners and shareholders your perceptual map to find out if you’re positioning your brand or product correctly. What can you do differently?
Some ideas that might come out of these discussions are:
- Your business plan is too similar to those of your competitors, and you need to set your brand apart from them.
- The way people think about your brand isn’t right, so you need to change your ads.
- You can take advantage of a gap in your business.
- You could gain from a campaign to change how people think about your business.
- You are exactly where you should be. Congrats!
Perceptual Map Applications
As we said earlier, perceptual maps are great tools for comparing any two variables in a customer’s eyes, but they have special importance in some fields.
Product management
Perceptual maps can help product managers who are looking to identify some empty market share that they can capitalize on with a new feature or product. Identify gaps and analyze them in the map. They can see what spaces are unfilled and can also look to see how poor-performing features can be improved.
Not only this, but it can help product managers compare different features of their competition and analyze which are most and least effective in the eyes of the customer. This helps prioritize future changes based on what is used the most.
Marketing teams
Marketing is the field in perceptual maps that are most applicable because it’s a place where customer perceptions are the gold standard of performance. It matters less which product is actually better — what drives a purchase is which product your customer perceives to be better.
Survey data is important to perceptual mapping because you get direct feedback on what campaigns perform best, what customers want, and how you can meet these needs in the future. Not only can perceptual mapping analyze the customer viewpoint, but it’s also a understand for the competitive landscape or market landscape in terms of customer engagement. A perceptual map template helps look into how your customer engages online and what specific information is needed, which is another thing critical for the marketing team.
Sales teams
Perceptual maps are also important to sales teams because they can help narrow down the importance of different variables to the customer. When conducting sales calls and developing sales strategies, discovering what’s important to the user is critical, and conducting research through perceptual mapping is a great way to gain this insight.
When you complete your perceptual map, you might find that functionality trends highly, or maybe price, or even unique features. Depending on this research, you can conduct more effective sales calls and emphasize the elements that convince the user to buy your product/service. These are just some of the applications of perceptual maps, and if you aren’t convinced, here are the biggest advantages to using them.
Perceptual Map Advantages
Perceptual maps have many advantages; as we’ve previously seen, they apply to many scenarios. These are the biggest advantages of building a perceptual map.
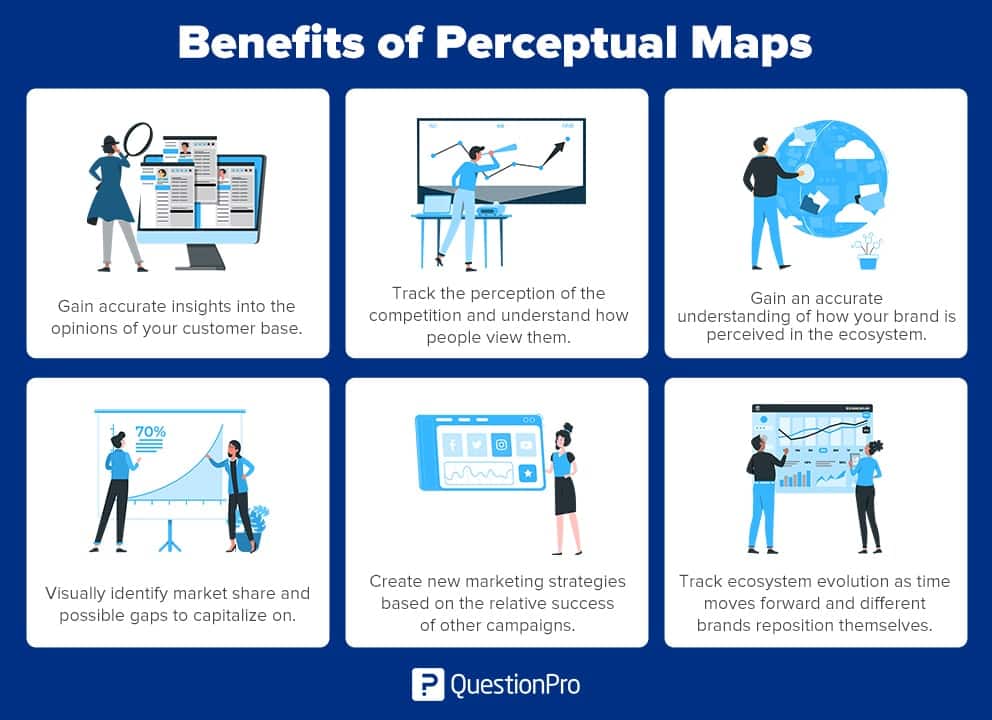
- Gain accurate insights into the opinions of your customer base.
- Understand why customers choose the options related to your determinant attributes.
- Track the perception of the competition and understand how people view them.
- Gain an accurate understanding of how your brand is perceived in the ecosystem.
- Visually identify market share and possible gaps to capitalize on.
- Create new marketing strategies based on the relative success of other campaigns.
- Track ecosystem evolution as time moves forward and different brands reposition themselves.
Perceptual Map Examples
Here are some practical examples of how perceptual maps can assist with launching new products, planning marketing campaigns, enhancing customer engagement, boosting sales, and clarifying brand identity.
1. New Product Launch
Perceptual maps help identify gaps in the market where customer needs aren’t being met. By analyzing these gaps, businesses can see where there’s potential for a new product. For example, if customers feel there’s a lack of affordable, eco-friendly options in a product category, a company might use that insight to develop a new product that fills that specific need.
2. Marketing Campaigns
Perceptual maps are popular in marketing because they reveal what customers like and dislike, both about your brand and competitors. Understanding these preferences can help marketers develop campaigns that hit the mark with their audience.
For example, if a brand finds that customers value healthiness over flavor in snack options, it might highlight nutritional benefits in its ads. Knowing customer perceptions helps marketers craft messages that are more likely to resonate, leading to better campaign performance and return on investment (ROI).
3. Improving Customer Engagement
Perceptual maps also help customer support teams understand where customers interact most frequently and what type of support they prefer. By mapping out these insights, support teams can see areas for improvement and tailor their approach to enhance customer satisfaction.
For example, if a perceptual map shows that customers prefer quick responses via chat over email support, the team can prioritize chat services. This focused approach can lead to more satisfied, loyal customers who appreciate the company’s attention to their preferences.
4. Boosting Sales
Sales teams benefit from perceptual maps by understanding the factors that matter most to their target market. This knowledge enables them to focus their sales pitches on key customer pain points and preferences.
For example, a perceptual map may reveal that affordability and ease of use are top priorities for a particular customer segment. Knowing this, sales reps can customize their conversations around these points, creating a more compelling pitch that aligns with what customers care about most. This customer-focused approach can increase the likelihood of closing a sale.
5. Determining Brand Identity
Perceptual maps are also valuable for clarifying brand identity. Businesses can survey customers on key brand attributes and map the findings to see if their intended brand image aligns with customer perception.
For example, if a brand wants to be seen as premium and innovative, but customers perceive it as expensive and outdated. This disconnect becomes apparent on the perceptual map. Recognizing such gaps allows businesses to make necessary adjustments to their brand messaging and ensure the identity they project aligns with customer expectations.
How to Create a Perceptual Map Template?
Let’s explore a perceptual map template to help you visualize and compare different products or brands based on key attributes. It’s easy to use and designed to save you time when analyzing market data.
To fill it out, simply choose two important attributes for your analysis, such as price vs. quality or innovation vs. reliability. Then, plot your products or brands along these axes based on how they are perceived by your target audience. With this template, you can quickly identify market gaps, strengths, and areas for improvement.
Download Perceptual Map Template
1. Define Key Attributes
Choose two relevant and distinctive attributes for the map. These should be important to consumers, like price, quality, level of innovation, style, customer service, etc.
2. Select Competitors
Identify the brands or products you want to include on the map. Ideally, these should be direct or indirect competitors in your market.
3. Conduct an Analysis and Place Yourself in the Quadrant
Analyze and place yourself in the quadrant you believe best fits your position.
4. Analyze and Adjust Strategy
Observe how brands cluster on the map. This can reveal market opportunities or areas where your product might differentiate itself. Identify gaps or niches on the map that your brand could fill.
If you follow these steps correctly, your Perceptual Map should look something like this:
Conclusion
The perceptual map is a very useful tool for businesses because it shows how customers see things and what they like. It helps find market opportunities, figure out how you stack up against the competition, and make strategic choices that meet customer needs well.
By using what they learn from the visual map, businesses can improve their perceptual map marketing strategies, strengthen how customers see their brands, and, in the end, make customers happy and grow their businesses. It is a valuable tool that is always changing today’s market.
If you are interested in learning about the state of your professional ecosystem, perceptual mapping is a great option for you to choose. Hopefully, you liked this guide, and if you’re looking to learn about other brainstorming methods, check out our overview of mind maps on Fresco.
Frequently Asked Questions (FAQs)
A: Perceptual charts only measure how people think a brand’s traits are, but placement maps measure the real traits. Compare how a young person looks at a car’s safety with how older insurance does the same thing.
Generally, there are 2 types of perceptual maps
1. Standard perceptual map
2. Multi-dimensional scaled perceptual map
A perceptual map shows how customers think about how different products or companies compare to each other based on certain attributes or dimensions.