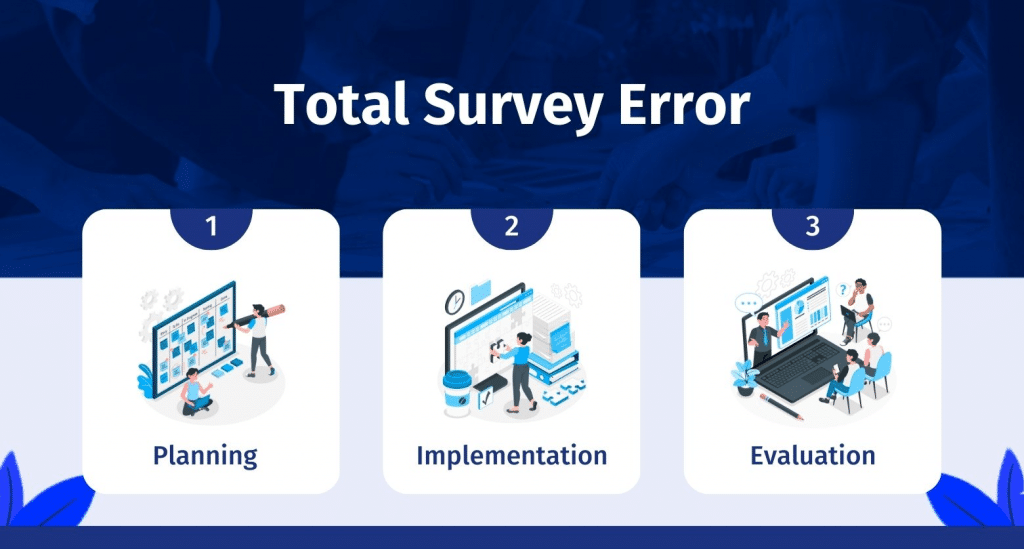
Total survey error (TSE) is a term for the many possible sources of error in survey research, affecting how accurate and valid survey results are. Errors like these can happen at different points in the survey process, from planning and sampling to gathering and analyzing data.
Researchers and policymakers who use survey data to make decisions need to consider TSE because it can affect how good and useful survey results are. Understanding where TSE comes from and its means are important for making survey research more reliable and accurate.
So in this blog, we will describe how to plan, implement, and evaluate total survey error.
What is total survey error?
Total survey error (TSE) is how a survey’s results can differ from the real value of the population the survey is trying to measure. It is a broad idea that includes all possible error types in a survey, such as sampling, measurement, coverage, and non-response errors.
Sampling error happens when a small portion of the population is surveyed instead of the whole population. Problems with the survey instrument or how the questions are asked can cause measurement errors.
Coverage error happens when the survey sample doesn’t include all parts of the population. The non-response error happens when people who are supposed to complete the survey don’t. This makes the sample less accurate.
Total survey error is an important concept in survey research because it can affect the validity and reliability of the results. Total survey error can be reduced by paying close attention to the survey design, sampling methods, data collection, and analysis.
Researchers can ensure their survey results are accurate and representative of the population they’re studying by reducing the number of places where survey mistakes can happen.
Planning, implementation, and evaluation of total survey error
Total survey error, an essential notion in survey research, describes the combined effect of all potential sources of mistake that could have an impact on survey results. The validity and dependability of the survey results depend on careful planning, implementation, and evaluation of total survey error.

Total survey error planning
- Design: Identifying and correcting potential sources of error in the survey design, data collection, and data processing procedures is referred to as planning for total survey error. To do this, it is crucial to detail the demographic of interest and the survey objectives. This guarantees that the survey’s questions and techniques are appropriate.
- Develop: The next stage is to create the survey in accordance with best practices to guarantee that the questions are accurate, fair, and legitimate. It is also necessary to take into account factors like sample techniques, response rates, and data collection methods (such as phone, online, and mail). A sampling strategy must be developed to ensure that the sample is representative of the population of interest.
- Pre-test: Another important stage is to pre-test the survey in order to find and fix any potential problems with the questions, guidelines, or data-gathering procedure. Also, survey employees should receive training on how to consistently adhere to standard protocols and reduce sources of error such as measurement bias, interviewer effects, and non-response bias.
Total survey error implementation
- Implementation: Reducing and controlling potential sources of error during the survey design, data collection, and data analysis processes are all part of the entire survey error implementation. Throughout the survey process, a quality control plan should be created to track and manage any sources of inaccuracy. This strategy should contain steps for resolving missing or inconsistent data as well as verifications of the consistency and completeness of the data.
- Monetization: Monitoring data collection is another crucial step to ensure that procedures are being followed consistently and that potential causes of mistakes are being addressed. It’s also crucial to clean and amend the data to guarantee correctness and completeness. To locate and rectify potential causes of inaccuracy, data analysis should be done using the proper statistical analysis plan.
Total survey error evaluation
- Comparison: While determining the total survey error, the survey results are compared to other information sources or industry standards. It is also essential to provide the survey’s findings, including an explanation of the many kinds and causes of inaccuracy and how they could affect the findings.
- Follow-up: It may be beneficial to conduct follow-up surveys to correct any discovered sources of mistakes or confirm the initial survey findings. The quality and accuracy of the survey results can be increased by using the methods outlined above to limit and control potential sources of error throughout the survey process.
When conducting a survey, it is essential to consider total survey error. A thorough and methodical methodology that ensures the validity and dependability of the survey data is needed for planning, implementing, and reviewing total survey errors.
Survey researchers can reduce potential sources of error and achieve precise and significant survey results by adhering to these measures.
Sources of total survey error
The goal of optimal survey design is to minimize total survey error (TSE) within cost and timeliness restrictions that are consistent with other user-centric quality dimensions.
Meticulous planning is needed to allocate resources to survey stages to control significant sources of error. The goal is not to conduct every stage of the survey as error-free as feasible because that would exceed the survey budget and/or timetable.
Some procedures will always have survey errors, even with limitless funding and time. Instead, the goal is to avoid the worst errors and control others so they are mostly irrelevant and bearable.
Decomposing the error into smaller and smaller components makes it easier to address the most serious errors through careful survey design. One such decomposition divides the TSE into two parts:
- Sampling error and
- Non-sampling error.
To more accurately pinpoint the sources of error, it is typically necessary to decompose both types of survey error.
The sources of sampling error can be broken down into three groups:
- The sampling method: This is about how the sample is chosen from the population. Sampling error may be introduced if the sampling technique is biased or flawed.
- The size of the sample: This is the total number of people or observations in the sample. If the sample size is too small, it might not accurately represent the population, which would result in sampling error.
- The choice of estimator: This is the statistical method used to estimate a population parameter based on sample data. Choosing an estimator can change how precise and accurate the estimate is, which can lead to sampling error.
Non-sampling error can be further broken down into:
- Specification error: This happens when the research question, hypothesis, or sampling design is wrong, which leads to biased results.
- Frame error: This happens when the sampling frame used to identify the population is incomplete, outdated, or inaccurate, leading to a biased sample.
- Non-response error: This happens when some people in the sample don’t answer the survey or study, which could make the results biased.
- Measurement error: This refers to mistakes or inaccuracies that happen when measuring or gathering data, such as mistakes in recording or reporting data or errors in the measurement tools or instruments used.
- Processing error: This refers to mistakes that happen when data is being processed or analyzed, such as mistakes in data entry, data manipulation, or data analysis.
Benefits of identifying total survey error
To make the right design decisions, you have to think about a lot of quality and cost factors at the same time and choose the combination of design features and parameters that reduces the total survey error (TSE) while staying within all the constraints.
To help with the design process, it is important to have a way to figure out how much the whole survey process is off. So, different survey designs that meet the given constraints can be compared using their TSE to measure the best design.
For example, let’s say there are two survey designs, X and Y, and both meet the cost and other requirements for the survey. But the TSE for design X is 25% less than the TSE for design Y when it comes to the most important things to be measured in the study. Design X is obviously the best choice, assuming all other things are the same.
So, summing up and measuring the total error in a survey process gives a way to choose between different designs.
A measure of TSE could also help survey staff decide how to use their time and money to reduce survey error.
As an example, let’s say we could prove that non-response is a major cause of survey error for a certain design. This means that if you want to improve the quality of the survey data for this design, you should try to reduce the effect of people who don’t answer the survey.
Then, if needed, the survey design could be changed to reduce the effects of people not responding. If the TSE goes down as a result of this strategy, the design will be closer to being the best it can be.
For example, moving resources from frame construction to following up with people who didn’t respond could reduce TSE even though frame error would increase.
Conclusion
Total survey error includes sampling, non-response, measurement, and other types of survey error. To achieve accurate and reliable survey results, researchers should recognize and address these potential causes of error.
Survey researchers can improve data quality, validity, and reliability by carefully planning, designing, and implementing their surveys. Recognizing that some amount of error will always be present in survey data and that total survey error cannot be entirely eradicated is also crucial.
Survey researchers should also evaluate how these inaccuracies may affect their findings and communicate this information to their audiences. By doing so, companies may ensure that their survey results are reliable and useful for policymaking and decision-making.
QuestionPro is an effective tool that can assist survey designers in reducing total survey errors. QuestionPro can help ensure that surveys are accurate, reliable, and representative of the target population by giving different sampling options, advice on question design, and implementing data quality checks.
Using QuestionPro can lead to more reliable survey results, which can help researchers make better decisions and get better research results.


