• Skip to main content
  • Skip to primary sidebar
  • Skip to footer
QuestionPro

QuestionPro

questionpro logo
  • Products
    survey software iconSurvey softwareEasy to use and accessible for everyone. Design, send and analyze online surveys.research edition iconResearch SuiteA suite of enterprise-grade research tools for market research professionals.CX iconCustomer ExperienceExperiences change the world. Deliver the best with our CX management software.WF iconEmployee ExperienceCreate the best employee experience and act on real-time data from end to end.
  • Solutions
    IndustriesGamingAutomotiveSports and eventsEducationGovernment
    Travel & HospitalityFinancial ServicesHealthcareCannabisTechnology
    Use CaseAskWhyCommunitiesAudienceContactless surveysMobile
    LivePollsMember ExperienceGDPRPositive People Science360 Feedback Surveys
  • Resources
    BlogeBooksSurvey TemplatesCase StudiesTrainingHelp center
  • Features
  • Pricing
Language
  • English
  • Español (Spanish)
  • Português (Portuguese (Brazil))
  • Nederlands (Dutch)
  • العربية (Arabic)
  • Français (French)
  • Italiano (Italian)
  • 日本語 (Japanese)
  • Türkçe (Turkish)
  • Svenska (Swedish)
  • Hebrew IL (Hebrew)
  • ไทย (Thai)
  • Deutsch (German)
  • Portuguese de Portugal (Portuguese (Portugal))
Call Us
+1 800 531 0228 +1 (647) 956-1242 +52 999 402 4079 +49 301 663 5782 +44 20 3650 3166 +81-3-6869-1954 +61 2 8074 5080 +971 529 852 540
Log In Log In
SIGN UP FREE

Home Market Research

Standard Deviation: What it is, + How to calculate + Uses

The standard deviation measures descriptive statistics variability. It is for calculating difference between individual data and the mean.

The standard deviation is one of the most important statistical measures used to calculate a research sample. It is also a measure of risk that analysts, portfolio managers, and advisors use.

In this blog, we will explain what it is, what it can be used for, and a step-by-step guide to calculate it.

Content Index hide
1 What is the standard deviation?
2 Importance of Standard Deviation
3 The formula for calculating a sample’s standard deviation
4 Step-by-step Guide to Calculate Standard Deviation
5 Uses of the Standard Deviation
6 Conclusion

What is the standard deviation?

The standard deviation is a measure of spread or variability in descriptive statistics. It is used for calculating the variance or spread by which individual data points differ from the mean.

A low deviance implies that the data points are extremely close to the mean, whereas a high deviance suggests that the data is spread out over a wider range of values. 

In marketing, variance can assist in accounting for big variations in expenses or revenues. It also helps identify the dispersion of asset prices in relation to their average price and market volatility.

Importance of Standard Deviation

The standard deviation is an important metric in statistical analysis. Some of the reasons for this include:

  • It includes all observations.

One good thing about bias is that every piece of data is taken into account in the research. Other ways to measure deviation, like range, only look at the far-apart points and don’t consider the places in the middle. Because of this, the standard deviation is often seen as a more accurate and reliable way to measure than other data.

  • It can be used in combination.

Using a certain method, the standard deviations of two sets of data can be added together. There are no methods like this for other observational measures of dispersion in statistics. Also, unlike other ways of observing, it can be used in other math calculations.

  • It tells us when a set is unequally distributed.

Deviance is very beneficial when determining how unevenly your data set is distributed. It not only tells you the breadth of your data but also its unequal distribution.

  • It supports mathematical and statistical analysis.

The standard deviation value is always set and well-defined, allowing for both mathematical and statistical analysis.

  • It enables us to determine the risk of an investment.

The number of data points that depart from the mean can be used to calculate an investment’s risk. The greater the deviation from the mean, the more risky the investment.

LEARN ABOUT: Descriptive Analysis

The formula for calculating a sample’s standard deviation

The standard deviation is an important factor in determining the size of the research sample. The formula for calculating it is as follows:
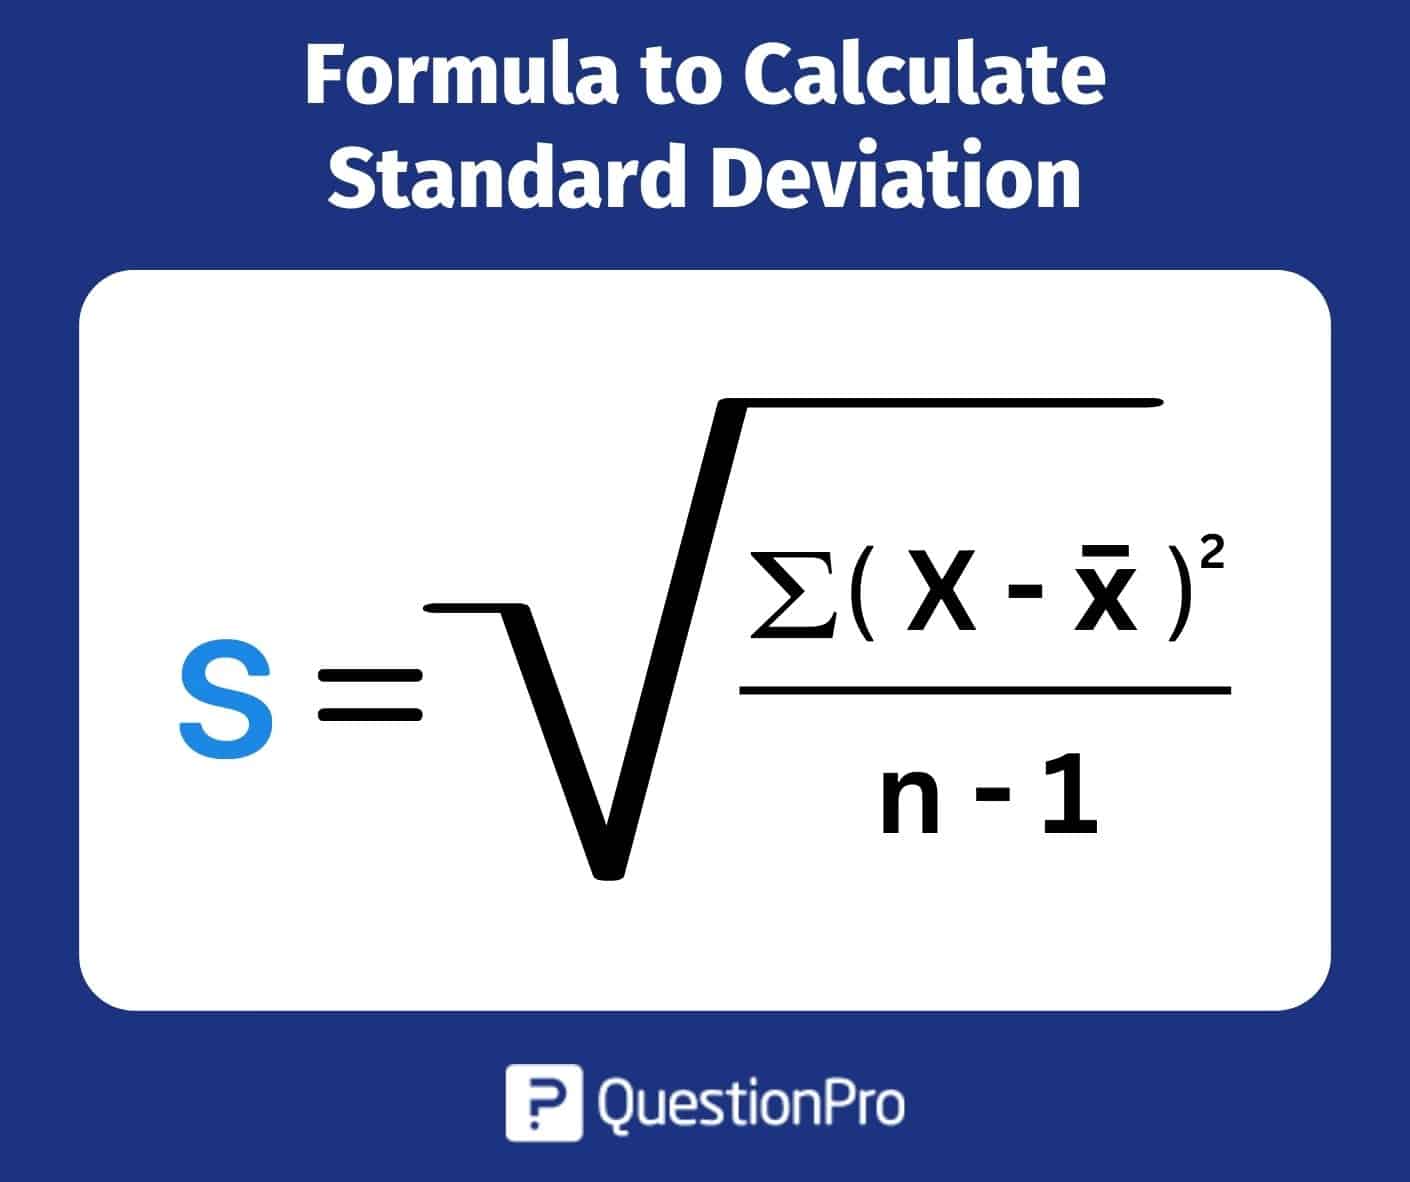
Where,

  • S = Standard deviation.
  • ∑ = Sum of.
  • X = Each value.
  • x̅ = Sample mean.
  • n = number of values in the sample.

Step-by-step Guide to Calculate Standard Deviation

Follow these steps to calculate a sample’s standard deviation:

Step 01: Collect your data

Collect the dataset for which the standard deviation is to be calculated. Assume you have a data set (45, 67, 30, 58, 50) and a sample of size n = 5.

Step 02: Find the mean

Calculate the sample mean (average) by adding all of the data points and dividing by the sample size n.

  • Sample Mean x̅ = (45+67+30+58+50)/n = 250/5 = 50

Step 03: Calculate the differences from the mean

Subtract the sample mean (x̅) from each data point (X).

Difference = X – x̅

  • 45, difference = X – x̅ = 45 – 50 = – 4
  • 67, difference = X – x̅ = 67 – 50 = 17
  • 30, difference = X – x̅ = 30 – 50 = – 20
  • 58, difference = X – x̅ = 58 – 50 = 8
  • 50, difference = X – x̅ = 50 – 50 = 0

Step 04: Square the differences

Square each difference acquired in the previous step.

Squared difference = (X – x̅)2

  • 45, Squared difference = (X – x̅)2 = (45 – 50)2 = (- 4)2 = 16
  • 67, Squared difference = (X – x̅)2 = (67 – 50)2 = (17)2 = 289
  • 30, Squared difference = (X – x̅)2 = (30 – 50)2 = (- 20)2 = 400
  • 58, Squared difference = (X – x̅)2 = (58 – 50)2 = (8)2 = 64
  • 50, Squared difference = (X – x̅)2 = (50 – 50)2 = (0)2 = 0

Step 05: Sum the squared differences

Add all the squared differences together.

∑(squared difference) = ∑[(X – x̅)2]= 16 + 289 + 400 + 64 + 0 = 769

Step 06: Calculate the variance

To get the variance, divide the sum of squared differences by (n – 1).

  • Variance (S²) = Σ(squared difference) / (n – 1) = 769/4 = 192.25

Step 07: Calculate the standard deviation

Finally, calculate the standard deviation by taking the square root of the variance.

  • Standard Deviation (S) = √variance = √ 192.25 = 13.875

LEARN ABOUT: Statistical Analysis Methods

Uses of the Standard Deviation

The standard deviation is a useful statistical measure that has several uses. Here are five common uses:

01. Measure investment risk

Many investing companies utilize the standard deviation to determine how far the fund’s performance deviates from the expected return. This data may be communicated to end users and investors because it is simple to understand.

In this way, the deviation allows us to measure the riskiness of market securities and forecast future performance patterns.

02. A better understanding of the data sets

It is used to calculate the spread of values in a data set. Individuals and businesses utilize bias all the time in various sectors to better understand data sets.

03. Understand ad performance

Marketers frequently calculate the standard deviation of revenue earned for each ad to understand the revenue fluctuation to be expected for a given ad. 

You may also calculate the variation in the amount of advertising used by competitors in this area to see whether they are utilizing more or fewer ads than usual during a certain period.

04. In human resources

The recruiting manager’s responsibility includes calculating the standard deviation of pay in a certain field in order to determine what type of salary variation to provide for new hires.

LEARN ABOUT: Average Order Value

Conclusion

The standard deviation is a useful statistical measure for determining the variability and dispersion of data points within a dataset. It is frequently used in a variety of fields for a variety of objectives.

Standard deviation describes data variability, assesses risk and volatility, monitors processes, evaluates performance, and supports hypothesis testing and statistical inference by quantifying the dispersion of data around the mean.

QuestionPro is a popular online survey and research platform that offers a variety of tools and capabilities for creating, publishing, and analyzing surveys. It has an easy-to-use interface, a variety of question types, customization possibilities, and powerful reporting tools.

QuestionPro can be used to collect data for analysis and to calculate statistical measurements such as standard deviation. To obtain responses from participants, researchers and analysts can develop surveys utilizing Likert scale questions, rating scales, or other data collection approaches.

Users can efficiently collect data, including the information needed to determine standard deviation, and further examine patterns, trends, and relationships within their data by using QuestionPro in the research process.


SHARE THIS ARTICLE:

About the author
Anas Al Masud
Digital Marketing Lead, Content Editor, and Writer at QuestionPro. Over 9 years of experience in digital marketing, SEO-friendly content creation, and boosting online visibility.
View all posts by Anas Al Masud

Primary Sidebar

Research what's on your mind. Find out what's on theirs!

A suite of tools to leverage research and transform insights.

Discover our insight platform

RELATED ARTICLES

HubSpot - QuestionPro Integration

Insight: Definition & meaning, types and examples

Aug 19,2024

HubSpot - QuestionPro Integration

Release Notes July 2022

Aug 01,2022

HubSpot - QuestionPro Integration

BMW Customer Journey: Car Buying Journey Innovation & Evolution

Jul 13,2023

BROWSE BY CATEGORY

  • Academic
  • Academic Research
  • Artificial Intelligence
  • Assessments
  • Audience
  • Brand Awareness
  • Business
  • Case Studies
  • Communities
  • Consumer Insights
  • Customer effort score
  • Customer Engagement
  • Customer Experience
  • Customer Loyalty
  • Customer Research
  • Customer Satisfaction
  • CX
  • Employee Benefits
  • Employee Engagement
  • Employee Engagement
  • Employee Retention
  • Enterprise
  • Events
  • Forms
  • Friday Five
  • General Data Protection Regulation
  • Guest Post
  • Insights Hub
  • Life@QuestionPro
  • LivePolls
  • Market Research
  • Marketing
  • Mobile
  • Mobile App
  • Mobile diaries
  • Mobile Surveys
  • New Features
  • non-profit
  • NPS
  • Online Communities
  • Polls
  • Question Types
  • Questionnaire
  • QuestionPro
  • QuestionPro Products
  • Release Notes
  • Research Tools and Apps
  • Revenue at Risk
  • Startups
  • Survey Templates
  • Surveys
  • Tech News
  • Tips
  • Training
  • Training Tips
  • Trending
  • Tuesday CX Thoughts (TCXT)
  • Uncategorized
  • VOC
  • Webinar
  • Webinars
  • What’s Coming Up
  • Workforce
  • Workforce Intelligence

Footer

MORE LIKE THIS

survey-platforms-for-employee-listening

Top 11 Survey Platforms for Employee Listening in 2025

May 12, 2025

Macy's -NPS-2025

Macy’s NPS & Customer Experience Insight in 2025

May 9, 2025

Medtech Market Research

MedTech Market Research: Fueling Innovation in 2025

May 8, 2025

customer-retention-strategies

15 Top Customer Retention Strategies to Boost Loyalty in 2025

May 8, 2025

Other categories

  • Academic
  • Academic Research
  • Artificial Intelligence
  • Assessments
  • Audience
  • Brand Awareness
  • Business
  • Case Studies
  • Communities
  • Consumer Insights
  • Customer effort score
  • Customer Engagement
  • Customer Experience
  • Customer Loyalty
  • Customer Research
  • Customer Satisfaction
  • CX
  • Employee Benefits
  • Employee Engagement
  • Employee Engagement
  • Employee Retention
  • Enterprise
  • Events
  • Forms
  • Friday Five
  • General Data Protection Regulation
  • Guest Post
  • Insights Hub
  • Life@QuestionPro
  • LivePolls
  • Market Research
  • Marketing
  • Mobile
  • Mobile App
  • Mobile diaries
  • Mobile Surveys
  • New Features
  • non-profit
  • NPS
  • Online Communities
  • Polls
  • Question Types
  • Questionnaire
  • QuestionPro
  • QuestionPro Products
  • Release Notes
  • Research Tools and Apps
  • Revenue at Risk
  • Startups
  • Survey Templates
  • Surveys
  • Tech News
  • Tips
  • Training
  • Training Tips
  • Trending
  • Tuesday CX Thoughts (TCXT)
  • Uncategorized
  • VOC
  • Webinar
  • Webinars
  • What’s Coming Up
  • Workforce
  • Workforce Intelligence

questionpro-logo-nw
Help center Live Chat SIGN UP FREE
  • Sample questions
  • Sample reports
  • Survey logic
  • Branding
  • Integrations
  • Professional services
  • Security
  • Survey Software
  • Customer Experience
  • Workforce
  • Communities
  • Audience
  • Polls Explore the QuestionPro Poll Software - The World's leading Online Poll Maker & Creator. Create online polls, distribute them using email and multiple other options and start analyzing poll results.
  • Research Edition
  • LivePolls
  • InsightsHub
  • Blog
  • Articles
  • eBooks
  • Survey Templates
  • Case Studies
  • Training
  • Webinars
  • All Plans
  • Nonprofit
  • Academic
  • Qualtrics Alternative Explore the list of features that QuestionPro has compared to Qualtrics and learn how you can get more, for less.
  • SurveyMonkey Alternative
  • VisionCritical Alternative
  • Medallia Alternative
  • Likert Scale Complete Likert Scale Questions, Examples and Surveys for 5, 7 and 9 point scales. Learn everything about Likert Scale with corresponding example for each question and survey demonstrations.
  • Conjoint Analysis
  • Net Promoter Score (NPS) Learn everything about Net Promoter Score (NPS) and the Net Promoter Question. Get a clear view on the universal Net Promoter Score Formula, how to undertake Net Promoter Score Calculation followed by a simple Net Promoter Score Example.
  • Offline Surveys
  • Customer Satisfaction Surveys
  • Employee Survey Software Employee survey software & tool to create, send and analyze employee surveys. Get real-time analysis for employee satisfaction, engagement, work culture and map your employee experience from onboarding to exit!
  • Market Research Survey Software Real-time, automated and advanced market research survey software & tool to create surveys, collect data and analyze results for actionable market insights.
  • GDPR & EU Compliance
  • Employee Experience
  • Customer Journey
  • Synthetic Data
  • About us
  • Executive Team
  • In the news
  • Testimonials
  • Advisory Board
  • Careers
  • Brand
  • Media Kit
  • Contact Us

QuestionPro in your language

  • English
  • Español (Spanish)
  • Português (Portuguese (Brazil))
  • Nederlands (Dutch)
  • العربية (Arabic)
  • Français (French)
  • Italiano (Italian)
  • 日本語 (Japanese)
  • Türkçe (Turkish)
  • Svenska (Swedish)
  • Hebrew IL (Hebrew)
  • ไทย (Thai)
  • Deutsch (German)
  • Portuguese de Portugal (Portuguese (Portugal))

Awards & certificates

  • survey-leader-asia-leader-2023
  • survey-leader-asiapacific-leader-2023
  • survey-leader-enterprise-leader-2023
  • survey-leader-europe-leader-2023
  • survey-leader-latinamerica-leader-2023
  • survey-leader-leader-2023
  • survey-leader-middleeast-leader-2023
  • survey-leader-mid-market-leader-2023
  • survey-leader-small-business-leader-2023
  • survey-leader-unitedkingdom-leader-2023
  • survey-momentumleader-leader-2023
  • bbb-acredited
The Experience Journal

Find innovative ideas about Experience Management from the experts

  • © 2022 QuestionPro Survey Software | +1 (800) 531 0228
  • Sitemap
  • Privacy Statement
  • Terms of Use