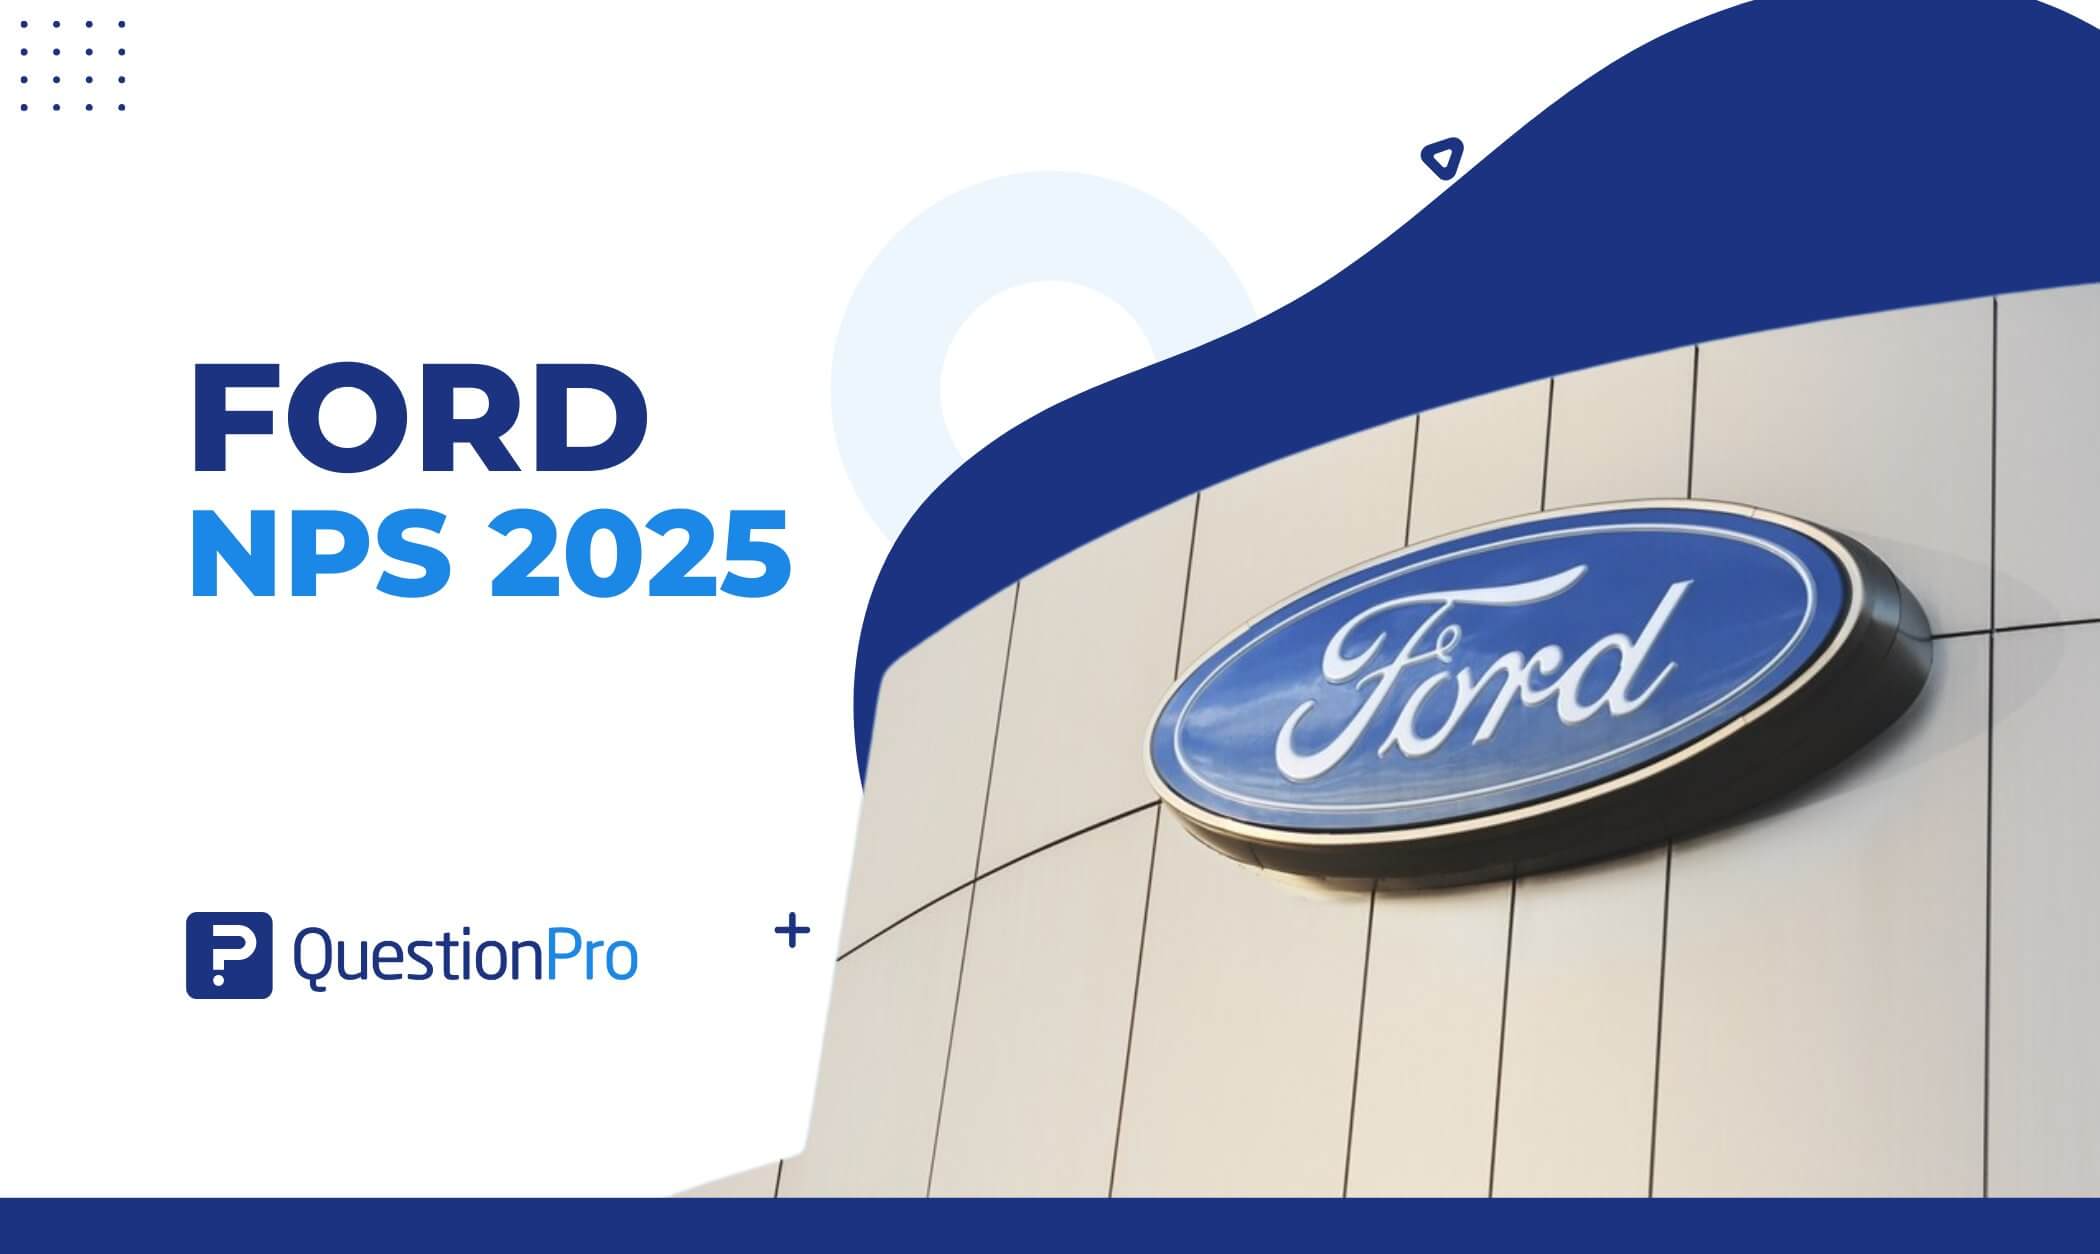
What makes a customer return for another ride with the same car brand? For some, it’s about dependability. For others, it’s about how the car makes them feel, from buying to every mile driven. Ford has been a household name for generations, but how does it measure up when it comes to customer loyalty in 2025?
According to QuestionPro’s Q1 2025 Benchmarking NPS and CSAT Report, the results are mixed. Ford remains a trusted name in American automotive culture, but more work remains to turn more customers into passionate promoters.
What is Net Promoter Score (NPS)?
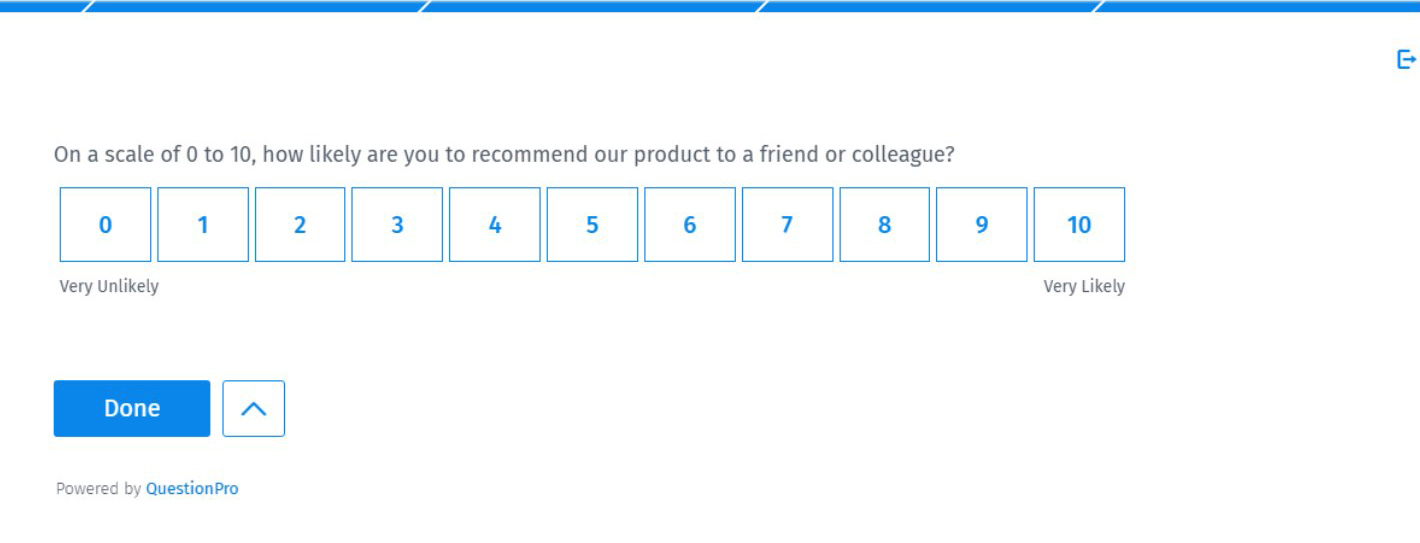
The Net Promoter Score (NPS) is a quick yet powerful way to measure customer loyalty. It’s based on one simple question:
“On a scale from 0 to 10, how likely are you to recommend our products or services to a friend or colleague?”
The responses fall into three groups:
- Promoters (9–10): Happy and loyal customers will likely refer others.
- Passives (7–8): Satisfied but neutral; not likely to promote the brand.
- Detractors (0–6): Unhappy customers who may discourage others from buying.
The score is calculated as: NPS = % Promoters – % Detractors
An NPS above 0 is good, above 50 is excellent, and anything negative is a red flag.
Ford NPS Score Breakdown and Performance in 2025
According to QuestionPro’s Q1 2025 NPS and CSAT Benchmarking Report, the average NPS for the automotive industry is 41. Ford falls short of this benchmark with a Net Promoter Score of 32.
Here is Ford NPS score’s breakdown:
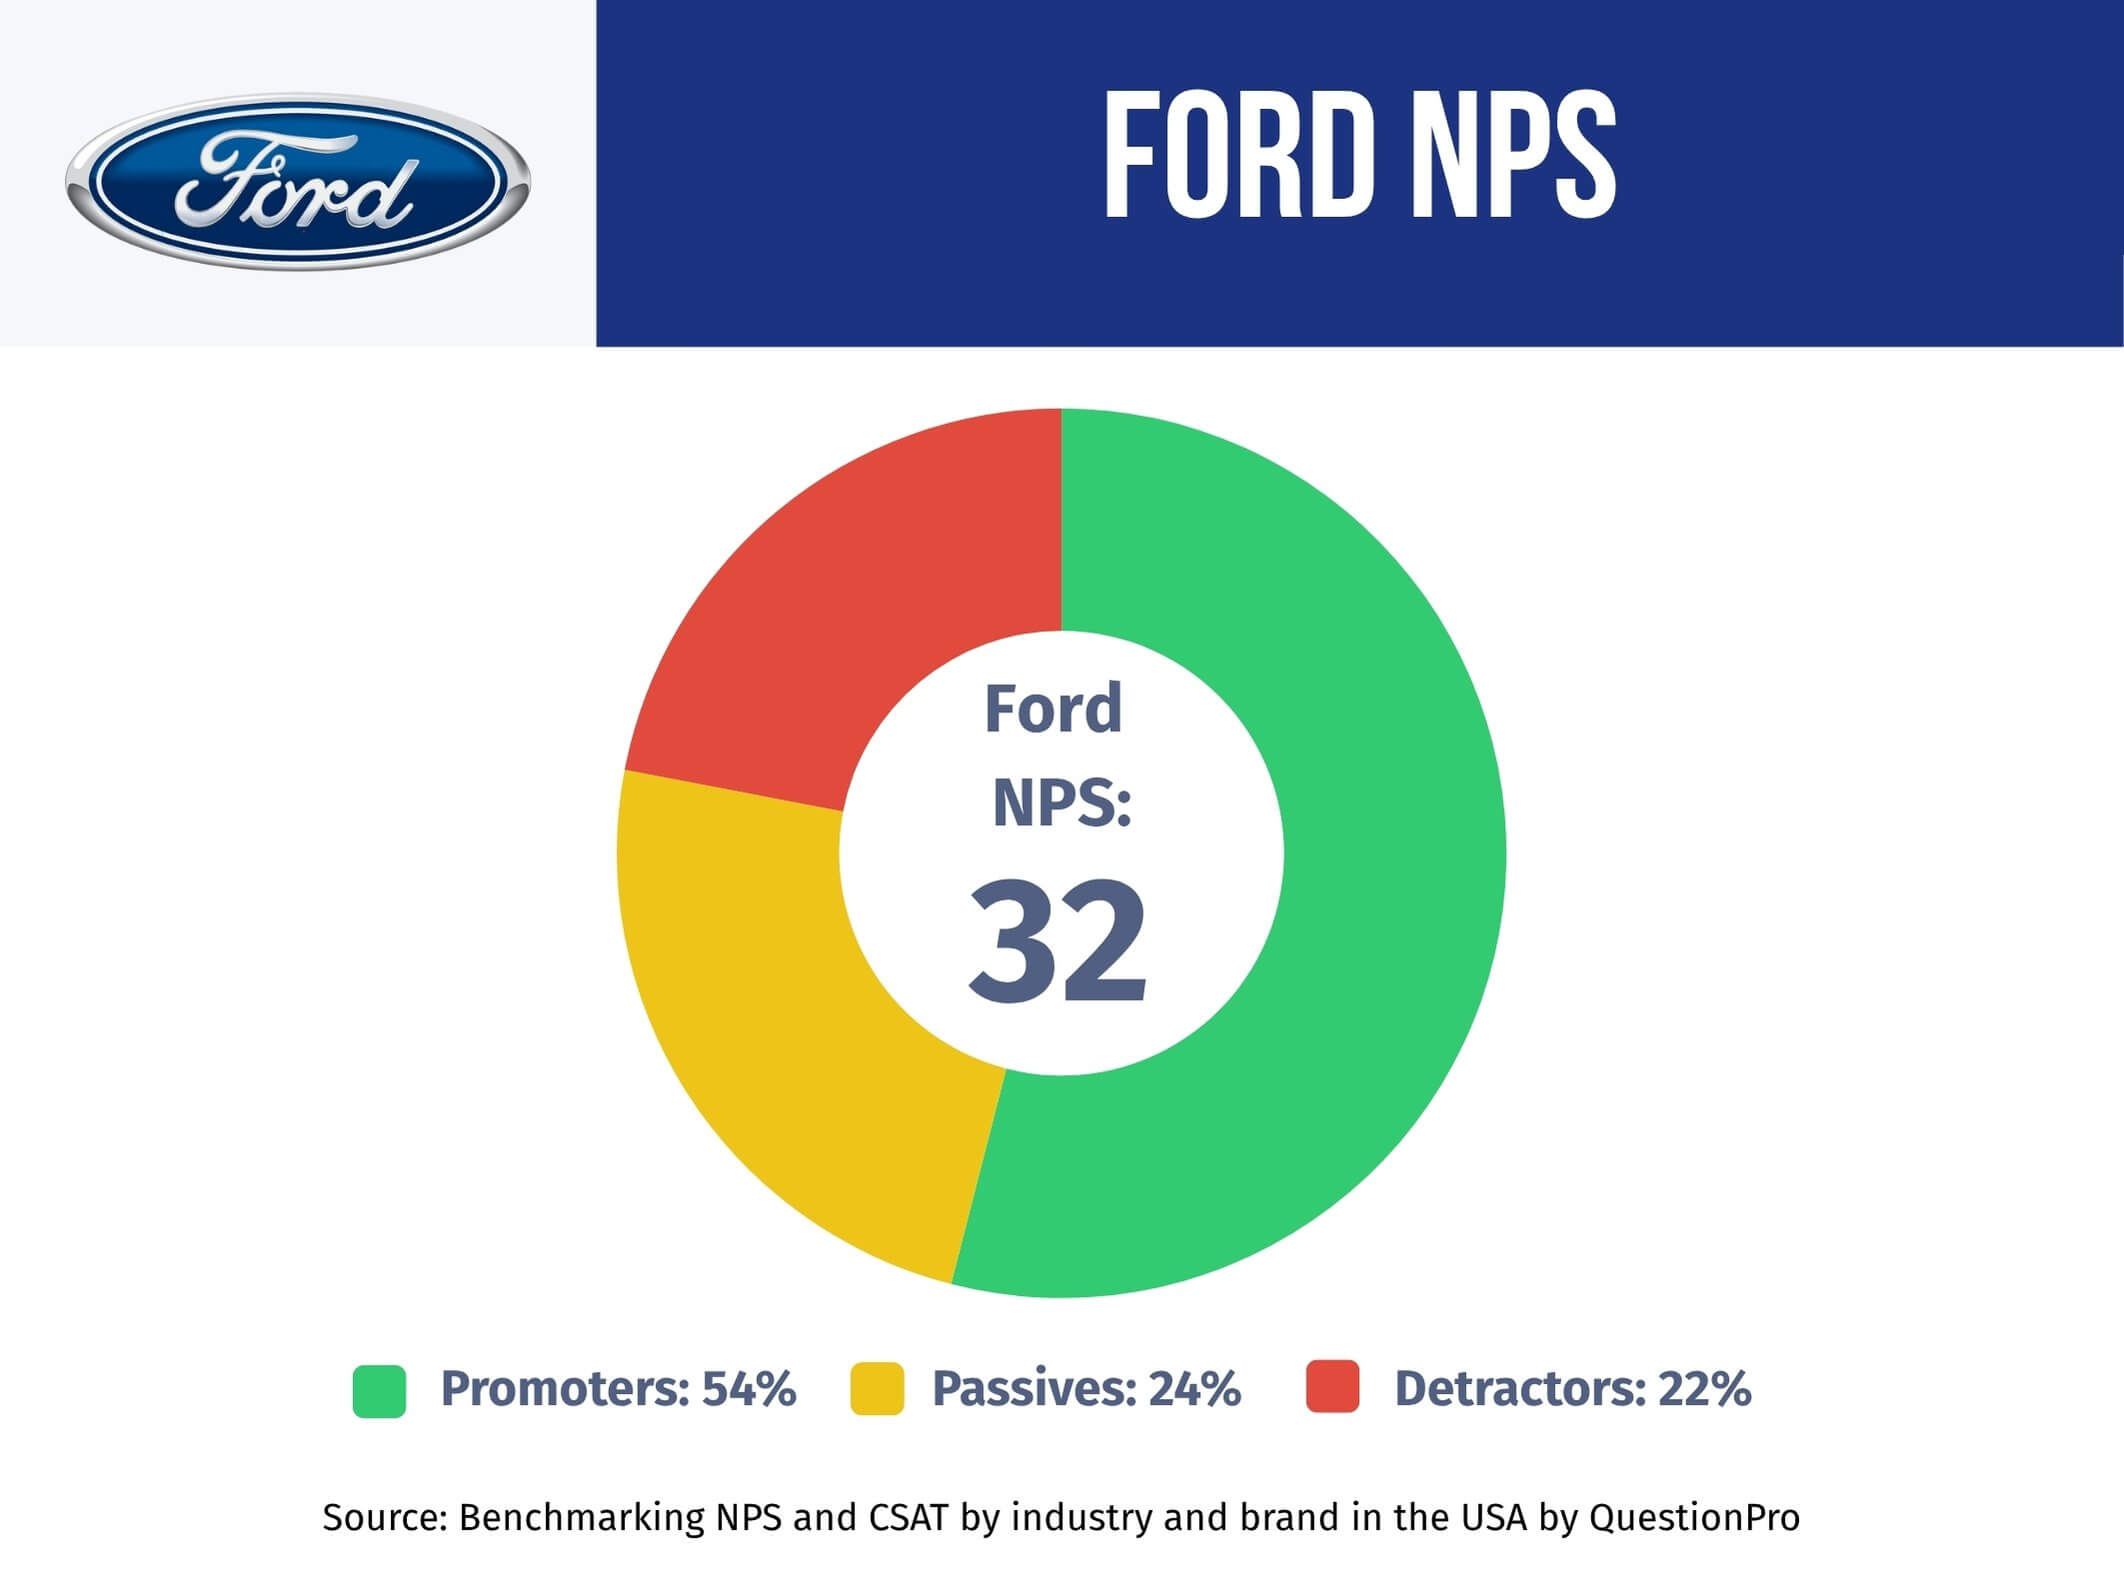
- Promoters: 54%
- Passives: 24%
- Detractors: 22%
While over half of Ford’s customers actively recommend the brand, a notable chunk remain neutral or dissatisfied. The result? A respectable score, but also a clear opportunity to strengthen customer loyalty.
How Ford Compares to Automotive Industry Standards
According to the latest benchmarking data, the average NPS for automotive brands in 2025 will be 41. Ford NPS score of 32 falls just below that line.
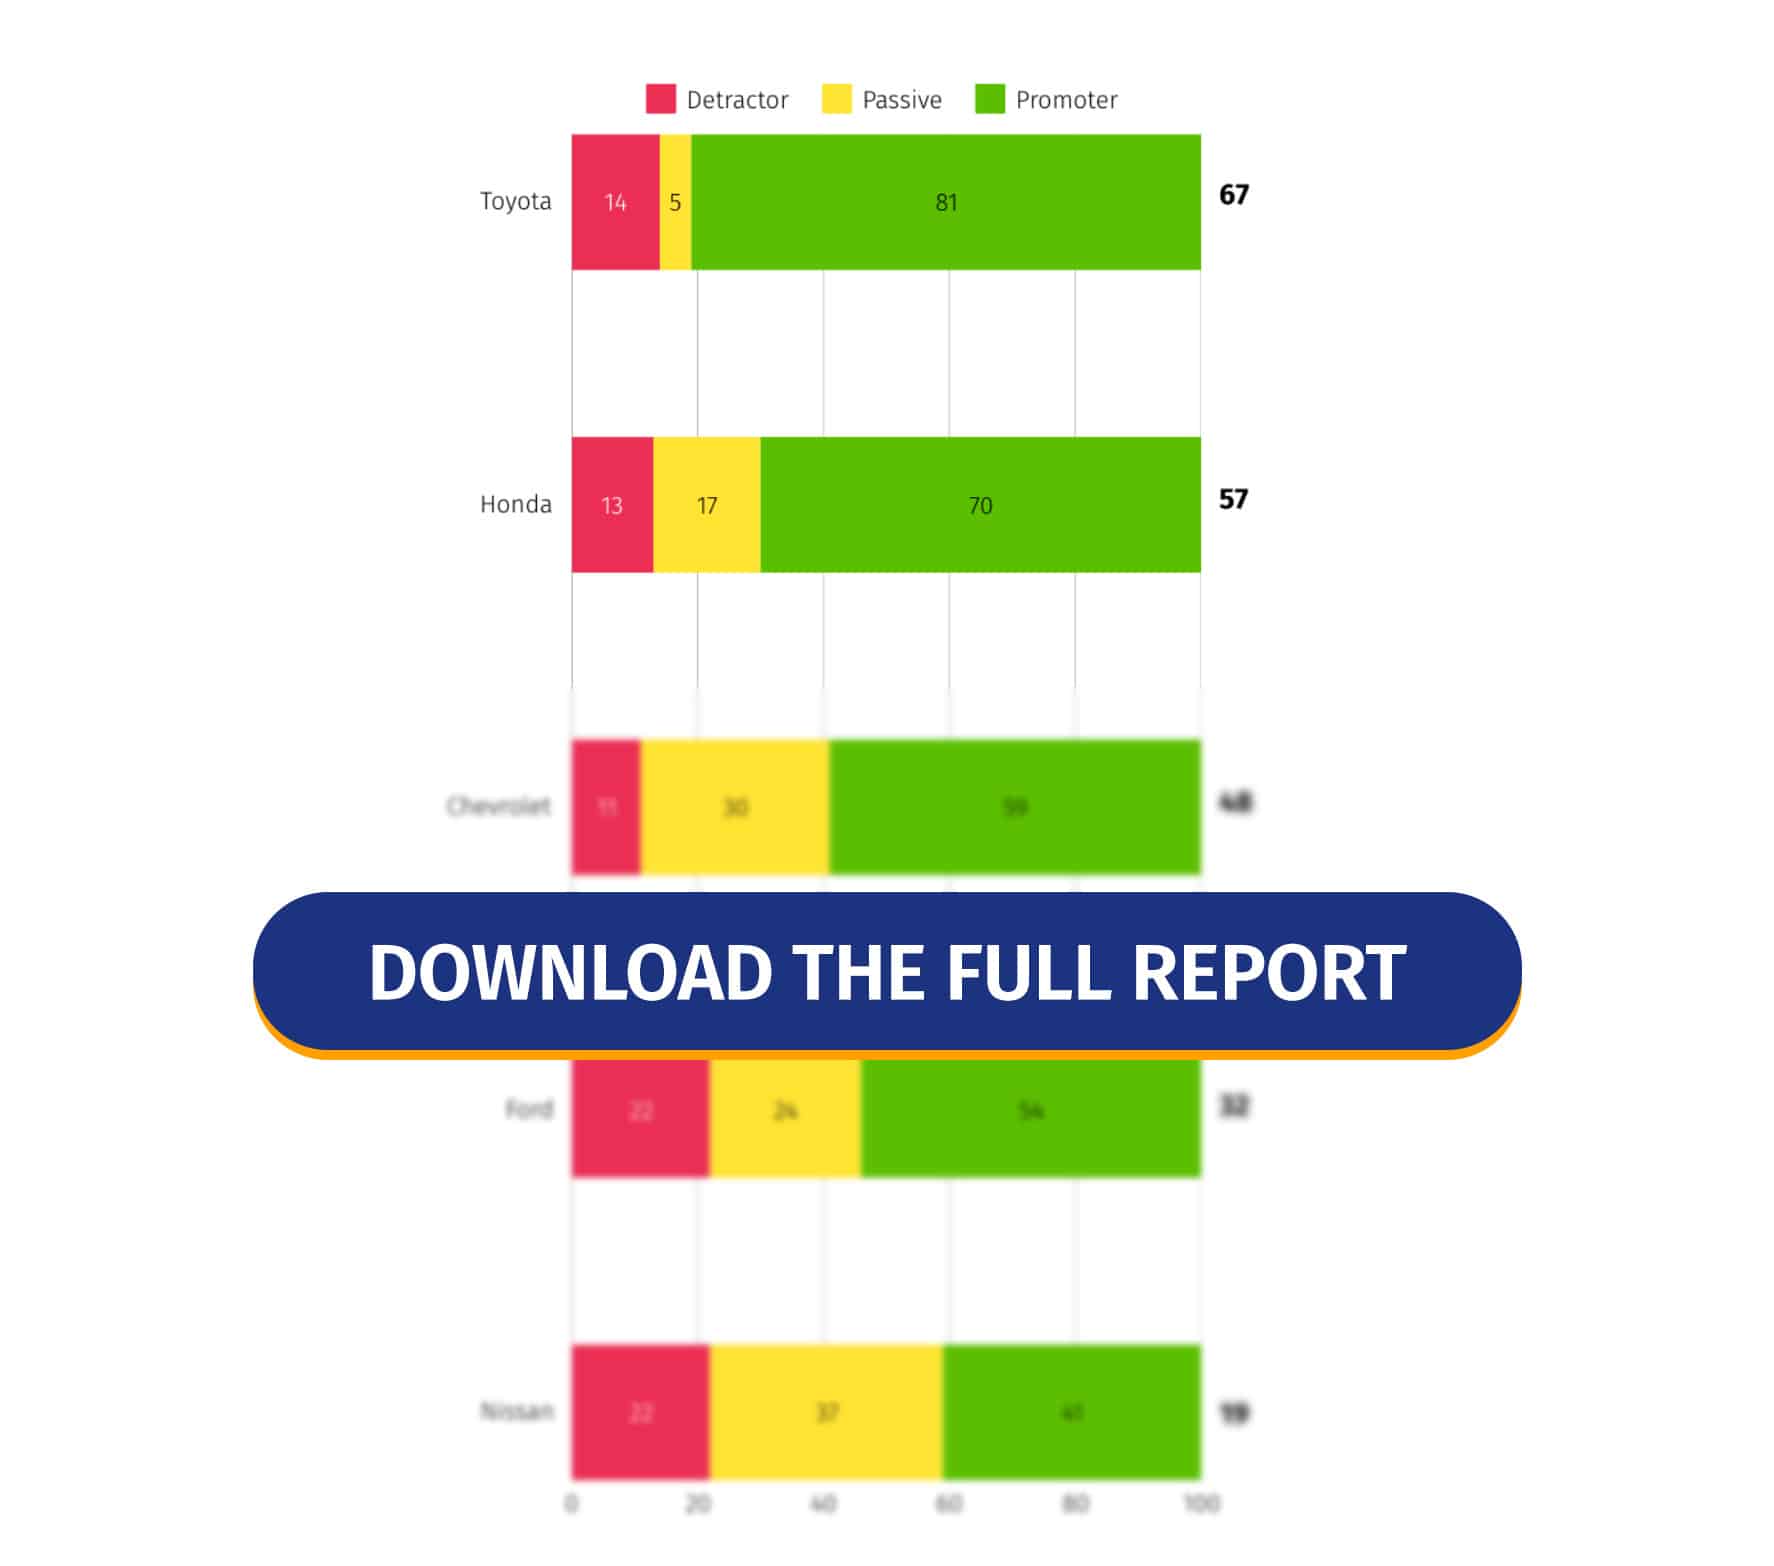
By comparison:
- Toyota leads with an NPS of 67
- Honda follows with a solid 57
- Ford trails at 32
These insights, drawn from 1,000 customer responses in QuestionPro’s quarterly Q1 study, show that Ford has a good base of loyal customers but also a higher-than-average number of Detractors, which lowers its score.
Ford’s NPS places it behind the top-tier performers in the automotive sector. Where Toyota and Honda convert reliability and service into vocal advocates, Ford still faces challenges:
- Promoters are present but not overwhelming in number.
- The detractor percentage is notable and higher than that of its closest competitors.
- Passives represent a significant portion of the market, indicating content but not emotionally connected customers.
People remember how their car performs after 50,000 miles, how the dealership treats them after the sale, and how easy it is to get support when something goes wrong. These emotional and practical experiences shape loyalty, and Ford’s 2025 Net Promoter Score tells an important story about that trust.
This middle-of-the-road performance could signal opportunities to elevate service, communication, or product features to deepen loyalty.
What’s Driving Ford’s Loyalty Score?
Ford’s legacy is rooted in American innovation and rugged performance. Yet modern loyalty relies on more than a trusted badge.
Here are a few key factors influencing Ford’s current position:
Strengths
- Broad vehicle lineup: Trucks, SUVs, hybrids, and EVs (like the Mustang Mach-E) keep Ford competitive.
- Strong brand recognition: Ford remains a default choice for many American families and businesses.
- Improved tech offerings: Recent strides in infotainment and connectivity are drawing attention.
Challenges
- Inconsistent service experiences across dealerships.
- Competitive pressure from brands that lean more heavily into hybrid, EV, and safety innovation.
- Perceived value gaps, especially in entry-level models, are compared to competitors.
Customer Satisfaction Score (CSAT) and Future Buying Intent
Customer Satisfaction Score provides another perspective on customer satisfaction. It’s typically measured as a percentage of satisfied customers with a product or service.
- Automotive Industry CSAT Average: 77%
- Ford CSAT: 74%
It’s not a huge gap, but enough to suggest that Ford could fine-tune a few touchpoints to compete with the space’s leaders.
When it comes to future purchase intent, the outlook is promising:
- 70% of current customers say they’d buy a Ford again
- 16% said “Maybe”
- 14% said “No”
This indicates that most customers still see long-term value in staying with the brand.
Want to Measure and Improve Your NPS Like Ford?
Tracking customer loyalty shouldn’t feel like a guessing game. With QuestionPro, it’s simple to get started and easy to act on insights.
Here’s what the process looks like:
1. Set Up Your NPS Survey
Start with QuestionPro’s pre-built NPS survey template, or customize your own. The main question is straightforward, and you can add a follow-up open-ended “why?” to learn what’s behind the score.
For deeper insights, try our AskWhy feature. It adds an open-ended follow-up
question to gather context on scores.
2. Distribute It Anywhere
Send surveys via email, SMS, website embeds, or even QR codes. Use QuestionPro Audience to reach specific customer segments by behavior or location.
3. Track in Real Time
No waiting or spreadsheets, your dashboard updates automatically, showing Promoters, Passives, and Detractors as responses come in.
4. Dig Into Feedback
Tag themes in open-ended responses, spot common complaints, and prioritize action items based on what matters most to customers.
5. Compare Across Segments
Want to know how one region or product line compares to another? Segment and benchmark performance to zero in on opportunities.
Stay Ahead with the Latest Benchmarking Data
Ford’s 2025 performance shows how customer loyalty is evolving in the auto world, but every brand has a different journey. Want to see where you stand?
Download the Q1 2025 NPS Benchmarking Report for insights across automotive, retail, and travel.
Or, talk to a QuestionPro expert to see how NPS can help your brand improve customer satisfaction and drive growth.