
That first drive off the dealership lot? The new car smell, the flawless paint, the promise of adventures ahead. You’re not just buying wheels. You’re buying freedom, identity, and a thousand tomorrows.
But what happens when reality hits? When will the first repair bill land? When does the service advisor forget your name? That’s when true loyalty is tested.
In today’s automotive world, where electric dreams meet old-school grit, brands aren’t just selling horsepower. They’re selling trust. Nothing captures that trust better than the Net Promoter Score (NPS), a simple question that cuts to the heart of every driver’s experience: “Would you risk your reputation to recommend us?”
Our Q1 2025 study, which surveyed 1,000 U.S. customers involved in vehicle purchasing decisions, reveals how automotive brands stack up in terms of earning advocacy and trust.
What is NPS and How to Calculate?
The Net Promoter Score (NPS) is a widely used and powerful tool that measures customer loyalty. Think of it as a direct line to understanding customer satisfaction and predicting future growth because happy customers become your best advocates.
NPS measures customer loyalty through one simple question:
“On a scale of 0–10, how likely are you to recommend [COMPANY] to a friend or colleague?”
Responses categorize customers into three groups:
- Promoters (9–10): Enthusiastic advocates who fuel referrals.
- Passives (7–8): Satisfied but unenthusiastic; vulnerable to competitors.
- Detractors (0–6): Unhappy customers who may damage your reputation.
NPS Formula:
NPS Score = % of Promoters – % of Detractors
Your final NPS ranges from -100 (worst) to +100 (best). A positive score is good; a score of +50 or higher is excellent, meaning your customers aren’t just satisfied; they’re loyal fans.
The QuestionPro NPS Calculator makes it easy to calculate your Net Promoter Score in just a few clicks. Whether you’re entering the number of promoters, passives, and detractors manually or using its built-in goal-setting feature, the tool instantly shows your NPS score, giving you a clear picture of customer loyalty.
From email surveys to in-store kiosks, QuestionPro helps you collect, calculate, and improve your NPS—all from one easy-to-use platform.
What’s a Good NPS Score for The Automotive Industry
From our QuestionPro’s Q1 2025 Benchmarking NPS and CSAT Report, the automotive industry is 2nd with an NPS of 41, the highest of all seven sectors.
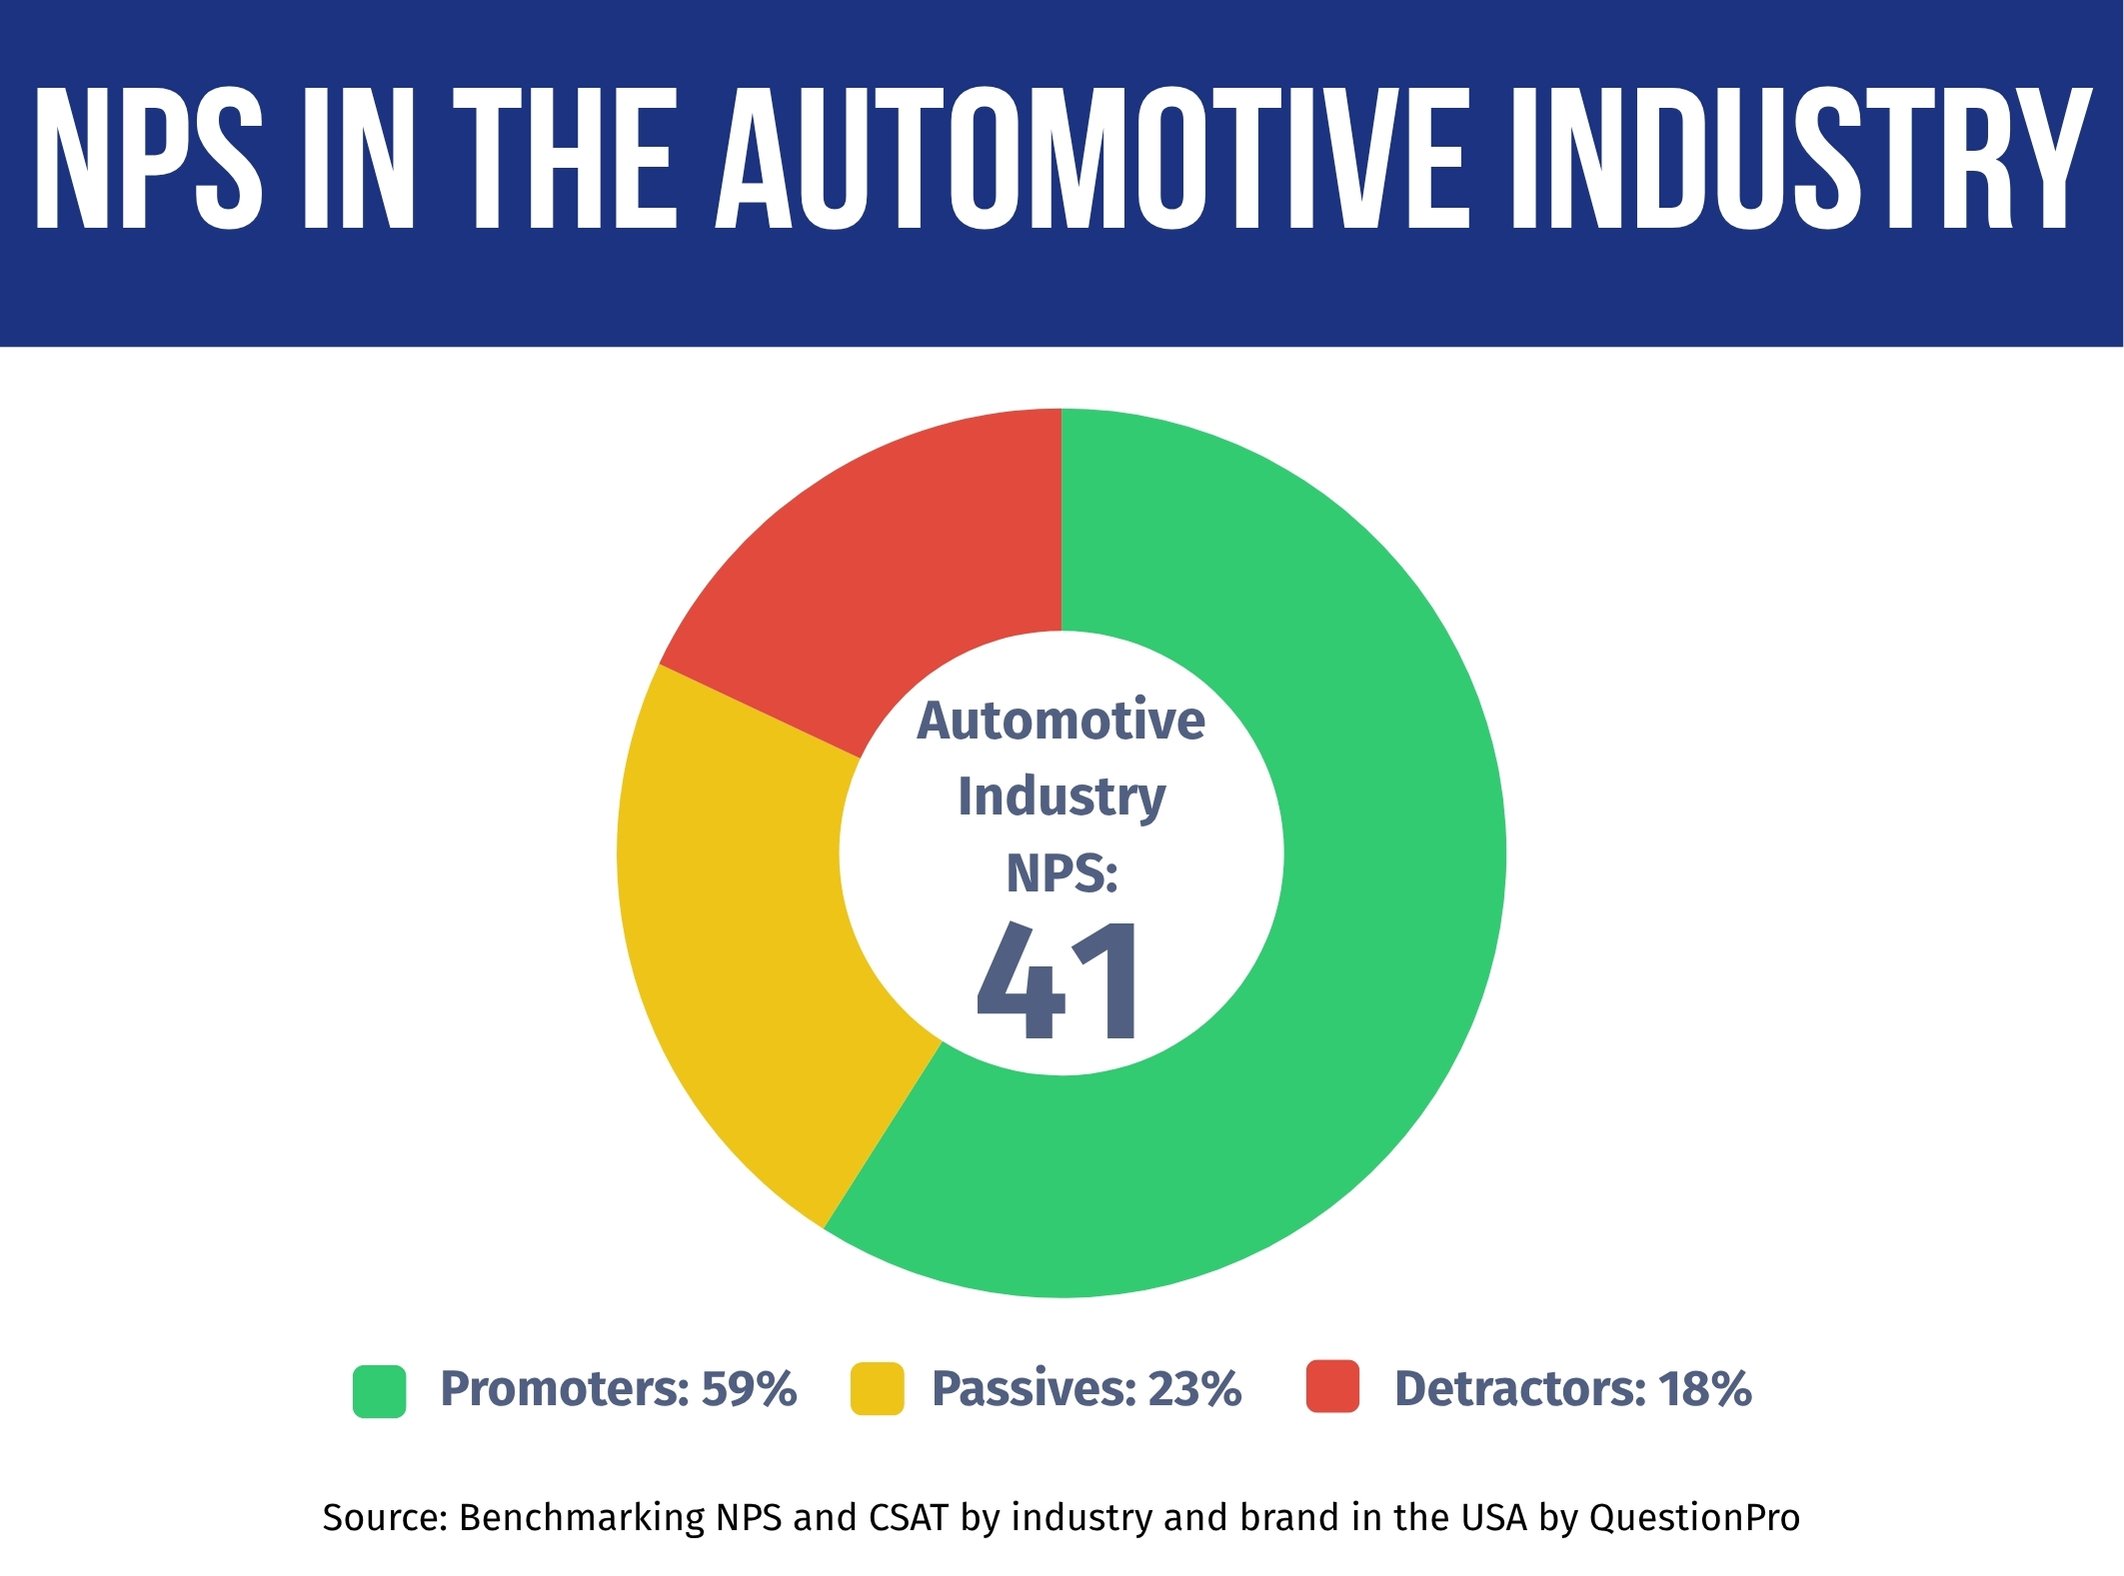
- Promoters: 59%
- Passives: 23%
- Detractors: 18%
Industry Performance Context: Where the Automotive Industry Stands
Our report shows customer loyalty across key industries and how NPS in the Automotive Industry is leading the way:
- Hotel & Hospitality: 44 NPS
- Automotive: 41 NPS
- Banking & Credit Unions: 41 NPS
- Big Box Retail: 37 NPS
- Grocery Retail: 37 NPS
- Airlines: 33 NPS
- Insurance: 23 NPS
A score of 41 indicates that automobile industry providers are excelling at creating experiences that inspire genuine customer loyalty and advocacy.
Interpreting Your Automotive Brand NPS Score
What does your specific NPS in the Automobile Industry mean? Use this general guide:
- Above 50: Exceptional Performance. World-class customer loyalty, creating passionate advocates.
- 30-50: Strong Performance. Solid customer advocacy and loyalty is the industry benchmark zone.
- 0-30: Needs Improvement. Room to significantly enhance the customer experience.
- Below 0: Urgent Attention Required. Signals serious customer dissatisfaction impacting reputation.
With the industry average setting the bar high at 41, most automobile brand players show strong performance. Yet, reaching that coveted “Exceptional” level above 50 remains the ultimate goal for customer-centric leaders.
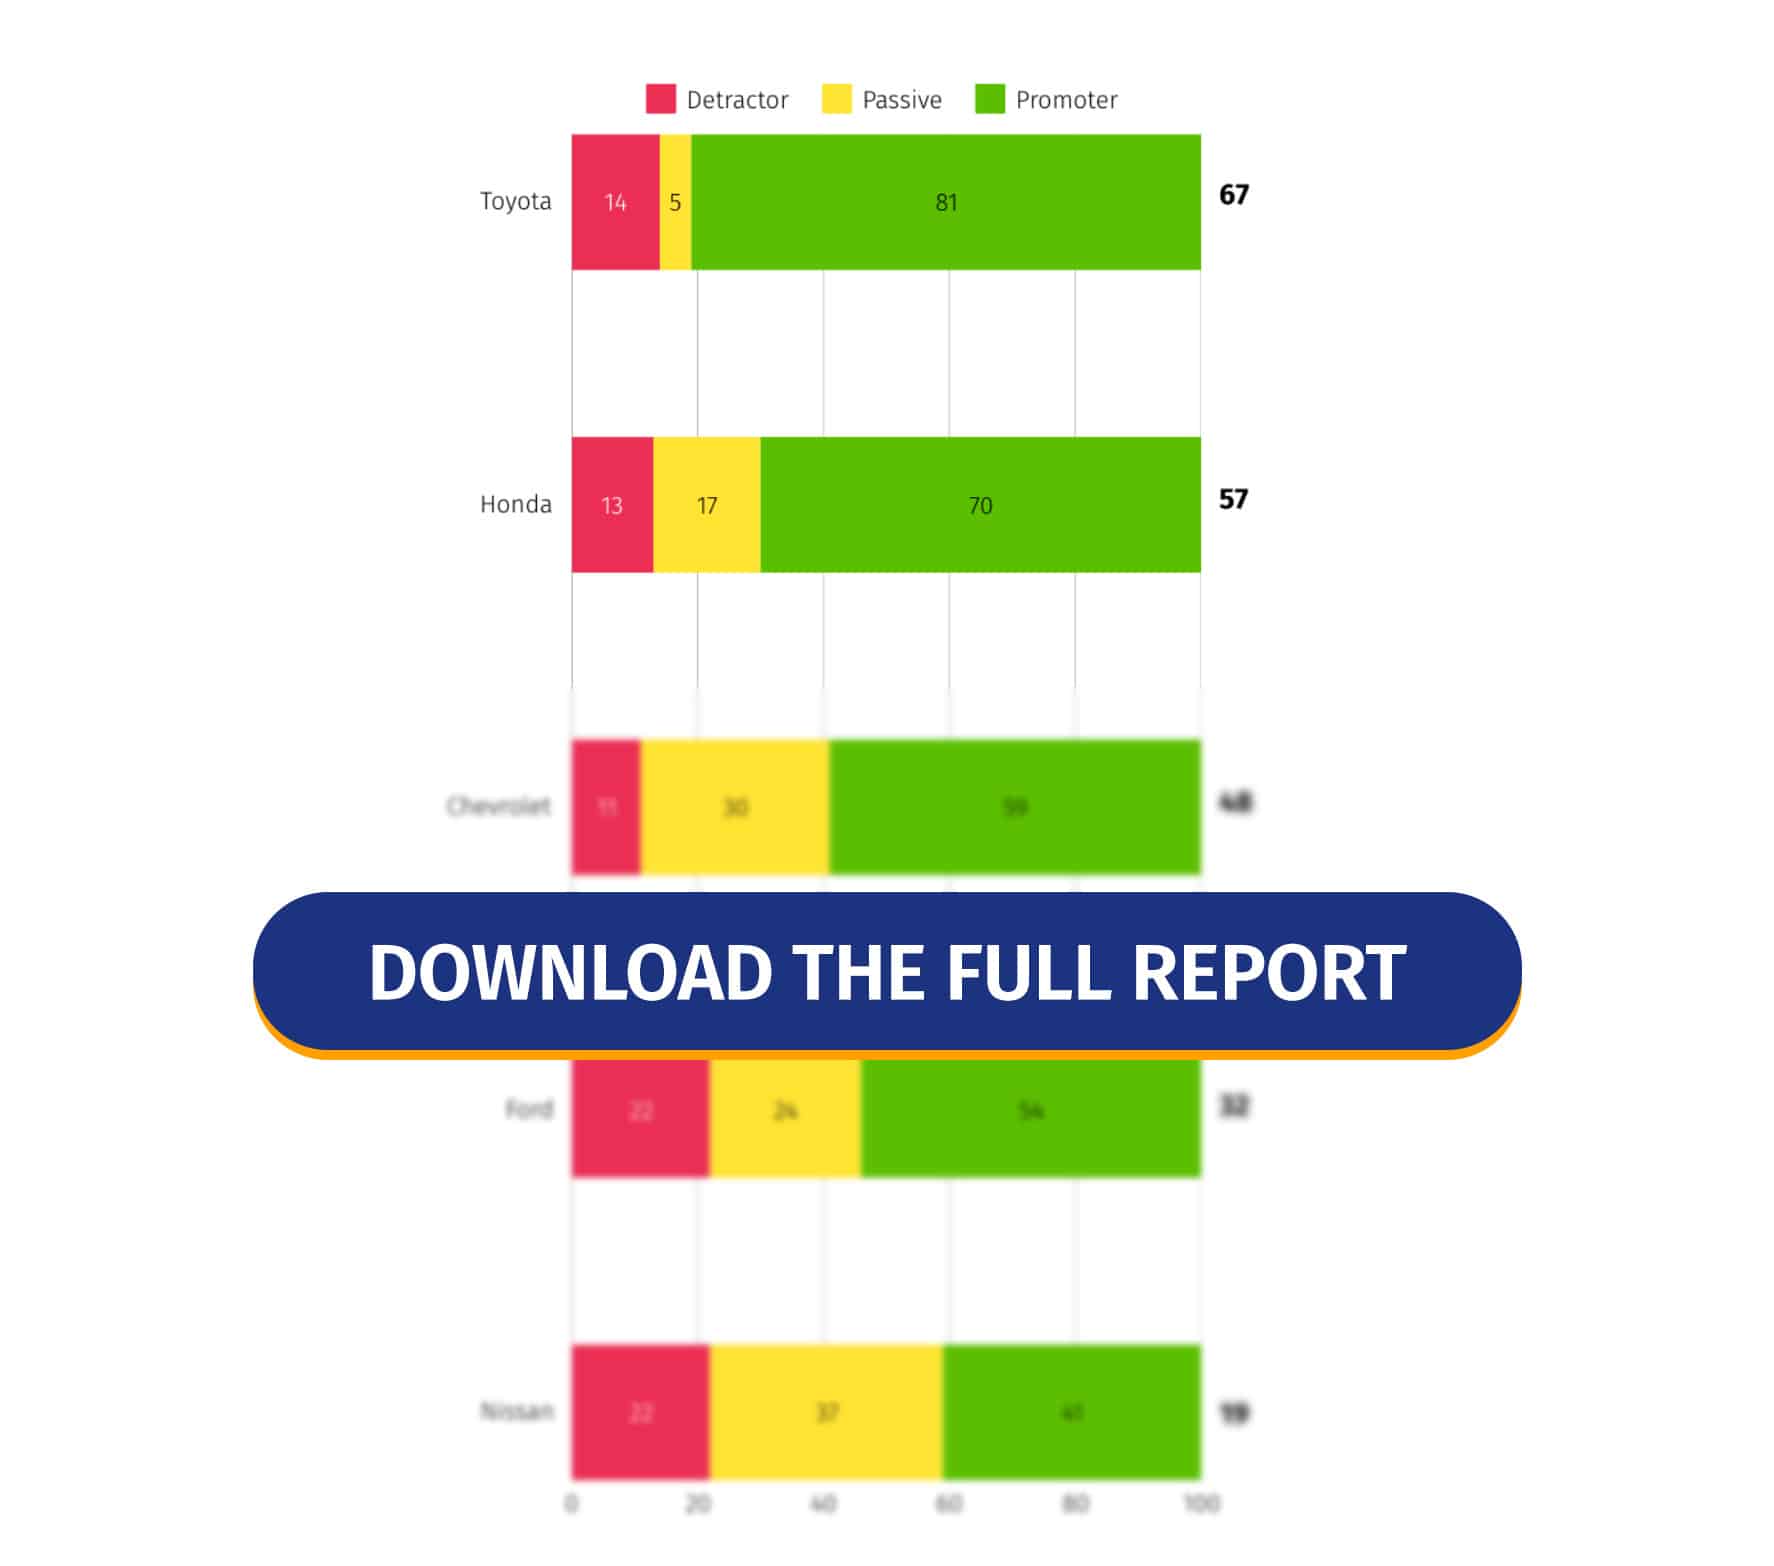
NPS Benchmarks in the Automotive Industry: Leaders vs. Challengers
Our Q1 2025 study reveals unique differences in customer loyalty across major automobile brands, demonstrating how customer experience strategies directly impact advocacy metrics.
| Brand | NPS |
| Toyota | 67 |
| Honda | 57 |
| Chevrolet | 48 |
| Ford | 32 |
| Nissan | 19 |
Key Performance Insights
The 48-point gap between the highest-performing brand (Toyota, with a 67 NPS) and the lowest-performing brand (Nissan, with a 19 NPS) shows the direct impact of customer experience strategies on customer loyalty outcomes.
- Toyota’s Dominance: With 81% Promoters, Toyota blends reliability, innovation, and emotional appeal. Its low detractor rate (14%) signals consistent satisfaction.
- Honda’s Loyalty Engine: 70% of Promoters highlight trust in durability and resale value.
- Nissan’s Struggle: Only 41% of Promoters and high Detractors (22%) point to CX gaps likely in service or post-purchase support.
These insights come from QuestionPro’s latest study, which surveyed 1,000 participants to measure NPS across leading companies and industries. The report is based on real customer feedback from Q1 2025 and is updated quarterly.
We invite you to download the full report. It’s a valuable resource for evaluating your company’s performance and determining your customers’ perceptions of you.
Discover What Major Brands are Doing to Achieve an Excellent NPS
Click here to access a detailed analysis of how the major Automotive industries included in our study maintain customer satisfaction and how this has impacted their Net Promoter Score.
Toyota NPS
With an impressive NPS of 67, Toyota leads the way in customer satisfaction. Known for its reliability, innovation, and long-lasting value, Toyota has built a loyal following by consistently delivering vehicles that drivers trust.
Honda NPS
Scoring a strong NPS of 57, Honda earns customer loyalty through quality, performance, and efficiency. Its reputation for dependable engineering and driver-focused design keeps Honda top of mind for millions.
Chevrolet NPS
With a solid NPS of 48, Chevrolet shows strong customer commitment. From trucks to SUVs, Chevy’s wide-ranging lineup and dependable service keep drivers engaged and loyal to the brand.
Ford NPS
Earning an NPS of 32, Ford reflects steady customer trust. Backed by a legacy of innovation and iconic models, Ford continues to strengthen its relationship with drivers across generations.
Nissan NPS
At an NPS of 19, Nissan shows room for improvement in customer loyalty. While appreciated for stylish designs and accessible pricing, Nissan is working to deepen trust and satisfaction among its drivers.
What We Can Understand from the Automotive Industry Leaders and Challenges
The differences in automobile NPS performance reflect deliberate customer experience (CX) strategies. Below, we analyze what sets top performers apart:
- Reliability Builds Loyalty
Toyota’s top NPS comes from decades of quality. Owners become advocates because their cars “just work” year after year. That trust translates to referrals; 81% of customers are actively promoting the brand.
- Dealership Experience Drives Advocacy
Honda excels at human-centric service. From hassle-free maintenance to transparent sales processes, they turn transactional interactions into emotional connections. The result is that 70% of customers become Promoters.
- Value Perception Retains
Chevrolet balances price with quality. Owners feel they get “more for their money,” so 59% of customers are Promoters, even though they are priced lower than luxury competitors.
Challenges and Opportunities
- Nissan’s Struggle (19 NPS): High Detractors (22%) indicate frustration with reliability or service costs. Quick wins could include extended warranties or proactive service outreach.
- Ford’s Intent Gap (74% CSAT): Even satisfied customers hesitate to repurchase. Enhancing post-sale perks (like free maintenance) could bridge this.
- Electric Vehicle (EV) Transition: As EVs gain traction, brands must educate customers and simplify charging logistics to avoid loyalty erosion.
Measuring and Improving Your NPS in the Automotive Industry
As the industry maxim goes, “What isn’t measured can’t be improved.” Let’s explore actionable steps to track your NPS and continuously enhance customer loyalty.
- Establish Baseline Metrics
Begin with QuestionPro NPS survey templates to understand your position relative to automobile benchmarks. Maintain consistent timing and methods for reliable comparisons.
- Segment Your Analysis
Break down results by customer type, booking channel, or customer service. Different segments have unique expectations; the drivers of a luxury car differ from those of a budget chain.
- Monitor Quarterly
Implement ongoing tracking to identify trends and measure the impact of CX initiatives. Automobile brand demand fluctuates seasonally – regular measurement accounts for these variables.
While this may seem complex, purpose-built tools like QuestionPro Customer Experience simplify the process by enabling:
- Closed-Loop Feedback Systems: Automate follow-ups with Promoters (to harness advocacy) and Detractors (to resolve issues). Example: Immediate recovery offers for customers with a rating of ≤ 6.
- Predictive Analysis: Use NPS trends to forecast behavior, such as identifying at-risk loyal customers before they switch brands.
- Cross-Channel Consistency: Ensure seamless experiences across touchpoints, from online bookings to concierge interactions. Visualize journey maps to identify friction points.
With QuestionPro Customer Experience, you can measure your Net Promoter Score in minutes, as well as implement initiatives and systems to maintain constant monitoring that allows you to keep your customers satisfied and stay on par with major leaders in your industry.
Conclusion
The automotive industry’s strong NPS (41) reflects progress, but leaders like Toyota prove that consistent quality and human-centered service are non-negotiable. However, the gap between top and bottom performers reveals significant opportunities for improvement that still exist.
As electric and autonomous vehicles reshape the landscape, brands that prioritize transparent communication, proactive support, and unwavering reliability will emerge as leaders in the loyalty race.