
Sometimes the simplest data can be the most confusing insights. Convenience bias is one of the main reasons this happens in survey research.
It occurs when you collect answers from people who are easy to reach, not from a group that truly reflects your target audience. This hurts data quality and makes your results less reliable.
Understanding this bias is important for any researcher who wants accurate and reliable findings. In this article, you will learn what convenience bias is, how it affects surveys, and what steps you can take to reduce it.
What is convenience bias?
Convenience bias is a sampling bias that occurs when survey results are based on easy-to-reach respondents. This makes the data less accurate and reduces your ability to understand the full group you want to study.
You usually see convenience bias when:
- You survey only people who are nearby or online now.
- You use volunteers instead of a planned sample.
- You ask only people from one location, team, or group.
Convenience bias is closely related to convenience sampling. It is the method of choosing participants who are easy to access and is also referred to as ‘grab sampling’. When researchers use this method, the risk of convenience bias increases. It happens because the sample is unbalanced or not truly representative. It is often used in qualitative and medical research studies.
When convenience bias appears in data collection
Convenience bias can appear in data collection when the survey process makes it easier for some people to participate than others. This creates a sample that does not match the target population. Convenience bias often arises when researchers face time, access, or recruitment constraints.
Common reasons convenience bias appears include:
- Selection error occurs when researchers rely on the easiest-to-reach subjects rather than following a clear sampling plan.
- Limited access to the target population because some groups are harder to contact, less active online, or less willing to respond.
- Gaps in the sampling frame where parts of the target population are missing from contact lists, panels, or recruitment channels.
- Survey design choices that favor certain groups, such as using only online surveys, a single language, or a single channel.
When these issues appear together, the final sample becomes unbalanced and less representative of the whole group the study wants to describe.
Learn about: What is a sampling frame, examples & how to use it
How convenience bias affects surveys and research
Convenience bias can change how survey results appear and lead to survey and research bias. When your sample is made up of easy-to-reach people, the data no longer reflects the real behavior of your target population. This reduces research accuracy and external validity.
Convenience bias affects surveys in several clear ways:
1. Unbalanced survey results
Some groups appear too often in the data, while others are almost missing. This creates a one-sided picture.
Suppose you run a customer survey in a shopping mall. Most respondents are teenagers because they are the ones passing by. Older customers are almost missing, so you get a skewed view of buying behavior. So you have to add,
- Older shoppers
- Families with young children
- People who visit during non-peak hours
2. Lower research accuracy
The patterns in your charts may look strong, but they do not reflect the full population. This makes your insights weaker. If an app company surveys only its most active users, those users will give high ratings and detailed feedback.
However, silent users who struggle with the app are not included. So the team thinks the app performs better than it actually does.
3. Harder to generalize
What you learn from the survey may not apply to other customers, markets, or user groups. This reduces external validity.
For example, A restaurant surveys only lunchtime visitors. These customers prefer quick meals. The results do not represent evening customers who prefer slower dining and different menu items.
Discover more: Restaurant survey questions + sample questionnaire template
4. Weaker population validity
An unbalanced sample breaks population validity. The people in your survey are too different from the wider group you want to understand.
Example: A city wants feedback on public transport. The survey team collects responses only from people waiting at bus stops. This leaves out other commuters and creates an unbalanced view.
You miss essential groups such as:
- Train users
- Bike riders
- People who walk to work
Because these groups are not included, the results do not represent the full population.
Reports may leave out how the sample was collected. This hides critical survey limits and can mislead stakeholders.
Suppose your company presents a customer satisfaction score (CSAT) without explaining that the survey link was shared only on social media.
Older customers who do not use social media never responded, which makes the reported score incomplete.
Bias can also be introduced when researchers unconsciously favor participants who appear friendlier or more eager to engage. Furthermore, participants in convenience samples may be more motivated than the general population. This can distort feedback and further impact the validity of the findings.
When convenience bias is strong, surveys still produce numbers and charts. But these signals do not represent the full group you want to understand.
How to identify convenience bias in research data
You can identify convenience bias by checking if the survey data matches the group you wanted to study. Clear signs often appear when the sample is unbalanced or does not represent the target population. It is important to review your research methods, including the sampling technique and data collection approach. It helps to identify potential sources of convenience bias.
Common signs of convenience bias include:
- Significant differences between your sample and the actual population, such as age, location, or income imbalances.
- Too many responses are coming from the same group, such as students, employees from a single team, or users from a single region.
- The people who answered your survey do not reflect the group you designed the research for.
- Contact lists or panels may lack essential segments, resulting in a narrow, unbalanced sample.
- Most respondents join because they are available, active online, or interested in the topic. This often leads to selection error.
When you observe these signs, the data may not fully represent your target group, and your insights may become less accurate.
Learn about: Understanding sampling bias & how to avoid It + examples
5 Ways to reduce convenience bias in surveys
You can reduce convenience bias by taking simple steps that help create a more balanced and representative sample. These steps improve data quality and make your findings more reliable.
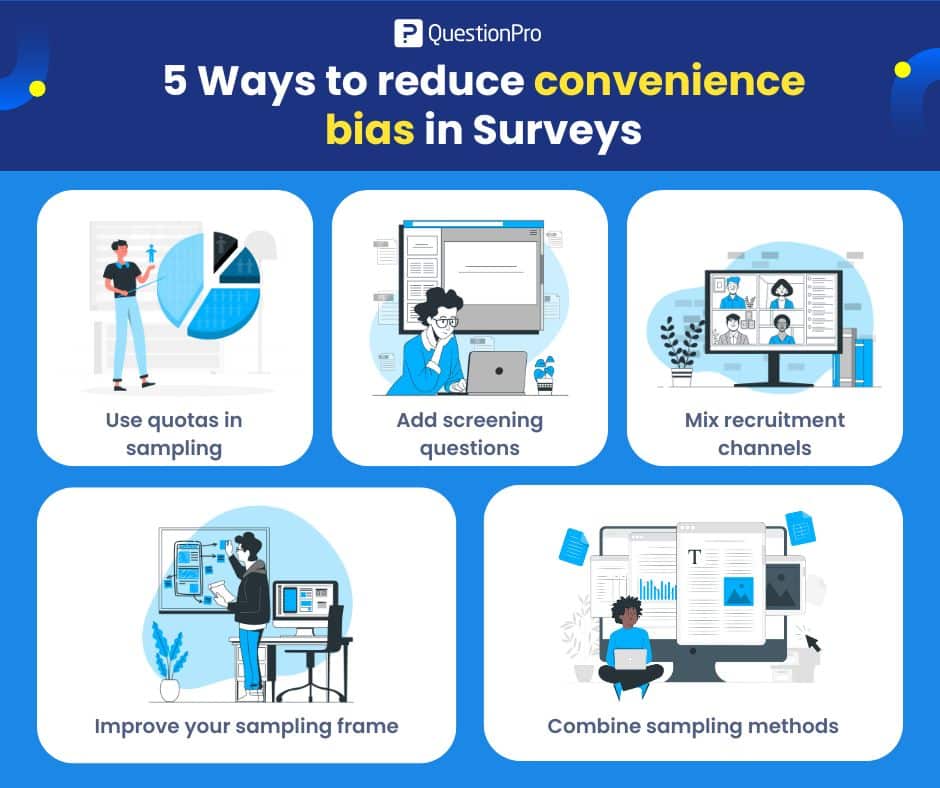
1. Use quotas in sampling
Set targets for key groups such as age, gender, or location so your sample reflects the target population.
For example, you want to survey 400 customers. You set quotas like:
- 100 respondents aged 18–29
- 150 respondents aged 30–49
- 150 respondents aged 50+
The survey closes each group only when its quota is reached, so no single age group dominates the results.
2. Add screening questions
Use simple questions at the start of the survey to filter out people who do not match your study criteria. This helps you reach the right respondents.
Suppose you are running a retail shop and want to run a survey. You need to add some screening questions.
Q1. Have you bought from our online store in the last 6 months?
- Yes
- No
Q2. Which of these product categories have you purchased from us?
- Electronics
- Clothing
- Home and kitchen
Only people who answer “Yes” to Q1 and select at least one category in Q2 continue to the main survey. Others exit with a thank you message.
3. Mix recruitment channels
Use email, social media, panels, and offline sources together. This reduces the risk of reaching only one type of respondent and helps you reach different segments of your target population.
4. Improve your sampling frame
Keep your contact lists clean and up to date. Make sure they include all key segments such as different regions, customer types, or usage levels, so no important group is missed.
5. Combine sampling methods
Use convenience sampling only as part of your approach, and balance it with more structured methods, such as quota or stratified sampling.
For example, you start with a convenience sample from your email database, then add respondents from a panel to fill missing age or region quotas. This mix reduces the bias from your original convenience sample. Convenience sampling work at this stage can provide quick, cost-effective insights that help inform the planning and funding of a full-scale research project.
These steps help you create a stronger sample and reduce the risk of convenience bias in your research.
Learn more about: Types of survey bias and how to avoid them in surveys
Convenience bias vs sampling bias
Convenience bias and sampling bias are closely related but not the same. Sampling bias is the overall problem of an unrepresentative sample, while convenience bias is a specific cause that comes from surveying people who are easiest to reach.
Aspect | Convenience Bias | Sampling Bias |
| Definition | A bias that occurs when data is collected from people who are easiest to reach | A broad bias occurs when a sample does not represent the target population |
| Scope | A specific type of bias | An umbrella term that includes many types of bias |
| Main cause | Relying on convenience sampling | Poor sampling design, missing groups, or uneven response rates |
| When it happens | When surveys rely on nearby participants, volunteers, or active users | When any group in the population is overrepresented or underrepresented |
| Relationship | A cause of sampling bias | The overall outcome or problem |
| Example | Surveying only social media followers | Survey results that fail to reflect the full target population |
| How to reduce it | Use quotas, screening questions, and mixed recruitment channels | Improve sampling methods and ensure population coverage |
How QuestionPro helps reduce convenience bias in surveys
QuestionPro includes many tools that help researchers reach the right audience and avoid an unbalanced sample. These features make it easier to manage recruitment, control quotas, and improve the overall accuracy of survey data.
- Screening tools
Screening questions and custom variables help filter out respondents who do not fit your target population. You can also use QuestionPro AI to create your screening questions.
- Quota management
You can set quotas for age, gender, location, or any segment. This prevents overrepresentation of one group and supports a balanced sample.
- Wide distribution options
Surveys can be shared through email, SMS, social media, QR codes, and the QuestionPro mobile app. More channels mean a more diverse respondent pool.
- Access to qualified respondents
QuestionPro Audience lets you reach specific groups rather than relying on whoever is easiest to find. This gives you stronger control over who joins the study.
- Advanced logic and randomization
Tools like skip logic, block flow, question randomization, and advanced branching help reduce selection error during the survey experience.
- Multilingual and accessibility support
Multilingual surveys, auto translation, and accessibility features reach more people. They reduce the chance that only one type of respondent participates.
- Data quality checks
Features such as dropout analysis, weighting and balancing, sentiment analysis, and response validation help you review and adjust the sample if it becomes unbalanced.
- Real-time dashboards
Live reporting shows who is responding. You can monitor demographics, quotas, and participation patterns and make changes before the survey closes.
These tools work together to reduce the risk of convenience bias and help researchers collect data that better reflects the full population they aim to study.
Conclusion
Convenience bias is a common challenge in survey research, and it can lead to data that does not fully represent the people you want to understand. By learning how to spot it and taking steps to reduce it, you can improve the quality of your insights and make your research more reliable.
Researchers can protect the quality of their data and create more reliable studies by reducing the convenience bias. Simple steps such as better sampling, clear screening, stronger recruitment methods, and balanced quotas can greatly reduce this bias.
Tools like QuestionPro make this process easier by offering features that improve sample control and data quality. Understanding and managing convenience bias helps every researcher produce results that reflect the real behavior of their target population.
Frequently Asked Questions (FAQs)
Answer: Because of convenience bias, your results do not show the whole group you want to understand. The data can be unfair, less accurate, and can lead to wrong decisions.
Answer: It usually happens when you survey people who are easy to reach, like nearby people, online followers, or volunteers, instead of using a planned and balanced sample.
Answer: You can set quotas for different groups, add screening questions, use many channels to send your survey, keep your contact lists updated, and use a mix of sampling methods.
Answer: Screening questions help you separate the right respondents from the wrong ones. Only people who match your study criteria go to the main survey.
Answer: QuestionPro helps you set quotas, add screeners, use many distribution channels, apply smart logic, check data quality, and track answers in real time. All this makes your sample more balanced and your results more reliable.