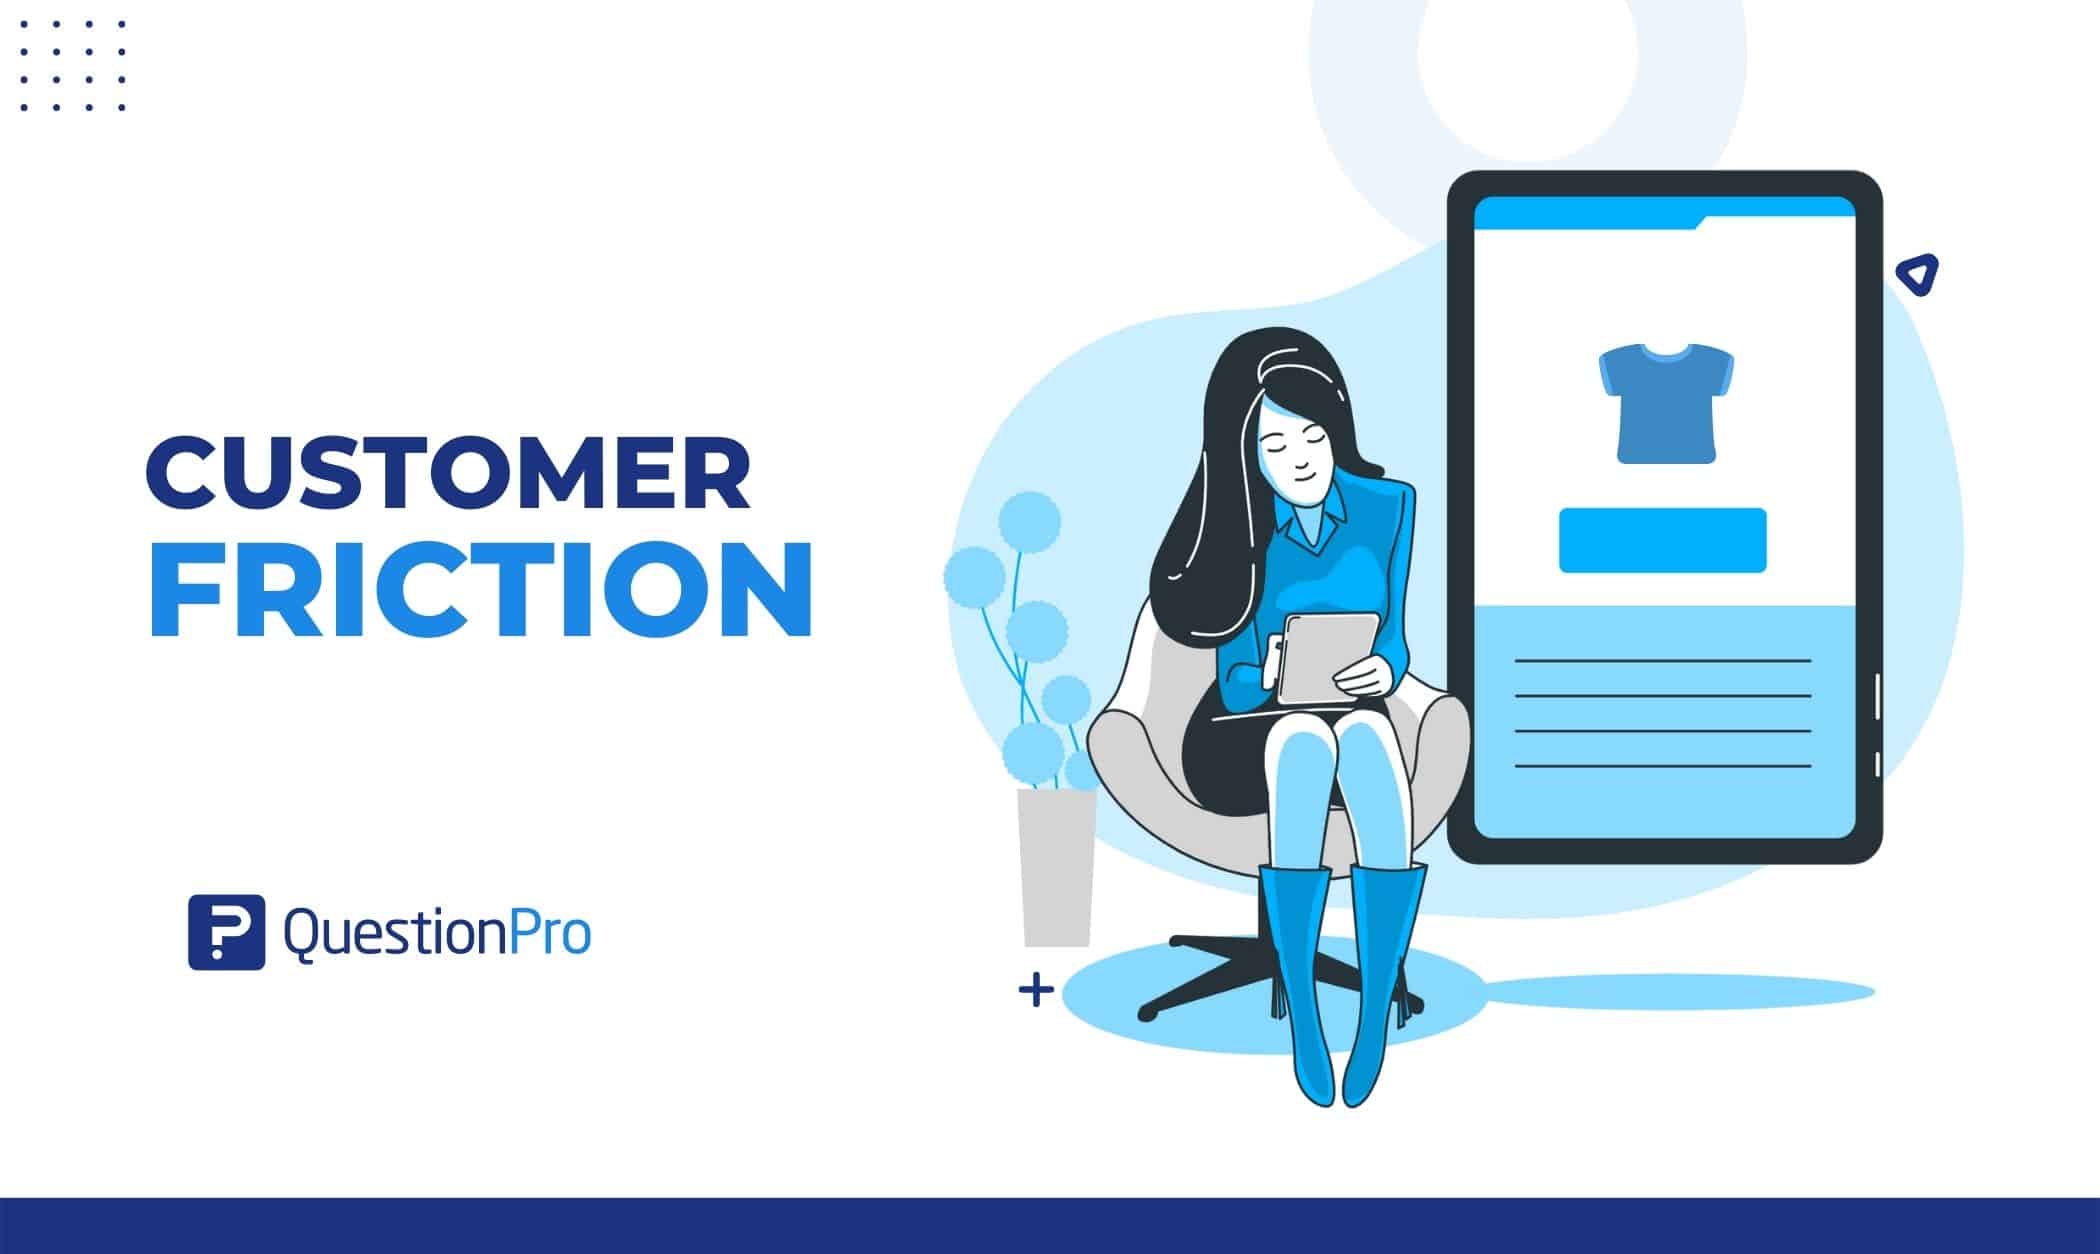
Customer friction is any obstacle that makes it harder for a customer to buy, use, or get help with a product. It can be a slow page, a confusing form, an unclear policy, or a support line that never picks up. Each one adds effort, and effort pushes people away.
Most friction is small, which is why teams miss it. A customer rarely complains about one extra form field. They just leave and do not come back.
In this guide, we’ll cover the types of customer friction, real examples, how to find and measure it, and how to remove it.
What is customer friction?
Customer friction is the effort, confusion, or delay a customer experiences while trying to complete a task with your business. The task can be buying, signing up, learning a product, asking for help, or canceling.
Friction is not always a big failure. It is often a small, repeated annoyance that adds up across the customer journey, the full path a person takes from first hearing about you to renewing or leaving.
Three traits define it:
- It is felt by the customer: A process can look efficient internally and still feel hard from the outside.
- It adds effort: More clicks, more waiting, more guessing, or more repeating.
- It changes behavior: People abandon a cart, skip onboarding, call support, or churn (stop doing business with you).
Customer friction is the obstacle itself, while pain points, customer effort, and churn describe related things. Teams often use these words as if they mean the same thing, and that blurs what to fix.
| Term | What it means | How it relates to friction |
|---|---|---|
| Customer friction | Any obstacle that adds effort to a task | The root cause |
| Friction point | One specific place where friction occurs | A single instance of friction |
| Customer pain point | A broader problem a customer wants solved | Friction often creates or deepens pain points |
| Customer effort | How hard a task felt to the customer | The measurable result of friction |
| Customer churn | Customers who stop buying or renewing | A common outcome of unresolved friction |
For a broader view of problems customers want solved, see our guide to customer pain points.
What are the main types of customer friction?
Customer friction falls into four main types: process, technical, informational, and emotional. Sorting friction this way helps you assign the fix to the right team.
Process friction
Process friction comes from how a task is designed. Common forms include:
- Long checkouts
- Forced account creation
- Repeated data entry
- Return policies that need three emails to complete
Technical friction
Technical friction comes from tools that fail or slow customers down. Examples include slow-loading pages, broken forms, error messages, and sites that do not work well on mobile.
Informational friction
Informational friction appears when customers cannot find or understand what they need. Typical causes:
- Hidden shipping costs
- Vague pricing
- Unclear instructions
Emotional friction
Emotional friction is how an experience makes people feel. A cold support reply, a pushy upsell, or a rule that feels unfair can create distrust even when the task itself works.
What are examples of customer friction at each journey stage?
Friction can show up before, during, and after a purchase. Looking at examples by stage makes it easier to spot where your own business may be losing people.
Before purchase (discovery)
- Confusing site navigation
- Product pages with missing specs or unclear pricing
- Slow load times on mobile
During purchase
- Forced account creation
- Long or complicated checkout
- Surprise fees at the final step
- Limited payment options
After purchase
- Onboarding that skips key steps
- Hard-to-find support contact details
- Slow or complicated returns
- A cancellation flow that takes many steps
Example scenario: A software company notices that trial users sign up but never invite teammates. A short in-app survey shows the invite button sits under a settings menu. Moving it to the main screen is a small change that removes a real barrier to activation.
Is all customer friction bad?
No. Some friction protects the customer or improves the outcome, and removing it can cause harm. The goal is to cut needless effort, not every step.
Helpful friction
- Two-factor authentication on a bank account
- A confirmation step before deleting data
- A “review your order” screen before payment
Harmful friction
- Repeating information the customer already gave
- Hiding the unsubscribe or cancel option
- Requiring an account before showing a price
A simple test: if the extra step protects the customer or prevents an error, keep it. If it only protects an internal process, redesign it.
Why does customer friction matter?
Customer friction matters because effort drives behavior. When a task feels hard, customers leave before they finish it, and they are less likely to return.
Checkout shows this clearly. The Baymard Institute puts the average online cart abandonment rate at 70.22%, based on an average of 50 studies. Among US shoppers who left for reasons other than browsing, 40% cited extra costs, 18% said the site required an account, and 17% found checkout too long or complicated.
Effort also predicts loyalty. A Harvard Business Review study of more than 75,000 people found that customer effort was a better predictor of loyalty than satisfaction measures.
The cost shows up in conversion, support volume, retention, and word of mouth. Fixing friction often lifts all four.
How do you identify customer friction points?
You identify friction points by combining what customers say with what they do. Feedback shows how people feel, and behavior data shows where they stall.
Follow these steps:
- Walk the journey yourself.
Complete a purchase, a sign-up, and a support request as a new customer. Note every moment of hesitation.
- Review behavior data.
Look for pages with high exit rates, steps where users stop, and repeated visits to the same page.
- Read support tickets and reviews.
Group complaints into themes. Repeated phrases point to recurring friction.
- Ask customers directly.
Use short surveys right after key tasks. Add open-ended questions so people can explain what slowed them down.
- Talk to frontline staff.
Sales and support teams hear friction daily.
- Ask “why” repeatedly.
The Five Whys technique means asking why up to five times to reach the root cause instead of the symptom.
- Map the journey.
A customer journey map shows each touchpoint, which is any moment a customer interacts with your brand, so you can mark where effort rises.
How do you measure customer friction?
You measure customer friction with a mix of effort scores, behavior metrics, and operational data. No single number captures it, so track several together.
| Metric | What it shows | Signal to act on |
|---|---|---|
| Customer Effort Score (CES) | How easy a task felt, usually on a 1 to 7 scale | A drop against your own previous period |
| Cart or form abandonment rate | Where users quit a flow | A step with a sharp rise in exits |
| Time to complete a key task | How long a task takes | Time rising while traffic stays steady |
| Support ticket volume by topic | Which tasks cause confusion | One topic growing faster than others |
| Repeat contact rate | Customers who contact you again for the same issue | Rising repeat contacts after a change |
| Conversion rate by step | Progress through each funnel stage | A single step well below the others |
Set your own baseline first, then compare changes over four-week windows. Industry averages vary too much to serve as a fixed target.
To learn more about the score itself, read our guide to Customer Effort Score.
How do you prioritize which friction to fix first?
Prioritize by how many customers a problem touches, how much it costs, and how easy it is to fix. Fixing everything at once is rarely realistic.
Score each friction point on three questions:
- Reach: How many customers hit this step each month?
- Impact: Does it cause abandonment, churn, or extra support contacts?
- Effort to fix: Can one team resolve it in days, or does it need a larger project?
Start with high reach, high impact, low effort fixes. A confusing label on a busy checkout page beats a rare edge case that needs a rebuild.
Then confirm each fix worked. Compare the same metric before and after the change, and keep the survey running to hear whether customers notice the difference.
How do you reduce customer friction?
You reduce customer friction by removing steps, clarifying information, and making help easy to reach. The best fixes target a measured friction point, not a guess.
Simplify checkout and sign-up
Baymard’s data above shows why extra costs, forced accounts, and long flows deserve first attention. Start with three changes:
- Offer guest checkout
- Cut optional fields
- Show total costs early
Make information easy to find
Place pricing, shipping, and return details where customers look for them. Use plain labels and a search box on large sites.
Improve the first-use experience
Give new users a short guided path to their first success. Early drop-off falls when you add:
- Progress indicators
- Short checklists
- A clear first task
Offer self-service and fast support
Build a searchable help center, and let customers reach a person without repeating their story. Share context between teams so customers do not explain twice.
Personalize with care
Personalization removes repeated effort when it stays transparent. Good practice includes:
- Pre-filling known details
- Remembering preferences
- Explaining how you use customer data
Test with real users
Watch people complete key tasks and note where they pause. A handful of sessions often reveals problems that analytics cannot explain.
Close the loop
Tell customers when you fix something they reported. This turns a complaint into proof that feedback matters.
- Send a short thank-you note
- Name the change you made
- Invite a follow-up rating
What common mistakes make friction worse?
The most common mistakes are fixing symptoms, ignoring small issues, and skipping follow-up. Each one lets friction return after a short improvement.
- Treating high satisfaction scores as proof that nothing is wrong
- Relying on analytics without asking customers why
- Fixing the loudest complaint instead of the most common one
- Removing helpful friction, such as security checks
- Launching a redesign without measuring before and after
- Ignoring friction that appears after a site, policy, or pricing change
Satisfaction alone can hide the problem. A customer can be satisfied with the result and still dread the effort.
How can QuestionPro help you find and reduce customer friction?
QuestionPro Customer Experience helps teams find friction by asking customers at the moment it happens, then connecting answers across touchpoints. It supports Customer Effort Score questions, journey-based feedback, and text analysis of open comments.
Three capabilities fit this work best:
- Task-triggered effort questions.
A short Customer Effort Score question right after checkout or a resolved support case
- Reason follow-ups.
An open question asking what made the task difficult, so you get a score and a cause
- Theme grouping.
Text analysis that clusters open answers, so repeated mentions of one step stand out
When many customers mention the same step, you have a clear priority. If you want a wider framework for gathering and acting on feedback, see our guides to Voice of Customer analytics and customer feedback analysis.
Final thought: Friction is a signal, not just a problem
Customer friction tells you where your business asks too much of the people you want to keep. Every extra step is a quiet question: is this worth it?
The strongest teams treat friction as ongoing work. They watch behavior, ask customers for context, fix the biggest barriers first, and measure again. They also understand the consumer decision journey, so they remove obstacles at the moments that shape a choice.
Small, steady fixes compound. Over time, an easy experience becomes part of why customers stay.
Frequently Asked Questions (FAQs)
A friction point is one specific moment where a customer faces extra effort, such as a long form, an unclear price, or a hard-to-find support link. Teams find them by mapping the journey and checking where customers stall or leave.
Yes. Security checks, order confirmation screens, and delete warnings add effort on purpose to protect customers from errors or fraud. Keep friction that prevents harm, and remove steps that only serve internal processes.
Review key flows such as checkout, onboarding, and support every quarter, and again after any major change to your site, pricing, or policies. Continuous feedback surveys help catch new friction between audits.
Ownership is shared. Product and design handle flows, IT handles speed and errors, support spots recurring complaints, and a CX lead usually coordinates priorities. A single owner for the friction backlog keeps fixes from stalling.
Complete your own sign-up and purchase as a new customer, then add one short survey question after a key task asking how easy it was. Those two steps surface the most obvious barriers within days.