




Stratified sampling is a probability sampling method. It divides a population into distinct, non-overlapping subgroups, called strata, then draws a random sample from each one. Researchers use it to guarantee every important subgroup shows up in the final sample, instead of leaving representation to chance.
You may also see this method called stratified random sampling. Both names describe the same technique. Random selection happens inside each stratum, not across the whole population at once. This works best when a population is too varied for a simple random sample to represent fairly. Splitting a heterogeneous group into homogeneous strata produces far more precise estimates.
In this guide, we’ll cover how stratified sampling works and its two main types. We’ll also show when to use it over cluster or quota sampling, and how to size each stratum correctly.
What is stratified sampling?
Stratified sampling separates a population into mutually exclusive, homogeneous groups called strata. It then draws a random sample from each stratum instead of the population as a whole. It is one of the four core probability sampling methods, alongside simple random, systematic, and cluster sampling. Every stratum should be internally similar, while strata should differ from each other on the trait that matters to the study.
Consider a study on attitudes toward a policy issue across U.S. age groups. A researcher could survey the entire adult population, but a stratified sample of 2,000 people works just as well. Divide that sample into age strata, such as 18-29, 30-44, 45-59, and 60 and older. Each stratum then contributes its own random sample. The final group reflects the real population’s age spread, not whatever age range happened to respond first.
The list a researcher draws these samples from is called the sampling frame. An accurate frame matters as much as the stratification itself. Missing segments (undercoverage) or duplicate entries (overcoverage) distort the sample, no matter how well the strata are defined.
How does stratified sampling work?
Stratified sampling follows a fixed sequence. Skipping a step, especially evaluating the sampling frame, is where most errors creep in. Here is the process from start to finish:
- Define the target population.
Set clear boundaries for who or what the study covers.
- Identify the stratification variable.
Choose a characteristic, such as age, income, region, or disease severity, that’s relevant to the research question.
- Build or source a sampling frame.
Assemble a list that includes the stratification variable for every element in the population.
- Evaluate the frame.
Check for undercoverage, overcoverage, and duplicate listings. Fix the frame before sampling begins.
- Divide the frame into strata.
Assign every element to exactly one stratum. Strata must be mutually exclusive and collectively exhaustive.
- Decide the sample size per stratum.
Choose proportionate or disproportionate allocation (covered below) based on what the study needs to detect.
- Randomly select from each stratum.
Apply simple random sampling or systematic sampling inside each stratum until every quota is filled.
Skip any one of these steps and the sample stops being representative. That defeats the entire point of stratifying.
Types of stratified sampling
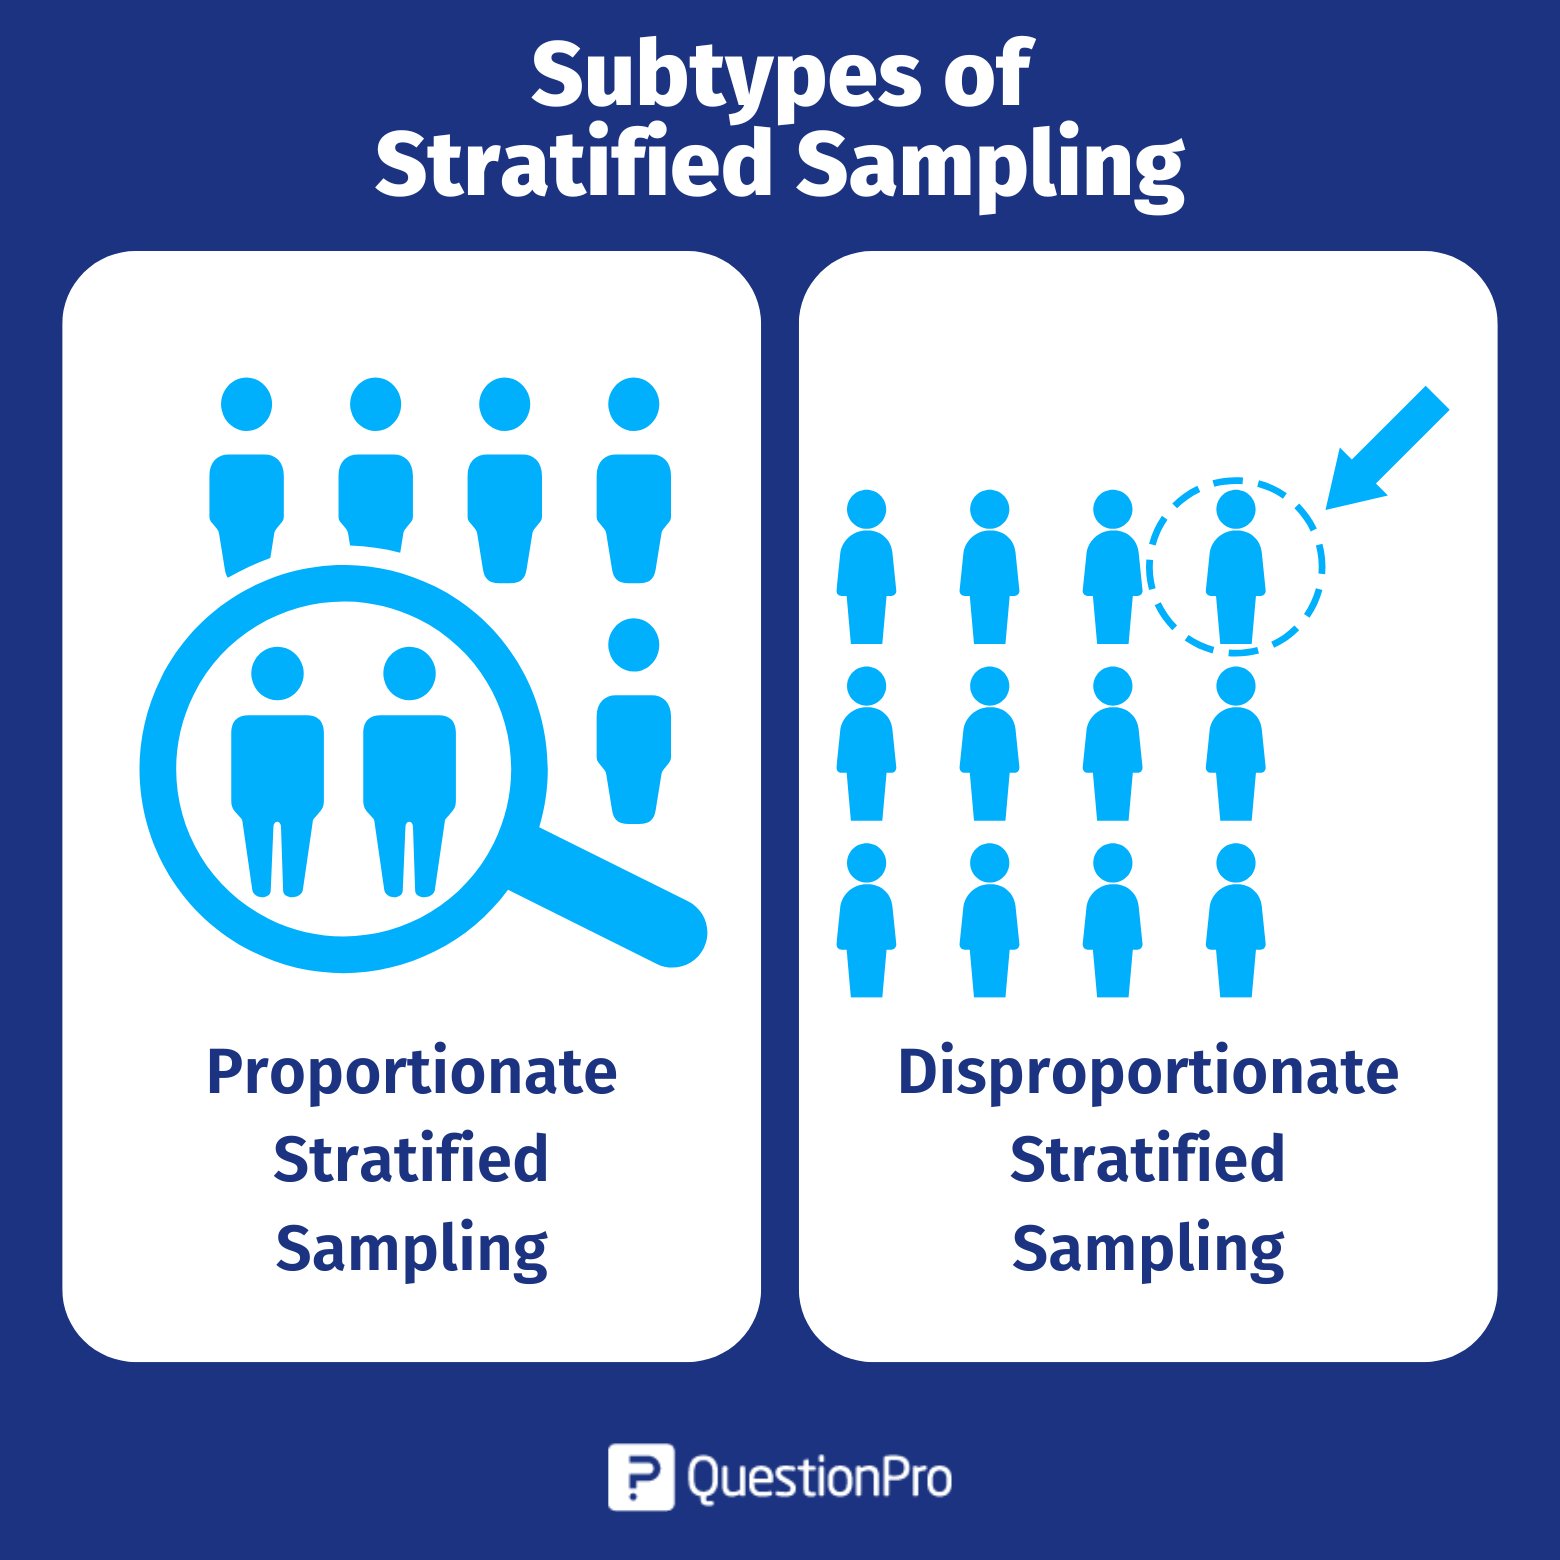
Stratified sampling splits into two types, based on how researchers distribute sample size across strata. Each choice uses a different formula and supports different kinds of analysis.
Proportionate Stratified Sampling
In proportionate stratified sampling, each stratum’s sample size matches its share of the total population. Every stratum uses the same sampling fraction. This makes the overall sample self-weighting and straightforward to analyze.
Formula: nh = (Nh / N) × n
- nh = sample size for stratum h
- Nh = population size of stratum h
- N = total population size
- n = total sample size
| Stratum | A | B | C | D |
|---|---|---|---|---|
| Population size | 500 | 1,000 | 1,500 | 2,000 |
| Sampling fraction | 1/2 | 1/2 | 1/2 | 1/2 |
| Sample size | 250 | 500 | 750 | 1,000 |
The fraction stays constant across every stratum. That makes proportionate sampling a good fit when the goal is a population-wide estimate, not a detailed comparison between small strata.
Disproportionate Stratified Sampling
In disproportionate stratified sampling, each stratum gets a different sampling fraction. The sample no longer mirrors the population’s actual makeup. Researchers do this on purpose: oversampling a small but important stratum, such as a rare disease-severity level, produces enough cases to analyze it reliably. Proportionate sampling can’t always deliver that.
- Stratum A: Population 500, fraction 1/2, sample size 250
- Stratum B: Population 1,000, fraction 1/3, sample size 333
- Stratum C: Population 1,500, fraction 1/4, sample size 375
- Stratum D: Population 2,000, fraction 1/5, sample size 400
The trade-off is population-level precision. Because the fractions differ, researchers must reweight the raw sample before using it to estimate anything about the full population. Otherwise the smaller, oversampled strata carry more influence than their real size warrants.
Stratified sampling examples
By dividing a population into distinct subgroups, or “strata,” before drawing a sample, researchers can ensure every segment is proportionally represented. This method is crucial for reducing sampling error and capturing nuanced differences that a simple random sample might miss.
Below are three real-world scenarios demonstrating how stratification is applied to yield more accurate, actionable data.
Grade-level survey
A school of 1,000 students wants feedback from a sample of 100. Subject preferences vary by grade. The researcher stratifies by grade level first, then applies the proportionate formula to each one:
- Grade 5 (150 students): 100/1,000 × 150 = 15
- Grade 6 (250 students): 100/1,000 × 250 = 25
- Grade 7 (300 students): 100/1,000 × 300 = 30
- Grade 8 (200 students): 100/1,000 × 200 = 20
- Grade 9 (100 students): 100/1,000 × 100 = 10
Healthcare subgroup analysis
A hospital studying treatment response stratifies patients by age bracket and disease severity before sampling. Outcomes can vary sharply between a mild case in a 30-year-old and a severe case in a 70-year-old. This approach lets researchers report results by subgroup, instead of one blended average that hides where a treatment actually works.
Public opinion polling
National polls commonly stratify by region, political affiliation, or age. That keeps any single demographic from dominating the sample by chance. The stakes are real: a Pew Research Center comparison of online survey samples found roughly twice the average error in opt-in samples versus probability-based panels. Stratification is one tool that keeps a probability-based sample accurate.
Advantages and disadvantages of stratified sampling
Stratified sampling trades extra setup work for more precise, subgroup-ready data. Weigh both sides before choosing it over a simpler method.
Advantages
- Higher precision than simple random or cluster sampling, since variation within each stratum is lower than variation across the whole population.
- Guarantees every subgroup is represented, reducing the risk of sampling bias toward whichever group responds first.
- Supports smaller overall sample sizes for the same statistical confidence, since homogeneous strata need less data to estimate accurately.
- Enables direct subgroup comparisons, so researchers can report results by age, region, or any other stratification variable.
Disadvantages
- Requires a complete, accurate sampling frame with the stratification variable for every population element. That takes more upfront work than simple random sampling.
- Misclassifying elements into the wrong stratum introduces bias that’s hard to catch after the fact.
- Offers little benefit for populations with no meaningful subgroups, where a simple random sample works just as well for less effort.
- Disproportionate designs need reweighting before the sample can represent the full population, an extra analysis step most other methods skip.
When should you use stratified sampling?
Reach for stratified sampling any time a population’s subgroups are likely to respond differently to the question being asked. The study needs each subgroup represented reliably, not left to chance. It fits particularly well when:
- The population splits naturally into subgroups tied to the research question, such as age, income tier, disease stage, or region.
- Comparing subgroups is the actual goal, since simple random sampling can under-represent smaller groups by chance.
- Some subgroups are hard to reach, and stratifying lets a researcher target them intentionally instead of hoping they show up.
- The study needs a smaller total sample size than simple random sampling would require for the same precision.
Public opinion polling, market segmentation studies, and clinical trials that report outcomes by patient subgroup are the most common real-world uses.
Stratified Sampling vs Cluster Sampling vs Quota Sampling
These three methods get confused constantly, since all three divide a population into groups before sampling. The difference is what happens after the groups are formed.
| Feature | Stratified sampling | Cluster sampling | Quota sampling |
|---|---|---|---|
| Sampling type | Probability | Probability | Non-probability |
| Group composition | Homogeneous within each stratum | Heterogeneous, mirrors the population | Defined by researcher-set quotas |
| Selection method | Random selection within every stratum | Random selection of entire clusters | Non-random selection until quotas fill |
| Goal | Precision and subgroup representation | Cost and logistical efficiency | Speed and low cost |
| Bias risk | Low, if strata are well defined | Moderate, depends on cluster similarity | Higher, since selection isn’t random |
Stratified sampling draws from every group. Cluster sampling samples a handful of whole groups and skips the rest. Quota sampling looks similar to stratified sampling on the surface, since both divide the population into segments first. But quota sampling drops the random-selection step, so its results can’t generalize to the population with the same statistical confidence. For a deeper breakdown, see quota sampling vs. stratified sampling.
How to calculate the right sample size for each stratum
Start with the total required sample size. Then apply the proportionate formula, nh = (Nh / N) × n, to each stratum, unless there’s a specific reason to oversample one of them.
As a working minimum, pull at least one representative unit from every stratum. Treat 30 as the practical floor for any stratum you plan to analyze on its own. Smaller strata can produce unstable percentages, which makes subgroup conclusions unreliable even when the overall sample size looks fine on paper.
Common mistakes to avoid:
- Treating overlapping categories as separate strata. A person can’t belong to two age brackets at once. If a stratification variable allows overlap, it isn’t defining true strata.
- Skipping the sampling frame evaluation step, then discovering undercoverage only after the data is collected.
- Using proportionate allocation when the real goal is to analyze a small subgroup in depth, then finding that subgroup’s sample is too small to say anything meaningful.
How QuestionPro supports stratified sampling in research
Building strata and pulling a clean sampling frame is only half the job. Analyzing each stratum afterward is where many studies stall. QuestionPro’s Market Research Software handles exactly this kind of subgroup breakdown once the data comes in:
- Cross-tabulation and segmentation tools compare results stratum by stratum, without exporting the dataset into a separate statistics package.
- Weighting options help correct disproportionate designs before reporting population-level estimates, instead of leaving that reweighting step to a spreadsheet.
Choosing the right sampling method for your research
The best sampling method matches what a study actually needs to prove, not whichever one is fastest to run. If subgroup representation matters, whether that’s age brackets in a policy survey or severity levels in a clinical trial, stratified sampling earns its extra setup time. It protects every group’s presence in the final numbers.
If the population is genuinely homogeneous, or the research question doesn’t hinge on subgroup differences, a simpler method reaches the same conclusion with less work.
Frequently Asked Questions (FAQs)
Yes. Both terms describe the identical technique: dividing a population into strata and randomly sampling within each one. “Stratified random sampling” simply spells out the random-selection step that “stratified sampling” already implies, so researchers use the two names interchangeably in the literature.
There’s no universal number, but treat around 30 units as a practical floor for any stratum you plan to analyze separately. Smaller strata produce unstable percentages, which undermines the entire reason for stratifying the sample in the first place.
Yes, as long as every stratum still ends up large enough to sample meaningfully. If stratifying would leave one or more strata with only a handful of members, the population is too small for it. Simple random sampling will likely produce more stable results.
No. Strata almost never end up equal in size; they’re grouped by shared characteristics like age or income, not by headcount. Proportionate sampling reflects each stratum’s real size in the sample, while disproportionate sampling deliberately samples some strata more heavily than others.
Stratified sampling is a probability method that randomly selects within predefined subgroups, giving every population element a known chance of selection. Convenience sampling is a non-probability method that selects whoever is easiest to reach, with no random selection or defined strata involved at all.



