
The pioneering American mathematician John Tukey conceived Exploratory Data Analysis (EDA) in the 1970s. Fast forward to today, and EDA techniques remain a cornerstone in the data discovery process, standing the test of time as a widely employed method. Going beyond formal modeling or hypothesis testing, EDA unfurls a vast opportunity for gaining a deeper understanding of dataset variables and the intricate web of relationships among them. Furthermore, it plays a pivotal role in ascertaining the suitability of the statistical techniques earmarked for data analysis.
In a world inundated with data, EDA serves as a potent ally in unveiling the inherent stories and nuances within datasets. It empowers data scientists to discern hidden patterns, identify outliers, and even inspire the formulation of new hypotheses. EDA acts as a compass, fostering this intimate connection with the data, guiding analysts toward the most fitting analytical methodologies. It excels in helping identify missing values, find correlations between other variables, locate the third quartile, and calculate the interquartile range. EDA plays an invaluable role in deciphering the complexities of most datasets and the varied relationships between data points. Its enduring relevance in the data science landscape underscores its indispensable role in shaping the future of data-driven decision-making.
What is Exploratory Data Analysis?
Exploratory Data Analysis (EDA) is a critical data analysis process involving the initial examination and exploration of a dataset. Its primary purpose is to summarize the main characteristics of the data, often through visualization and summary statistics, to gain insights into its structure, patterns, and potential issues.
Exploratory Data Analysis (EDA) is a fundamental and widely utilized approach within data science. It involves thoroughly investigating and analyzing a dataset to summarize its main characteristics through various visual and statistical methods. EDA serves multiple purposes, including the discovery of data patterns, the identification of anomalies, hypothesis testing, and the validation of assumptions. It closely aligns with Data analytics and data analysis, which are interrelated processes to extract valuable insights from data to facilitate informed decision-making.
In essence, EDA can be briefly defined as a method that empowers scientists to determine the most effective means of manipulating a given dataset to achieve their desired goals and extract meaningful information.
Exploratory Data Analysis Types
processes to extract valuable insights from data to facilitate informed decision-making.
EDA typically involves various types of analyses and techniques. Here are some common types of exploratory data analysis:
Univariate Non-graphical
Univariate Non Graphical is the most simplest form of data analysis. here it consists of just one variable. Being a single variable, it doesn’t deal with causes or relationships. Instead, the primary purpose of the univariate thematic analysis is to describe the data and find patterns within it.
Univariate Graphical
Non-graphical methods cannot provide a complete picture of the data. Graphical methods are therefore required here. The Common types of univariate graphics are:
- Stem-and-leaf plots: These show all data values and the shape of the distribution.
- Histograms a bar plot: in which each bar represents the frequency (count) or proportion (count/total count) of cases for a range of values.
- Box plots: graphically depict the five-number summary of minimum, first quartile, median, third quartile, and maximum.
Multivariate Non-graphical
Multivariate data arises from more than one variable. Generally, Multivariate non-graphical EDA techniques show the relationship between two or more data variables through cross-tabulation or statistics.
Multivariate Graphical
Multivariate data uses graphics while displaying relationships between two or more Dataset. The Most used graphic is a grouped bar plot or bar chart with each group representing one level of one of the variables and each bar within a group representing the levels of the other variable.
The Other common types of multivariate graphics include:
- Scatter plot: Is used to plot data points on a horizontal and a vertical axis to show how much one variable is affected by another.
- Multivariate chart: Is a graphical representation of the relationships between factors and a response.
- Run chart: Is a line graph of data plotted over time.
- Bubble chart: Is a data visualization that displays multiple circles (bubbles) in a two-dimensional plot.
- Heat map: Is a graphical representation of data where values are depicted by color.
EDA is an iterative process, and the choice of techniques and visualizations depends on the data’s nature and the analysis’s specific goals. It helps analysts gain insights, make decisions, and prepare the data for further modeling or analysis.
Steps of Exploratory Data Analysis Process
Exploratory Data Analysis (EDA) typically involves several key steps to gain insights into a dataset. While the specific sequence of steps can vary, here is a general outline of the EDA process:
- Data Collection: Gather the dataset.
- Data Cleaning: Handle missing values and outliers.
- Data Exploration and Visualization: Analyze and visualize the data.
- Feature Engineering: Enhance dataset for modeling and analysis.
- Hypothesis Testing: Validate assumptions.
- Communication and Documentation: Share findings and document the process.
EDA aims to gain a deep understanding of the data, identify patterns and relationships, and make informed decisions about subsequent steps in the data analysis process, such as feature selection, model building, or further data processing.
How Important Exploratory Data Analysis in Data Science
Exploratory Data Analysis (EDA) is a fundamental and crucial step in the field of data science for several reasons:
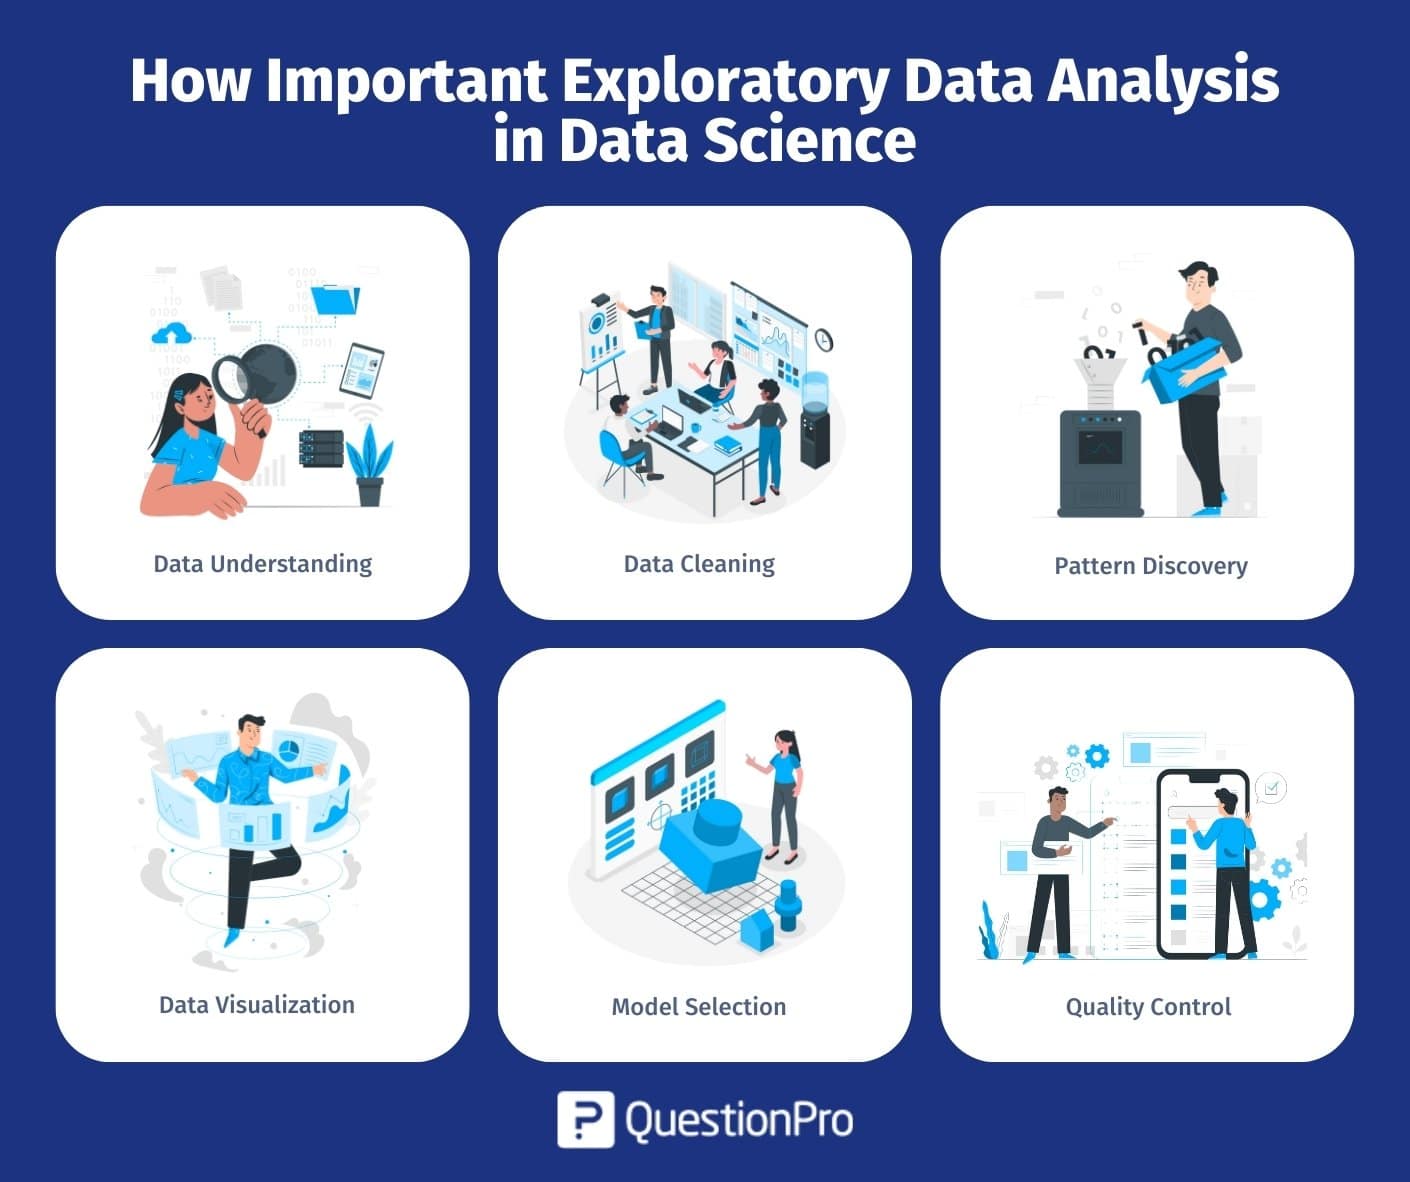
Data Understanding:
EDA helps data scientists understand the dataset they are working with, including data collection methods and the data source. It provides insights into the data set’s structure, quality, and characteristics. Data scientists examine the data types, summary statistics, and distribution of data points to grasp their fundamental properties.
Data Cleaning:
EDA often needs to uncover missing values, outliers, and inconsistencies in the data. Cleaning and preprocessing the data is essential for building accurate and reliable models. Handling missing matters is crucial during this stage, as they can significantly impact the analysis and model performance.
Pattern Discovery:
EDA techniques reveal data patterns, relationships, and trends. A data scientist can identify patterns and correlations by conducting univariate analysis and examining the relationships between variables through bivariate or multivariate analysis. It can be valuable for making informed decisions and formulating hypotheses to answer exciting questions about the data.
Data Visualization:
Visualizations created during EDA, such as histograms, scatter plots, and box plots, make it easier to communicate findings and insights to technical and non-technical stakeholders. They can be powerful tools for storytelling, helping to convey the data’s story effectively.
Model Selection:
Based on the insights gained from EDA, scientists can make informed decisions about model selection. For instance, if EDA reveals non-linear relationships or interactions between variables, it may lead to the choice of non-linear models like decision trees or neural networks.
Quality Control:
EDA can uncover data quality issues early in the analysis process. Addressing these issues, such as data outliers and inconsistencies, is crucial before modeling. Detecting and handling data quality problems at this stage can save time and resources.
EDA is not just important but essential in data science. EDA helps a data scientist makes informed decisions, understand the data’s limitations, and extract valuable information from the data, ultimately leading to more accurate and meaningful results. It plays a critical role in addressing missing values, summarizing data points, and ensuring the data set is ready for in-depth analysis.
Exploratory Data Analysis Tools
Exploratory Data Analysis (EDA) is a necessary process in data analysis, and several tools are available to help data scientists and analysts in this endeavor. Among the most popular tools for EDA are R, Python, and SAS. Each tool has its strengths and weaknesses, making it essential to choose the right one for your specific needs.
R:
The data science community widely acknowledges R as an exceptional tool for visualizing data during EDA. R furnishes an extensive repertoire of plots and charts, encompassing histograms, box plots, and scatter plots, which analysts can employ to investigate data from various perspectives. R provides a rich set of visualization options and an extensive collection of statistical functions, making it valuable for performing more advanced analyses. R is favored by statisticians and data scientists for its versatility and comprehensive statistical capabilities.
Python:
Python is another robust tool for EDA. It shares many features with R, making it a compelling choice for data analysis. Python’s advantage lies in its user-friendliness and versatility, making it a good option for beginners just getting started with data analysis. The Python ecosystem includes libraries like Pandas, Matplotlib, Seaborn, and Plotly, which facilitate data manipulation and visualization. Python’s readability and extensive community support further enhance its appeal for data exploration.
SAS:
SAS is a powerful software package for statistical analysis and data exploration. It is renowned for its capabilities in handling complex calculations and conducting advanced statistical analyses. While SAS is a formidable tool, it’s important to note that it tends to be more expensive than open-source alternatives like R and Python. However, the investment can be worthwhile for organizations and professionals who require the robust statistical features SAS offers.
In addition to these three primary tools, other software and platforms can be valuable for EDA. For instance, tools like Tableau, Excel, Power BI, and KNIME offer user-friendly interfaces for interactive data exploration and visualization, making them suitable for a broader audience, including non-technical stakeholders.
Choosing an EDA tool depends on your specific goals, expertise, and budget. While R, Python, and SAS are among the top choices, selecting the right tool for your project is essential for conducting practical exploratory data analysis. Data scientists often encounter challenges related to missing values, data sets, dependent variables, median values, categorical variables, data points, and analysis techniques. Proper handling of these aspects is crucial to deriving meaningful insights from raw data and preparing new data collections for further analysis. Additionally, measures such as standard deviation and other statistical metrics are essential for understanding the distribution and variability of data points.
QuestionPro and Exploratory Data Analysis
When you obtain your data from various sources, QuestionPro offers excellent support in gathering survey data through multiple channels. However, what do you do when you wish to delve deeper into the data beyond what’s already been collected? It is where exploratory data analysis (EDA) comes into play.
QuestionPro’s integrated suite of analytical tools simplifies the initiation of EDA. It enables you to swiftly access your data’s summary statistics, such as median values and cumulative distribution functions. You can also craft interactive visualizations to uncover patterns and relationships within the dataset. Furthermore, QuestionPro’s seamless integration with R allows you to harness R’s formidable statistical capabilities, including regression analysis for understanding dependent variables.
Suppose you’re ready to take your data analysis to a more advanced level, whether for data analytics, machine learning, or deep learning tasks. QuestionPro stands out as the perfect tool for the job. It equips you to handle missing values, work with diverse data sets, and extract valuable insights from data points.
Conclusion
Exploratory data analysis (EDA) remains a well-established methodology, serving as a valuable compass for a data scientist navigating intricate datasets. By leveraging the power of visualizations, correlation coefficients, and other analytical techniques, EDA unveils intricate patterns and relationships that might otherwise remain concealed. It plays a pivotal role in detecting and addressing missing values, understanding the behavior of dependent variables, and employing various analysis techniques, including those associated with data analytics and machine learning.
Hence, EDA stands as a fundamental cornerstone of any data analysis endeavor. This article has provided you with a solid introduction to this indispensable practice. In the ever-evolving landscape of data science, EDA remains essential, enabling the transformation of raw data into actionable insights.
Authors: Md Assalatuzzaman & Mizanul Islam