• Skip to main content
  • Skip to primary sidebar
  • Skip to footer
QuestionPro

QuestionPro

questionpro logo
  • Products
    survey software iconSurvey softwareOur flagship survey solution. Sophisticated tools to get the answers you need.research edition iconResearch SuiteTuned for researchers. Get more insights. Response based pricing.CX iconCXExperiences change the world. Deliver the best with our CX management software.WF iconWorkforceEmpower your work leaders, make informed decisions and drive employee engagement.
  • Solutions
    IndustriesGamingAutomotiveSports and eventsEducationGovernment
    Travel & HospitalityFinancial ServicesHealthcareCannabisTechnology
    Use CaseNPS+CommunitiesAudienceContactless surveysMobile
    LivePollsMember ExperienceGDPRPositive People Science360 Feedback Surveys
  • Resources
    BlogeBooksSurvey TemplatesCase StudiesTrainingHelp center
  • Features
  • Pricing
Language
  • English
  • Español (Spanish)
  • Português (Portuguese (Brazil))
  • Nederlands (Dutch)
  • العربية (Arabic)
  • Français (French)
  • Italiano (Italian)
  • 日本語 (Japanese)
  • Türkçe (Turkish)
  • Svenska (Swedish)
Call Us
+1 800 531 0228 +1 (647) 956-1242 +52 999 402 4079 +49 301 663 5782 +44 20 3650 3166 +81-3-6869-1954 +61 2 8074 5080 +971 529 852 540
Log In Log In
SIGN UP FREE

Home Market Research

Graphic Rating Scale: Pros & Cons + Examples

Graphic Rating Scale is a performance appraisal method to evaluate employees on performance & productivity-related criteria. Learn more here.

Facilitating regular employee assessments is one of the main duties of every human resources department. They must ensure that employees know their strengths and weaknesses and how to step up in the company.

That’s why HR professionals are always looking for ways to evaluate employee performance that can accurately show where an employee is doing well and, more importantly, where they need to improve. The scale is a well-known and reliable approach for evaluating employee performance.

It is crucial to evaluate the pros and cons of this method before implementing it in the workforce because it does provide some unique difficulties. Now let’s move on to learn its pros, cons, and some examples.

What is the Graphic Rating Scale?

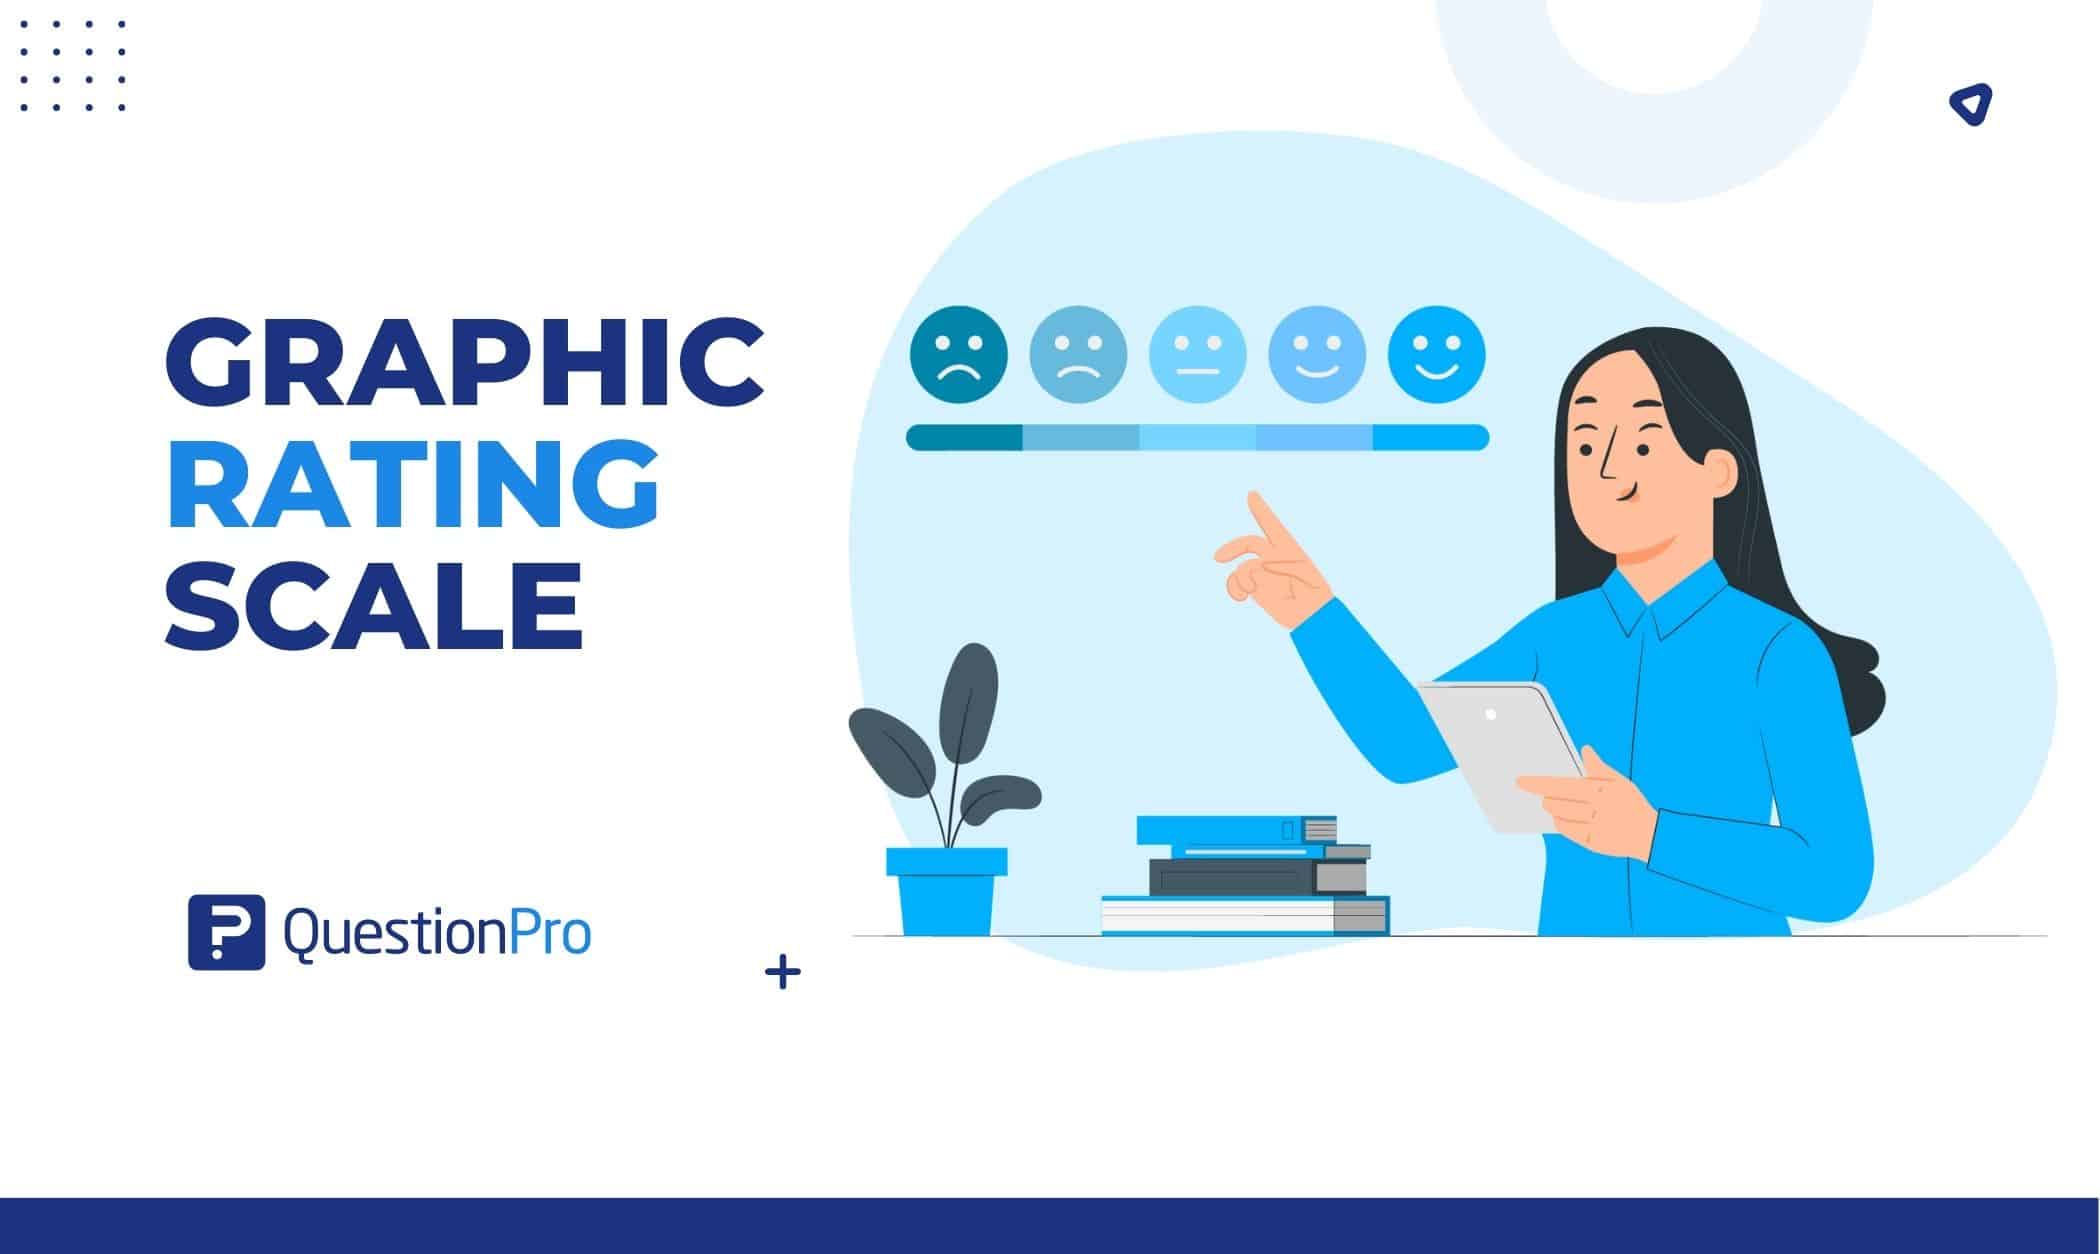
The graphic Rating Scale is a performance appraisal method to evaluate employee engagement, performance & productivity-related criteria.

Respondents can choose a particular option on a line or scale to show how they feel about something. A graphic rating scale shows the answer choices on a scale of 1-3, 1-5, etc. The Likert Scale is a common graphic rating scale example. HR managers often use this rating scale to evaluate employees.

What does Graphic Rating Scale measure?

Using a graphic rating scale, you can measure various employee behaviors. Forms can be standard or tailored to a specific job or group of similar positions. Behaviors that employees need to have to do their jobs well are usually the ones that are measured.

Commonly measured behaviors using a graphic rating scale include:

  • Communication with coworkers
  • Initiative
  • Self-motivation
  • Punctuality
  • Teamwork
  • Submission of well-done work

Formats of the Graphic Rating Scale

A graphic rating scale may be created in a variety of ways. The rating scale can be created solely based on the employer’s judgment and the employee’s demands.

In any scenario, a two-point scale is used to rate everything. Here are some commonly used formats:

  • Number Scale: Numeric values are used for this rating scale. Numbers from either 1 to 5 or 1 to 10 can be used for this ranking. The scale runs from one to ten, with one representing “improvement is needed” and ten representing “outstanding.”
  • Word Scale: It comprises performance-related phrases that describe and rank an employee’s performance. For example, the rating scale can be divided into poor, fair, good, and excellent categories.
  • Comment Scale: It gives the employee either short or long comments. The comments should be the same for everyone. For example, it can be Meets expectations, Below expectations, Above average, etc. Sometimes comments can also be complete sentences.
  • Mixed Standard Scale: This scale has a mix of statements that show good, average, and bad performance. The supervisor is requested to grade each employee with a rating of positive (+) rating, neutral (=), or negative (-) rating corresponding to above-average, average, and below-average performance.

What are the pros of the Graphic Rating Scale?

There are many good reasons why employers use a rating scale to measure how well employees do their jobs. When objective data isn’t available or helpful for the situation, a graphic rating scale is often the best choice.

Here are some good things about these scales:

  • User-friendly

The graphic rating scale method is simple and easy to understand. Most people have probably filled out a similar questionnaire before, so it doesn’t take much extra training, and both managers and employees can understand it. This is why it is often used to rate performance.

  • Behavior quantification simplifies evaluation

Finding and acting on ways to improve is easy, and you can keep track of your progress. The way this method measures behavior makes it much easier to look at the feedback and find trends, patterns, and other changes. This makes the whole appraisal system run more smoothly.

  • Cost-effective

A graphic rating scale can be made quickly, and many questions can be used more than once because they apply to more than one role in the organization. This makes it a cheap way for almost any business to measure employee performance.

What are the cons of the Graphic Rating Scale?

The method of using a graphic rating scale also has certain cons. Using these rating systems has the following limitation:

  • Evaluators’ subjectivity

The graphic rating scale demands your subjective judgment. Thus your definition of a satisfactory job may vary from other leaders. The nature of your relationship with the team member may also affect how you respond.

  • Biases

When using a graphic rating scale, the bias known as the halo effect manifests itself when employees evaluate a candidate simply based on their considered best quality. This can happen if an employee dresses very nicely or talks very well. It can also happen if a friend or coworker strongly recommends an employee.

  • Hard to know employee strengths

After the survey, the total points are calculated, and an average score is provided to each employee. This may not give an accurate picture of an employee’s overall performance, which is a problem with this type of scale.

Example of Graphic Rating Scale

Let’s look at several examples of how a graphic scale can be implemented.

Example 1

Question: How would you rate the employee’s ability to communicate?

Choose the best answer:

  1. Very poor (The employee fails to reveal critical information, is terrible with clients, or confuses coworkers)
  2. Below Average (The employee has trouble communicating with coworkers and customers)
  3. Average (Neither excellent nor bad with words)
  4. Good (The employee communicates with colleagues and customers well and on time)
  5. Excellent (The employee’s communication skills boost the efficiency of their team)

Example 2

Question: This employee has a strong desire to succeed independently.

Decide which response you agree with most:

  1. Strongly disagree (The employee needs micromanagement and doesn’t complete responsibilities unless encouraged)
  2. Disagree (The employee rarely takes the initiative)
  3. Neutral (The employee’s self-motivation isn’t clear, or they haven’t had many chances to be proactive)
  4. Agree (The employee makes an effort to help out where they can and rarely needs reminders to finish their work.
  5. Strongly agree (The employee completes projects early and regularly volunteers for extra work)

Example 3

Question: Rate the employee on how well they pay attention to details.

Choose a number from 1 to 10, where 1 means very poor and 10 means excellent.

Conclusion

The graphic rating scale method is superior to other methods for performance management measurement because it provides higher accuracy. This approach is used widely in many industries and produces decent results.

It is possible to develop an effective action plan to increase engagement, productivity, and effectiveness across the organization by combining this strategy with other approaches to get a precise picture of your employees’ performance. Despite its drawbacks, it’s one of the best ways to monitor employee performance.

The QuestionPro research suite is a collection of tools for making the most of research and changing experiences. QuestionPro provides researchers with data collection tools such as survey software and InsightHub for long-term research.

If you need assistance with configuring the graphic rating scale, contact the QuestionPro team of specialists. Schedule a demo or tell us what you require! QuestionPro can assist you in making the most of your requirements and guiding you through the process.


SHARE THIS ARTICLE:

About the author
Fabyio Villegas
View all posts by Fabyio Villegas

Primary Sidebar

Gain insights with 80+ features for free

Create, Send and Analyze Your Online Survey in under 5 mins!

Create a Free Account

RELATED ARTICLES

HubSpot - QuestionPro Integration

What’s Coming Up in September 2022?

Aug 25,2022

HubSpot - QuestionPro Integration

Data and Emotions, People and Machines: Contextual Business in the Age of AI

Nov 18,2021

HubSpot - QuestionPro Integration

Employee Lifecycle: What it is & Stages

Jun 01,2022

BROWSE BY CATEGORY

  • Academic
  • Academic Research
  • Academic Research
  • Artificial Intelligence
  • Assessments
  • Audience
  • Brand Awareness
  • Brand Awareness
  • Branding
  • Business
  • Business
  • Case Studies
  • Communities
  • Consumer Insights
  • Consumer Insights
  • Customer effort score
  • Customer Engagement
  • Customer Experience
  • Customer Experience IN
  • Customer Loyalty
  • Customer Loyalty
  • Customer Research
  • Customer Satisfaction
  • Customer Satisfaction
  • CX
  • Decision Making
  • Employee Benefits
  • Employee Engagement
  • Employee Engagement
  • Employee Engagement
  • Employee Retention
  • Employee Retention
  • Employee Retention
  • Employee Retention
  • Enterprise
  • Events
  • Forms
  • Friday Five
  • General Data Protection Regulation
  • Guest Post
  • Insights Hub
  • Intercept
  • klantervaring
  • Life@QuestionPro
  • LivePolls
  • Market Research
  • Market Research
  • Marketing
  • Marketing
  • Marktonderzoek
  • medewerkersonderzoek
  • Mercadotecnia
  • Mobile
  • Mobile
  • Mobile App
  • Mobile diaries
  • Mobile Surveys
  • New Features
  • non-profit
  • NPS
  • Online Communities
  • Polls
  • Question Types
  • Questionnaire
  • QuestionPro
  • QuestionPro Products
  • QuestionPro Products
  • Release Notes
  • Research
  • Research Tools and Apps
  • Revenue at Risk
  • Startups
  • Survey Templates
  • Surveys
  • Surveys
  • Tech News
  • Tech News
  • Tips
  • Training
  • Training Tips
  • Trending
  • Uncategorized
  • Video Learning Series
  • VOC
  • Webinar
  • Webinars
  • What’s Coming Up
  • Workforce
  • Workforce
  • Workforce
  • Workforce
  • Workforce Intelligence
  • Workforce Intelligence
  • Workforce Intelligence

Footer

MORE LIKE THIS

What’s Coming Up in April 2023?

Mar 31, 2023

Release Notes – March 2023

Mar 31, 2023

A brand ambassador program is a marketing strategy in which an individual becomes a representative of a company, promoting its brand.

Brand Ambassador Program: What it is + Effective Guide

Mar 30, 2023

We build out a customer journey map because we have recognized that happy customers spend more with businesses they prefer. Let's talk!

The Upsell and Cross-Sell — Tuesday CX Thoughts

Mar 28, 2023

Other categories

  • Academic
  • Academic Research
  • Academic Research
  • Artificial Intelligence
  • Assessments
  • Audience
  • Brand Awareness
  • Brand Awareness
  • Branding
  • Business
  • Business
  • Case Studies
  • Communities
  • Consumer Insights
  • Consumer Insights
  • Customer effort score
  • Customer Engagement
  • Customer Experience
  • Customer Experience IN
  • Customer Loyalty
  • Customer Loyalty
  • Customer Research
  • Customer Satisfaction
  • Customer Satisfaction
  • CX
  • Decision Making
  • Employee Benefits
  • Employee Engagement
  • Employee Engagement
  • Employee Engagement
  • Employee Retention
  • Employee Retention
  • Employee Retention
  • Employee Retention
  • Enterprise
  • Events
  • Forms
  • Friday Five
  • General Data Protection Regulation
  • Guest Post
  • Insights Hub
  • Intercept
  • klantervaring
  • Life@QuestionPro
  • LivePolls
  • Market Research
  • Market Research
  • Marketing
  • Marketing
  • Marktonderzoek
  • medewerkersonderzoek
  • Mercadotecnia
  • Mobile
  • Mobile
  • Mobile App
  • Mobile diaries
  • Mobile Surveys
  • New Features
  • non-profit
  • NPS
  • Online Communities
  • Polls
  • Question Types
  • Questionnaire
  • QuestionPro
  • QuestionPro Products
  • QuestionPro Products
  • Release Notes
  • Research
  • Research Tools and Apps
  • Revenue at Risk
  • Startups
  • Survey Templates
  • Surveys
  • Surveys
  • Tech News
  • Tech News
  • Tips
  • Training
  • Training Tips
  • Trending
  • Uncategorized
  • Video Learning Series
  • VOC
  • Webinar
  • Webinars
  • What’s Coming Up
  • Workforce
  • Workforce
  • Workforce
  • Workforce
  • Workforce Intelligence
  • Workforce Intelligence
  • Workforce Intelligence

questionpro-logo-nw
Help center Live Chat SIGN UP FREE
  • Sample questions
  • Sample reports
  • Survey logic
  • Branding
  • Integrations
  • Professional services
  • Security
  • Survey Software
  • Customer Experience
  • Workforce
  • Communities
  • Audience
  • Polls Explore the QuestionPro Poll Software - The World's leading Online Poll Maker & Creator. Create online polls, distribute them using email and multiple other options and start analyzing poll results.
  • Research Edition
  • LivePolls
  • InsightsHub
  • Blog
  • Articles
  • eBooks
  • Survey Templates
  • Case Studies
  • Training
  • Webinars
  • Coronavirus Resources
  • All Plans
  • Nonprofit
  • Academic
  • Qualtrics Alternative Explore the list of features that QuestionPro has compared to Qualtrics and learn how you can get more, for less.
  • SurveyMonkey Alternative
  • VisionCritical Alternative
  • Medallia Alternative
  • Likert Scale Complete Likert Scale Questions, Examples and Surveys for 5, 7 and 9 point scales. Learn everything about Likert Scale with corresponding example for each question and survey demonstrations.
  • Conjoint Analysis
  • Net Promoter Score (NPS) Learn everything about Net Promoter Score (NPS) and the Net Promoter Question. Get a clear view on the universal Net Promoter Score Formula, how to undertake Net Promoter Score Calculation followed by a simple Net Promoter Score Example.
  • Offline Surveys
  • Customer Satisfaction Surveys
  • Employee Survey Software Employee survey software & tool to create, send and analyze employee surveys. Get real-time analysis for employee satisfaction, engagement, work culture and map your employee experience from onboarding to exit!
  • Market Research Survey Software Real-time, automated and advanced market research survey software & tool to create surveys, collect data and analyze results for actionable market insights.
  • GDPR & EU Compliance
  • Employee Experience
  • Customer Journey
  • About us
  • Executive Team
  • In the news
  • Testimonials
  • Advisory Board
  • Careers
  • Brand
  • Media Kit
  • Contact Us

QuestionPro in your language

  • English
  • Español (Spanish)
  • Português (Portuguese (Brazil))
  • Nederlands (Dutch)
  • العربية (Arabic)
  • Français (French)
  • Italiano (Italian)
  • 日本語 (Japanese)
  • Türkçe (Turkish)
  • Svenska (Swedish)

Awards & certificates

  • survey-leader-asia-leader-2023
  • survey-leader-asiapacific-leader-2023
  • survey-leader-enterprise-leader-2023
  • survey-leader-europe-leader-2023
  • survey-leader-latinamerica-leader-2023
  • survey-leader-leader-2023
  • survey-leader-middleeast-leader-2023
  • survey-leader-mid-market-leader-2023
  • survey-leader-small-business-leader-2023
  • survey-leader-unitedkingdom-leader-2023
  • survey-momentumleader-leader-2023
  • bbb-acredited
The Experience Journal

Find innovative ideas about Experience Management from the experts

  • © 2022 QuestionPro Survey Software | +1 (800) 531 0228
  • Sitemap
  • Privacy Statement
  • Terms of Use