Correlation is a fundamental concept in statistics that helps us understand the relationship between two variables. One specific type of correlation, known as negative correlation, is particularly interesting because it tells us how two variables move in opposite directions.
In this blog post, we’ll explore what negative correlation is, provide some real-life examples, and explain how it works in a simple and easy-to-understand manner.
What is a Negative Correlation?
Negative correlation, also known as inverse correlation, occurs when two variables move in opposite directions. In other words, as one variable increases, the other variable decreases, and vice versa. The strength and direction of a correlation are measured by the correlation coefficient, which ranges from -1 to 1. A negative correlation coefficient (between -1 and 0) indicates a negative correlation.
Correlation Coefficient (r): This statistical measure ranges from -1 to 1.
- -1: Perfect negative correlation (as one variable increases, the other decreases in a perfectly linear fashion).
- 0: No correlation (no relationship between the variables).
- 1: Perfect positive correlation (as one variable increases, the other increases in a perfectly linear fashion).
A weak negative correlation exists when the Pearson correlation coefficient (denoted as r) is close to zero but negative, typically between -0.1 and -0.3. This indicates a slight inverse relationship between two variables, but one that is not strong enough to be highly predictive or significant in many cases.
Why is Important to Understand It?
Strong negative correlation is important for you for several reasons, spanning various fields such as finance, economics, healthcare, and everyday decision-making. Here’s why understanding the concept is essential for you:
It Allows to Make Informed Predictions
It allows you to make informed predictions about the behavior of one variable based on the movement of another. For example, if you know there’s a negative correlation between study time and the number of errors in an exam, increasing your study time can help reduce errors.
It helps in Risk Management in Finance
If you’re an investor, you can use it to diversify your portfolio. By including assets that move inversely to each other, you can reduce overall risk.
Understanding it also helps you develop hedging strategies to protect against potential losses. For example, if you hold a company’s stock that’s negatively correlated assets with commodity prices, you might hedge by investing in those commodities.
It Helps in Identifying Causal Relationships
Recognizing it helps you identify causal relationships in various fields. For instance, if your company notices a negative correlation between job satisfaction and turnover rates, you might focus on improving employee satisfaction to reduce turnover.
In healthcare, it can reveal important insights, such as:
- The relationship between increased physical activity and decreased incidence of certain diseases.
- Guiding public health policies and interventions that you might follow or promote.
It Improves Business Operations
If you run a business, you can use it to optimize operations. For example, if you find a negative correlation between production time and defect rates, investing in training or better equipment might help you reduce defects and improve efficiency. Understanding the negative correlation between factors such as price and demand can help you set optimal pricing strategies to maximize revenue.
It Enhance Your Scientific Research
Recognizing them helps you design better experiments and interpret results more accurately. For example, you might study the negative correlation between pollutant levels and biodiversity to understand environmental impacts.
Examples of Negative Correlation
Understanding these relationships is crucial across various fields. Here are some specific examples of negative correlations in research, education, and healthcare.
01. Research
Example: Study Time and Social Media Use
In academic research, a study might investigate the relationship between the amount of time students spend studying and their social media usage.
- Findings: The research could reveal a negative correlation between study time and social media use. As students spend more time on social media, their study time tends to decrease. Conversely, when students dedicate more time to studying, their social media usage often drops.
- Implications: Understanding this negative correlation helps researchers develop strategies to improve academic performance.
02. Education
Example: Class Size and Individual Student Performance
In the field of education, researchers might explore the relationship between class size and individual student performance.
- Findings: Studies often find a negative correlation between class size and student performance. As class size increases, individual student performance tends to decrease due to factors like reduced teacher attention and increased classroom distractions.
- Implications: This negative correlation supports policies aimed at reducing class sizes to enhance student outcomes. Schools and educational policymakers can use this information to allocate resources more effectively.
03. Healthcare
Example: Physical Activity and Risk of Chronic Diseases
In healthcare research, scientists frequently examine the relationship between physical activity levels and the risk of developing chronic diseases such as heart disease, diabetes, and hypertension.
- Findings: There is a well-documented negative correlation between physical activity and the risk of chronic diseases. As physical activity levels increase, the risk of developing chronic diseases decreases. Conversely, lower levels of physical activity are associated with a higher risk of chronic conditions.
- Implications: Healthcare professionals and policymakers use this negative correlation to advocate for regular physical activity as a preventive measure against chronic diseases. Public health campaigns and interventions are designed to encourage more active lifestyles.
Curious to learn about correlation matrix? QuestionPro recently published a blog aboutt it. Explore to learn about it.
How to Identify It
To determine if your variables exhibit a negative correlation, follow these steps:
1. Identify Your Two Variables
First, specify the two variables you want to examine. These variables are the data sets you aim to measure the relationship between. For negative correlation, these two variables are likely to move in opposite directions. Remember that correlation does not imply causation. A negative correlation between variables does not necessarily mean one variable causes a change in the other.
2. Choose Your Method for Finding the Correlation
There are several methods to calculate correlation:
Use a Formula
You can calculate the correlation using the formula:
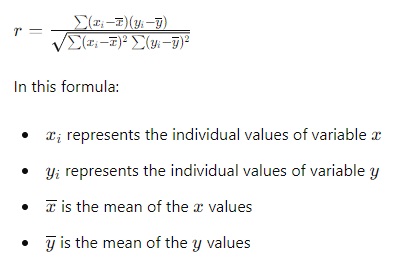
Use a Correlation Coefficient Calculator
Online correlation coefficient calculators can save time and reduce the risk of errors, especially with large datasets. Ensure your inputs are accurate for reliable results.
Create a Scatter Plot
A scatter plot visually represents the correlation between two variables. Plot your data points along the x and y axes to observe the relationship. A line that slants downward from left to right indicates a negative correlation.
3. Calculate the Correlation
After selecting a method, calculate the correlation using your datasets. Here’s what to expect from different methods:
- Formula or Calculator: Your result will be a correlation coefficient (r) ranging from -1 to 1. A value closer to -1 indicates a strong negative correlation.
- Scatter Plot: A downward-sloping line on the scatter plot signifies a negative correlation.
By following these steps, you can determine if there is a negative correlation between your variables and understand the nature of their relationship.
Negative vs Positive Correlation: Understanding the Differences
Let’s explore the differences between negative and positive correlation, as well as their characteristics, examples, and implications.
Positive Correlation
Positive correlation exists when two variables tend to increase or decrease together, i.e., as one variable increases, the other also tends to increase. Conversely, as one variable decreases, the other tends to decrease.
Characteristics:
- Direction: Both variables move in the same direction.
- Correlation Coefficient: 𝑟 is positive, ranging from 0 to +1.
Example:
- Income and Spending: Generally, as income increases, spending also tends to increase. This positive relationship is crucial for understanding consumer behavior and economic trends.
- Temperature and Ice Cream Sales: Warmer temperatures usually lead to higher ice cream sales, demonstrating a positive correlation between these variables.
Implications:
- Positive correlation helps predict trends and patterns in data.
- Useful in forecasting and decision-making in fields like finance, marketing, and climate analysis.
Negative Correlation
It occurs when one variable increases while the other decreases, and vice versa. In other words, as one variable goes up, the other tends to go down.
Characteristics:
- Direction: Variables move in opposite directions.
- Correlation Coefficient: 𝑟 is negative, ranging from -1 to 0.
Example:
- Exercise and Weight: Generally, as the amount of exercise increases, weight tends to decrease. This negative relationship is important in health and fitness studies.
- Price and Demand: Higher prices usually lead to lower demand for a product, illustrating a negative correlation in economics.
Implications:
- Negative correlation helps understand trade-offs and inverse relationships.
- Crucial for optimizing decisions in fields like economics, supply chain management, and healthcare.
How QuestionPro Can Help in Correlation Analysis?
QuestionPro, a robust survey platform, offers comprehensive tools to facilitate correlation analysis effectively. Here’s how QuestionPro can help you in conducting correlation analysis:
Effortless Data Collection
QuestionPro simplifies the data collection process through its user-friendly survey creation tools. You can design and distribute surveys to gather quantitative data on various variables of interest. The platform supports various question types, allowing you to capture detailed and relevant data efficiently.
Automated Data Analysis
Once the data is collected, QuestionPro provides built-in analytics tools for correlation analysis. You can easily calculate correlations, which measure the strength and direction of the linear relationship between two variables. The correlation coefficient ranges from -1 to 1, where:
- 1 indicates a perfect positive correlation.
- -1 indicates a perfect negative correlation.
- 0 indicates no correlation.
Visual Representation
QuestionPro offers visualization tools to help you interpret the results of your correlation analysis. Scatter plots and correlation matrices can be generated to provide a clear graphical representation of the relationships between variables. This visual aid is crucial for quickly identifying trends and patterns.
Identifying Patterns and Trends
Using QuestionPro’s correlation analysis, researchers observed correlation ( positive, negative, or zero) between variables:
- Positive Correlation: Both variables move in the same direction. For example, increased advertising spending may correlate with increased sales.
- Negative Correlation: The variables tend to move in opposite directions. For example, increased screen time might correlate with decreased academic performance.
- Zero Correlation: No relationship exists between the variables. For example, the number of years in school might not correlate with the number of letters in a person’s name.
Practical Applications
Correlation analysis in QuestionPro can be used for various practical applications, such as:
- Market Research: Measure the effectiveness of marketing campaigns by correlating advertising spending with sales performance.
- Healthcare: Assess the relationship between medication usage and patient outcomes, such as blood pressure levels.
- Education: Determine the impact of study habits on academic performance by correlating hours studied with grades.
Conclusion
Negative correlation is a valuable concept that reveals how two variables interact inversely. By understanding and identifying negative correlations, we can make better predictions, manage risks more effectively, and solve problems more efficiently.
QuestionPro streamlines the process of correlation analysis, from data collection to interpretation. By leveraging its powerful tools, researchers and marketers can uncover valuable insights into the relationships between variables, driving better decisions and strategies in their respective fields. So, contact QuestionPro today to start your correlation analysis!