Have you calculated the impact of NPS on revenue? Do you know the difference between NPS and revenue weighted NPS? If not, read on to find out how you can connect NPS and revenue, and grow your business.
We all know that higher NPS scores mean higher loyalty, and higher loyalty means increased profits. However, most companies are still using a one-size-fits-all approach when it comes to valuing their customers. This could mean that the happiest and highest spenders are treated equally to dissatisfied, low spenders.
In this blog, I’m introducing the Revenue Weighted NPS model to tie in customer loyalty with revenue which takes into account the “weight” or revenue of each customer as it pertains to satisfaction and loyalty.
Net Promoter Score – An Introduction
Ah, Net Promoter Score. You have heard of it, and you probably understand the importance of customer loyalty. The NPS system is a measure of customer loyalty that correlates to a business’s profitability. Most companies measure NPS through NPS surveys, asking customers right after a recent transaction via a survey. However, very few companies actually take into account the different customer profiles when reporting NPS. In my experience with modeling, companies are losing out on a huge opportunity when they don’t leverage the power of weighted NPS.
Here’s an example:
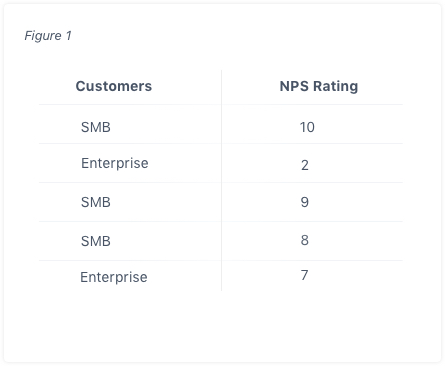
Now, let’s calculate NPS: % of Promoter customers minus % of your detractor customers.
Drawn from the numbers in Figure 1, you get the following:
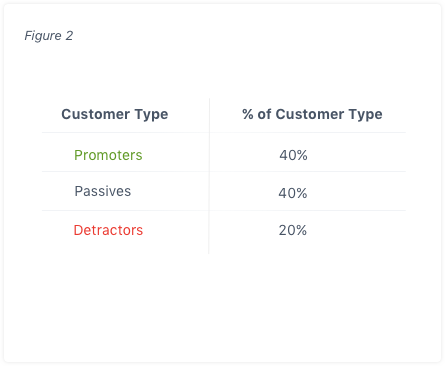
(Note: the NPS is always a measurement valued between -100 and +100)
Calculating Customer Lifetime Value into NPS
Now, let’s bring in actual revenue. Let’s propose that the Lifetime Value of an Enterprise Customer is 4x higher than the value of a SMB Customer.
Let’s take the Customer Lifetime Values for Enterprise vs. SMB: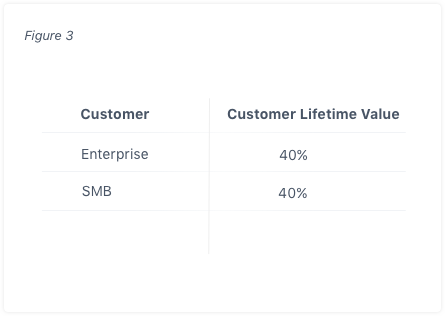
What if I told you that the absolute numbers ($8,000 and $2,000) don’t matter? Would you agree?
What the traditional model doesn’t take into consideration is that your Enterprise customer is 4X more valuable than the SMB customer, monetarily speaking. Now this metric in this example we are using is revenue, but as you can imagine, you can replace the revenue with any monetary metric, for example, profit margins.
What is revenue weighted NPS?
Now, let’s take into account the same NPS Score calculation, but using Customer LTV as an example. In the above example (Figure 1), we have two SMB promoters and one Enterprise detractor. Without taking LTV and the type of Customer into consideration, one would assume that approximately 40% are Promoters and 20% are Detractors. From a pure business and economics perspective, this assumption is flawed. Why? Since we are focused on the $4,000 value of Promoters, we run the risk of losing double the amount ($8,000) if we don’t hone in on understanding the value of different customer types.
To mitigate loss, we can “weigh” the Net Promoter scores based on LTV of each Customer Tier:
Calculating the Revenue Weighted NPS
In our above sample dataset, we have two Promoters with a cumulative revenue of $4,000 (2x$2000). The cumulative revenue above totals $22,000. This number is derived from adding our three SMB customers and two Enterprise customers together (3 x $2,000 + 2 x $8,000)
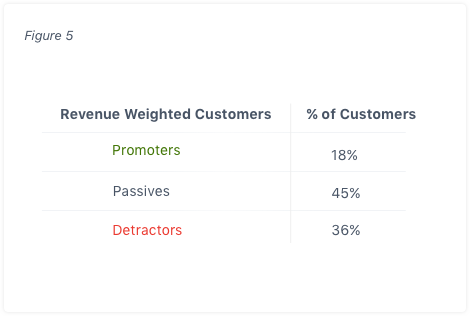
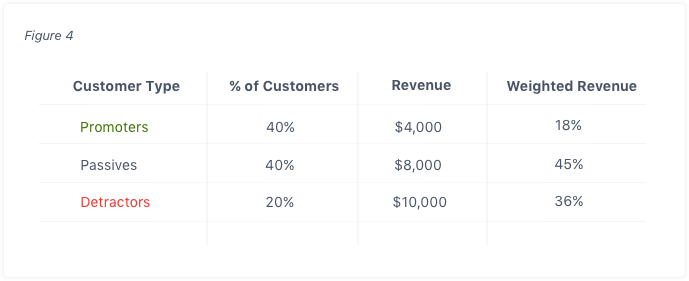
To weigh the revenue between Promoters, Passives, and Detractors, you take the total Promoter, Passive, and Detractor value and divide that by your cumulative revenue. Each of these will yield a percentage: 18%, 45%, and 36% respectively.
Gain customer insights with weighted NPS
Let us consider Figure 4 for a moment. The customer lifetime value (CLV) is $4,000 for all customers. This information, when segmented, can give us better customer insights. Imagine that customers in city A spend more than customers in city B, let us assume $8,000 and $2,000. Even if two of the five sampled customers are from city A, when it comes to LTV, they account for $16,000, more than 50% of the business. Once you consider this data, it looks that the brand is not doing well amongst its most important customer segment. Let us now re-calculate NPS based on the weighted revenue data. Our new NPS now becomes -18. When NPS becomes weighted, it becomes evident the brand could lose over 70% of its revenue if passives and detractors are not addressed.
NPS vs. Revenue Weighted NPS Score
To calculate our new Revenue Weighted NPS, we take our new percentage of Promoters, 18% and subtract that from our new percentage of Detractors, 36%. Our new Revenue Weighted NPS is -18.
Compared to our Non-Revenue, traditional NPS score of +20, our new NPS becomes -18 when we add revenue weight to the NPS. Without this insight, most companies will continue to make decisions that are directly orthogonal to growth.
Using margins and profit in NPS
In the Revenue Weighted NPS example above, we used revenue as a metric to anchor and weigh the NPS. Companies in their lifecycle are generally interested in only two broad financial metrics, the Top Line and Bottom Line, synonymous to Revenue and Profit.
LEARN ABOUT: Customer Lifecycle
If your metric is based on profit, you can simply replace the model with your profit numbers. Rather than using the Lifetime Customer Values, use your Customer Gross Margin numbers for each Enterprise or SMB Customer.
NPS assumptions risk losing revenue
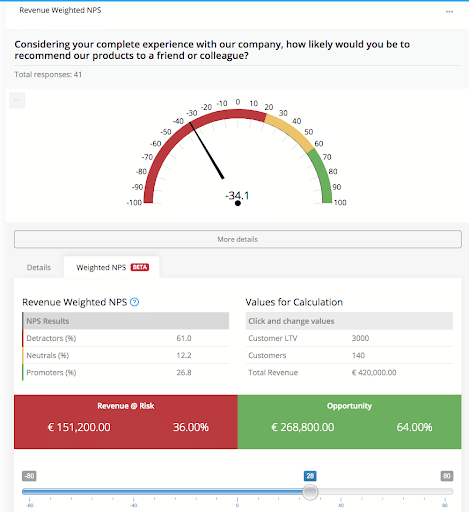
The NPS model assumes that all your detractors are at risk of leaving you for your competition. If you measure this with the revenue weighted NPS model, you can assign a clear dollar value of that risk. From above, we calculated the revenue at risk to be $8,000. This additional insight will help you prioritize your efforts and understand the impact.
Assigning values to each type of customer is critical to understanding and mitigating risk. After you have calculated and weighed your NPS, the next step is to figure out how to prioritize your actions. How do you know which interactions had the highest or lowest impact on the overall experience of all your customers? To help you answer these questions, QuestionPro CX offers an NPS Key Driver Analysis feature that will help you determine which attitudes and interactions have the biggest effect on your overall NPS. Like most people, you have limited time and resources. If you’re given a week to fix your top two priorities, it is critical that you know which determinants or variables will yield you the biggest return.
Importance and benefits of revenue weighted NPS
We now know the implications of calculating your customer revenue with NPS. Let us quickly look at two significant benefits of the revenue weighted Net Promoter Score.
- Determine the financial impact of CX
It is not only about knowing your promoters, detractors, or passives; it also about the impact these three categories have on your business. You may have a lot of promoters, but if your detractors hold a significant percentage of your business, you will have some serious future revenue concerns.
- Estimate opportunities and risk
Getting more information around your revenue is always great in making future plans. With this information, you can estimate risk and opportunities and act accordingly. Your teams and departments can get a clear idea and focus to concentrate their efforts on detractors or passives. For long, brands have focused on promoters; it is time to add in the revenue variable and revisit the equation.
- Go beyond traditional NPS score
Based on your survey responses, you calculate your NPS score. Like any other customer satisfaction survey, the response rate for your product or service can be high or low; many of your promoters, detractors, or passives may not respond to your surveys. Assigning revenue to your NPS paints a much bigger picture that helps you go beyond your traditional NPS score and make plans that look further into the future and the implications it will have on the brand.
Using NPS to stimulate organizational transformation
Once we calculate the NPS for a company, we can identify the detractors and know that they are a considerable customer churn risk. Identifying customers that bring in more value makes it easy to plan and execute outreach to them. Using NPS Key Driver Analysis, you can identify the interactions and customer attitudes that significantly impact your NPS. Knowing these helps in planning and acting for quick turnaround and maximum gains. You can sign-up to see how QuestionPro’s CX management platform can improve your NPS score by bringing about effective organizational changes.
Impact of revenue and operational metrics on NPS
If you want to increase revenue and/or profitability, you must provide the appropriate tools and the underlying model that will help you increase revenue and profitability. As Peter Drucker once said, “If you can’t measure it, you can’t manage it.” Because NPS is generally seen as a specific profession’s metric, using the Revenue Weighted NPS will align the company, from executives to front-line employees. If you are someone who believes in customer experience, you can use the Revenue Weighted NPS to pitch internally to your management team and explain the revenue drivers using this NPS model.
Interested in hearing more about how we calculate NPS based on Weighted Revenue? Discover more about how to delight your customer at every touchpoint and turn them into brand advocates.