


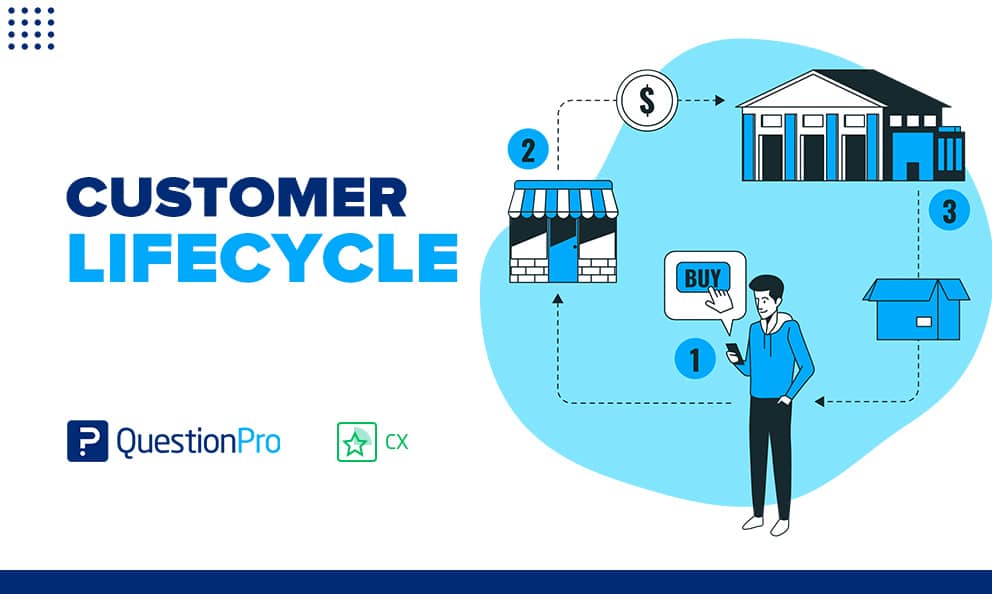
The customer lifecycle is the full series of stages a person moves through with your brand, from first hearing about you to buying, staying, and recommending you to others. Understanding it shows where customers join, where they stall, and where they leave.
Most teams track the first sale and lose sight of what follows. That gap is costly, because keeping a customer usually costs less than winning a new one.
In this guide, we’ll cover the definition, the six stages, metrics with formulas, examples, and a step-by-step plan for managing each stage.
What is the customer lifecycle?
The customer lifecycle is the sequence of stages a customer passes through, from first awareness of a brand to long-term loyalty or departure. It describes the relationship from the company’s point of view and shows which stage each customer sits in at any moment.
Think of it as a map of the relationship, not a straight line. Customers can skip stages, stall, or loop back. A loyal buyer who discovers a competitor, for example, can slide back to comparing options.
Customer lifecycle management (CLM) is the practice of tracking and improving each stage to raise retention and customer lifetime value. A touchpoint is any moment a customer interacts with your brand, such as an ad, a support chat, or a billing email. Every stage contains many touchpoints.
The customer lifecycle and the customer journey are related but not the same. The lifecycle organizes the relationship by stage, for strategy and reporting. The customer journey maps the steps and feelings a customer has while pursuing one goal.
Several other terms get mixed up with both. The table separates them.
| Term | What it describes | Perspective | Typical use |
|---|---|---|---|
| Customer lifecycle | Stages from awareness to advocacy | Company | Strategy, segmentation, reporting |
| Customer journey | Steps, emotions, and touchpoints toward a goal | Customer | Experience design, friction removal |
| Sales funnel | The path from lead to purchase only | Company | Pipeline and conversion tracking |
| Customer lifecycle management | The practice of managing every stage | Company | Ownership, programs, metrics |
| CRM (customer relationship management) | Software that stores customer data | Company | System of record |
| Product lifecycle | Product stages: launch, growth, maturity, decline | Product | Portfolio planning |
Use the first two together. Lifecycle stages organize your strategy, and journey maps refine the experience inside each stage.
What are the 6 stages of the customer lifecycle?
The six stages are awareness, engagement, evaluation, purchase, retention, and loyalty and advocacy. Frameworks vary, and some use five or seven stages. These six cover the full relationship and give each team a clear job.
Stage 1: Awareness
The customer learns your brand exists, often through search, social media, advertising, or a friend’s recommendation. They have a need but may not link it to you yet.
- Metrics: Website traffic, impressions, branded search volume
- Typical tactic: Educational content that answers early questions without a sales pitch
Stage 2: Engagement
The customer connects their need to your brand and starts interacting. They join an email list, start a free trial, follow you on social media, or talk to sales.
Not all engagement signals the same intent. A pricing page visit shows more buying interest than a blog read, so score them differently.
- Metrics: Email signups, click-through rate (CTR, clicks divided by impressions), lead generation
- Typical tactic: Nurture emails matched to the topic the prospect explored
Stage 3: Evaluation
The customer compares options. They read reviews, watch demos, request quotes, and ask questions. This is the stage where trust is built or lost.
- Metrics: Demo requests, product page views, add-to-cart rate
- Typical tactic: Comparison pages, case studies, and fast answers from sales or chat
Stage 4: Purchase
The customer buys. Your focus shifts from persuading to making the transaction easy and learning what tipped the decision. A one-question survey after checkout, such as “What made you choose us today?”, captures that reason while it is fresh.
- Metrics: Conversion rate, average order value (AOV), cart abandonment, customer acquisition cost (CAC, the total cost of winning one customer)
- Typical tactic: Simple checkout and a clear confirmation message with next steps
Stage 5: Retention
Retention covers the product and support experience after the sale. Satisfaction here decides whether the customer stays, buys again, or quietly leaves.
Strong customer retention strategies start with onboarding, which teaches customers to get value fast. Add a closed-loop feedback process, so every complaint gets a response and a fix.
- Metrics: Retention rate, churn rate, customer satisfaction score (CSAT), repeat purchase rate
- Typical tactic: Onboarding sequences, proactive support, and follow-up after issues
Stage 6: Loyalty and advocacy
Loyal customers buy more, forgive small mistakes, and recommend you to others. Advocates go further and bring in new customers through reviews, referrals, and word of mouth.
That recommendation feeds the awareness stage for someone else. It is the point where the lifecycle becomes a loop.
- Metrics: Net Promoter Score (NPS), referral count, review volume, customer lifetime value (CLV)
- Typical tactic: Referral rewards, early access, and public recognition for advocates
How do customers move between lifecycle stages?
Customers move between stages in both directions, and many never follow the order on paper. Treat the six stages as states a customer can enter, leave, and re-enter.
Four movement patterns show up most often:
- Skipping: A buyer referred by a friend goes from awareness straight to purchase.
- Stalling: A trial user who never finishes setup stays in engagement indefinitely.
- Regressing: A loyal customer who hits repeated billing errors drops back to evaluating alternatives.
- Looping: A happy customer’s review pulls a new prospect into awareness.
Tracking these moves matters more than counting customers per stage. A stage count is a snapshot, and transitions show the trend.
Customer lifecycle examples
Examples show how the same six stages look different across business models. The scenarios below are illustrative, not data from real companies.
Example 1: A US meal kit subscription
A meal kit brand moves a shopper through every stage in a few weeks.
- Awareness: A social media ad shows a quick weeknight dinner.
- Engagement and evaluation: The shopper reads reviews and claims a first-box discount.
- Purchase: The first box ships.
- Retention: Flexible skip-a-week options and a short cancellation survey reduce churn.
- Loyalty: Referral credits turn happy subscribers into advocates.
Example 2: A B2B software company
A software company sells to a team, not one person. Awareness comes from industry content, and evaluation runs for months with several decision-makers. The sales team hands the account to customer success at purchase, and that handoff is where many accounts get lost. Renewal is the real retention test. Advocacy appears when a champion inside the customer refers peers or speaks at a user event.
Example 3: A regional US bank
A bank treats the early weeks after account opening as its critical retention window.
- Evaluation: The customer compares fees and branch access.
- Purchase: The customer opens a checking account.
- Retention: The bank prompts direct deposit setup and bill pay, because customers who use the account daily rarely leave.
- Loyalty: The customer adds a mortgage and refers family members.
Why does the customer lifecycle matter?
Understanding the lifecycle matters because it shows where revenue is won and lost. Retention is the clearest example.
Harvard Business Review reports that acquiring a new customer can cost five to 25 times more than retaining an existing one, depending on the industry. The same article cites Bain & Company research linking a 5% rise in retention to profit increases of 25% to 95%.
Beyond cost, tracking the lifecycle gives you several practical advantages:
- Better relationships: You act on what each customer needs at their stage.
- Faster response to needs: Stage signals tell you when to offer help or an upgrade.
- Stronger service: Support teams see the full history before they reply.
- More engaged employees: Teams see how their work affects customers.
- Higher profitability: Loyal customers spend more and cost less to serve.
- A cleaner customer database: Stage tags make segmentation accurate.
- Lower churn: You spot at-risk customers before they leave.
Which metrics track each customer lifecycle stage?
Each stage needs its own metrics, because one overall satisfaction number hides where the relationship breaks. Pick one or two per stage rather than tracking everything.
| Stage | Metrics to track | Warning sign |
|---|---|---|
| Awareness | Traffic, impressions, branded search | Impressions rise but branded search stays flat |
| Engagement | Signups, CTR, lead generation | Many clicks, few signups |
| Evaluation | Demo requests, product page views, add-to-cart rate | Many page views, few demo requests |
| Purchase | Conversion rate, AOV, CAC, cart abandonment | CAC rises while conversion falls |
| Retention | Retention rate, churn rate, CSAT, repeat purchase rate | Support tickets rise as usage falls |
| Loyalty and advocacy | NPS, referrals, review volume, CLV | Many passives, few promoters |
A customer health score combines several of these signals into one number per account. It works as an early alert for accounts drifting toward churn.
How do you calculate the core customer lifecycle metrics?
Five formulas cover most lifecycle reporting. The numbers below are illustrative.
- Customer retention rate: ((Customers at end − new customers) ÷ customers at start) × 100. With 500 customers at the start, 540 at the end, and 80 new, retention is 92%. Our retention rate guide covers common calculation mistakes.
- Churn rate: 100% minus retention rate. It is the share of customers who leave in a period. A 92% retention rate means 8% churn.
- Customer lifetime value (CLV): Average order value × purchases per year × years as a customer. At $60 × 5 × 3, CLV is $900.
- CSAT: Satisfied responses (4 or 5 on a 5-point scale) ÷ total responses × 100. With 180 of 240 satisfied, CSAT is 75%.
- NPS: Percent of promoters (scores 9 to 10) minus percent of detractors (scores 0 to 6). With 50 promoters, 30 passives, and 20 detractors out of 100, NPS is 30.
Step-by-step guide to managing the customer lifecycle
Managing the lifecycle takes seven steps, from agreeing on stage definitions to reviewing results every quarter. Start small and refine as you learn.
- Define each stage.
Write entry and exit rules, such as “evaluation begins when a lead requests a demo.” - Map the touchpoints.
List every interaction in each stage, including support and billing. - Assign owners.
Marketing, sales, and customer success each own stages and the handoffs between them. - Attach metrics.
Choose one or two measures per stage from the table above. - Segment customers.
Group people by stage and behavior, so a new buyer never receives a win-back offer. - Trigger actions.
Set automated messages or tasks for key moments, such as a welcome sequence after purchase or outreach when usage drops. - Review and adjust.
Check stage transitions every quarter and update your rules.
How does the customer lifecycle differ by business model?
The six stages stay the same across business models, but stage length and priorities change. Match your focus to how your customers buy.
- B2C ecommerce: Transactions are quick, so AOV and repeat purchase rate matter most. Seasonal peaks, such as the US holiday shopping season, bring many first-time buyers who need a clear path to a second purchase.
- Subscription: Retention dominates. Every renewal is a new buying decision, so onboarding gaps and billing failures drive churn more than price.
- B2B: Sales cycles run longer and involve several decision makers. The handoff from sales to customer success, and later renewal and expansion, decide the account’s value.
What are the most common customer lifecycle mistakes?
The most common mistake is measuring acquisition and ignoring everything after the sale. Several other failure patterns follow from the same short-term view.
- Treating the lifecycle as a straight line.
Customers skip, stall, and loop back, so rigid stage rules mislabel them. - Leaving handoffs unowned.
When no one owns the move from sales to support, new customers feel dropped. - Surveying on a calendar.
Asking everyone the same questions every quarter causes fatigue. Ask at stage events instead. - Ignoring quiet customers.
People who neither complain nor engage often churn without warning. - Sending one message to everyone.
A discount for a loyal customer and a welcome note for a prospect are different jobs.
Where should you focus first in the customer lifecycle?
Focus on the stage with the biggest drop to the next one, not the stage that feels weakest. Compare stage-to-stage conversion first, then match the pattern you see to the table.
| What you see | Likely problem | First move |
|---|---|---|
| Plenty of traffic, few signups | Awareness to engagement | Sharpen the offer and message |
| Demos requested, few purchases | Evaluation to purchase | Survey lost deals and add proof such as case studies |
| Strong sales, high early churn | Purchase to retention | Fix onboarding and expectation gaps |
| Steady retention, few referrals | Retention to loyalty | Ask promoters for referrals and fix issues raised by passives |
| Rising CAC, flat revenue | Whole lifecycle | Check retention before spending more on acquisition |
How can QuestionPro help you manage the customer lifecycle?
QuestionPro Customer Experience lets teams collect feedback at specific lifecycle stages and connect it to journey and score data. Each stage then has evidence behind it, not guesses.
Trigger surveys at lifecycle moments
Use survey software to send short surveys when a stage event happens. Timing matters more than volume.
- After purchase: One question on what drove the decision.
- After onboarding: A CSAT check on how setup went.
- After a support contact: A CSAT question on the resolution.
- Twice a year: A relationship NPS survey.
Map stages to touchpoints
A journey mapping tool lets you lay your lifecycle stages across the map and place NPS and CSAT scores on each one. The result shows where sentiment dips, so you fix the right touchpoint first.
Route feedback to owners
Scores matter only when someone acts on them.
- Detractor responses can alert the account owner for follow-up.
- Text and sentiment analysis summarizes open-ended comments.
- Dashboards show each stage’s scores in one view.
Treat the customer lifecycle as a loop, not a ladder
A ladder suggests customers climb once and stay at the top. Real customers move up, slip, leave, and return, and each move leaves a signal you can read.
The teams that manage the lifecycle well do a few simple things. They agree on stage definitions, measure the moves between stages, and respond to feedback quickly. Start with one stage, one metric, and one owner, then expand as the habit sticks.
Frequently Asked Questions (FAQs)
No single team owns it. Marketing usually leads awareness and engagement, sales handles evaluation and purchase, and customer success leads retention and loyalty. Name one executive sponsor and define handoffs so no customer falls between teams.
Survey at defined moments, not on a calendar. Send a short transactional survey after purchases and support contacts. Run a relationship survey such as NPS once or twice a year, so customers do not tire of requests.
No. The product lifecycle follows a product through introduction, growth, maturity, and decline. The customer lifecycle follows a person or account from awareness to loyalty. One product can serve customers at every lifecycle stage at the same time.
Yes. A customer who loves one product may still be evaluating another. Track the lifecycle per product or per account, not only per person, so cross-sell messages match the stage where each relationship actually stands.
Duration depends on price and complexity. Low-cost purchases can move from awareness to purchase in minutes, while enterprise software can take months. Measure your own median time per stage instead of relying on generic benchmarks.



