Every business faces challenges, whether it’s a sudden drop in sales, increasing customer complaints, or a slowdown in website traffic. When these issues arise, the big question is always, “Why is this happening?” Diagnostic analytics can help you explore your data to uncover the real reasons behind problems. Once you understand what’s causing the issue, you can make smarter, data-driven decisions to fix it.
But how exactly does it work? Let’s explore how diagnostic analytics can help you solve your business challenges.
What is Diagnostic Analytics?
Diagnostic analytics is all about figuring out why something happened. It goes a step further than just looking at what happened, as descriptive analytics does. So, if you’re looking at a problem or trend, diagnostic analytics helps you understand the reasons behind it.
For example, if a store noticed its sales went down last month, diagnostic analytics would help it understand why. Maybe it was due to a competitor running a big sale, or perhaps bad weather kept people from shopping.
It’s like being a detective. You use data to find out the cause of an event so you can solve problems or make better decisions in the future.
Benefits of Diagnostic Analytics
Diagnostic analytics offers several benefits that help businesses and organizations make better decisions and improve their performance. Here are some of the key advantages:
1. It Finds the Real Reason Behind Issues
Diagnostic analytics goes beyond just spotting that something went wrong. It helps you to explore the data to figure out why it happened.
For example, if a business notices a drop in customer satisfaction, diagnostic analytics can pinpoint whether it’s due to poor customer service, product quality issues, or something else. This way, you’re not just guessing at the cause but actually understanding it.
2. Improves Decision-Making
With clear insights into the causes of problems, businesses can make smarter, more informed decisions. Instead of trying random solutions, they can focus on the root cause.
3. Saves Money and Resources
By knowing exactly what needs to be fixed, diagnostic analytics prevents businesses from wasting time and money on ineffective solutions. Instead of fixing the wrong things or guessing, resources are directed toward addressing the real problem, leading to more efficient use of both time and money.
4. Helps Create Better Plans and Strategies
Knowing why things are happening in your business helps you develop stronger, more effective plans. For example, if you identify that customer complaints are due to delivery delays, you can develop a better supply chain strategy to fix the issue. This allows businesses to create strategies that actually address the problems at their core.
5. Prevents Future Problems
Once you understand what caused a past issue, you can take steps to make sure it doesn’t happen again. This helps businesses avoid repeating mistakes and continuously improve.
6. Increases Operational Efficiency
Diagnostic analytics helps identify areas where operations can be improved, whether it’s in customer service, inventory management, or marketing campaigns. This leads to smoother day-to-day operations and more efficient use of resources.
In short, diagnostic analytics helps businesses go beyond surface-level problems and gain a deep understanding of why things happen. This leads to better decision-making, cost savings, smarter strategies, and fewer future issues, all of which help a business grow and run more smoothly.
Learn More: How user behavior analytics track and analyze user interactions with systems and applications.
Types of Business Data Analytics
There are four main types of business analytics, each serving a different purpose. Let’s break them down in a simple way!
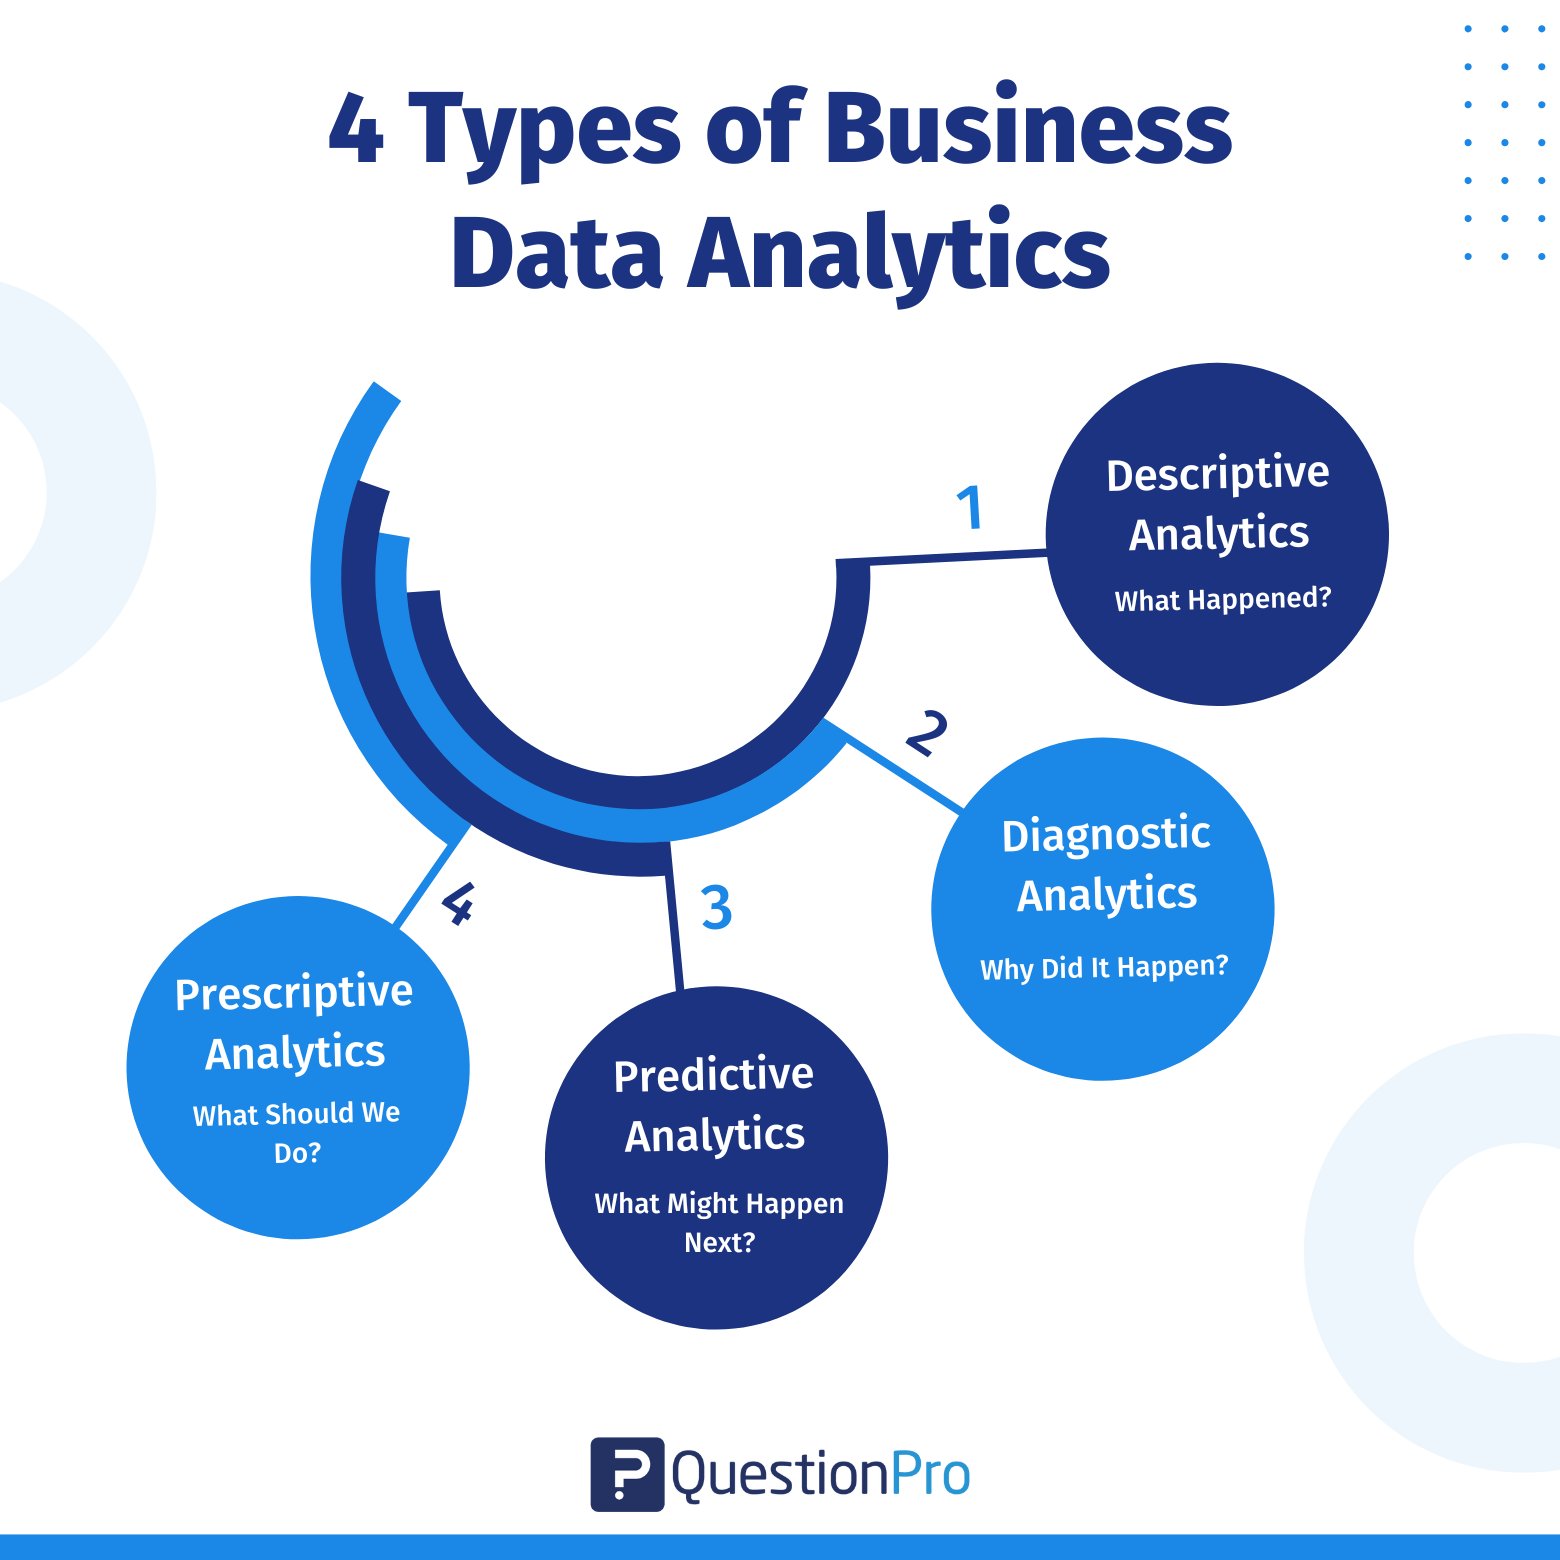
1. Descriptive Analytics: What Happened?
Descriptive analytics looks at past data to tell you what has already happened in your business. It’s like looking at a report card to understand past performance.
2. Diagnostic Analytics: Why Did It Happen?
Diagnostic analytics goes deeper to find out why something happened. It looks at patterns and relationships to uncover the reasons behind trends or problems.
3. Predictive Analytics: What Might Happen Next?
Predictive analytics uses past data and trends to forecast future events. It helps businesses prepare for what’s coming.
4. Prescriptive Analytics: What Should We Do?
Prescriptive analytics takes things one step further. It not only predicts what might happen but also suggests the best actions to take.
Learn More: How AI Analytics is reshaping the landscape of business analytics.
How to Use Diagnostic Analytics in Your Business?
Running a business means making tons of decisions every day. Some are small, while others can have a big impact. But how do you know if you’re making the right choices? Diagnostic analytics helps you figure out why things are happening so you can make smarter decisions and improve your business.
If you’re wondering how to get started with diagnostic analytics, here are simple diagnostic analytics techniques on how to use it effectively in your business.
1. Identify the Problem
Before conducting diagnostic analytics, you need to know what problem you’re trying to solve. Maybe your sales are down, or customers are complaining about your service. Whatever it is, pinpointing the issue is the first step. The clearer you are about the problem, the easier it will be to find the cause.
2. Collect Your Data
Once you’ve identified the problem, gather all the relevant data you have. This could be:
- Sales numbers
- Customer feedback
- Website Traffic
- Employee performance data
The more data you have, the better your data analysis will be. But make sure it’s relevant to the issue you’re trying to solve.
3. Look for Patterns
Next, it’s time to dig into your data and start looking for patterns. Diagnostic analytics often involves finding connections between different data points. You might notice that sales drop every time there’s a new competitor promotion or that customer complaints spike after a certain type of marketing campaign.
Looking for trends helps you connect the dots and start figuring out the why behind your problem.
4. Use Tools to Analyze the Data
There are many tools available that make analyzing data easier. Software like Excel, Google Analytics, or more advanced tools like Tableau and Power BI can help you visualize the data and spot patterns. You can also use statistical analysis or simple correlation analysis to find relationships between different variables.
If you’re not familiar with these tools, don’t worry—there are lots of online tutorials and courses that can help you get started.
5. Test Hypotheses
Once you have a clearer idea of the possible causes, test out your ideas. If you think the issue might be due to poor customer service, for example, you could try improving response times and see if customer satisfaction improves. Or, if you think a marketing campaign is turning customers off, consider tweaking it and measuring the results.
- Pro Tips: Testing helps confirm or eliminate potential causes, so you’re not just guessing.
6. Take Action
Now that you’ve identified the root cause, it’s time to take action. The whole point of diagnostic analytics is to make better decisions based on real data.
7. Monitor and Adjust
After taking action, it’s important to keep an eye on how things are going. Use your analytics tools to track the impact of the changes you made. If things improve, great! But if not, you might need to dig deeper and try something else.
Learn More: Google Analytics integration with your surveys.
Diagnostic Analytics Examples: How It Helps Different Industries?
Diagnostic analytics is all about figuring out why something happened. Businesses and organizations use it to analyze historical data and uncover the root causes of problems. Let’s look at how different industries use diagnostic analytics to improve their processes.
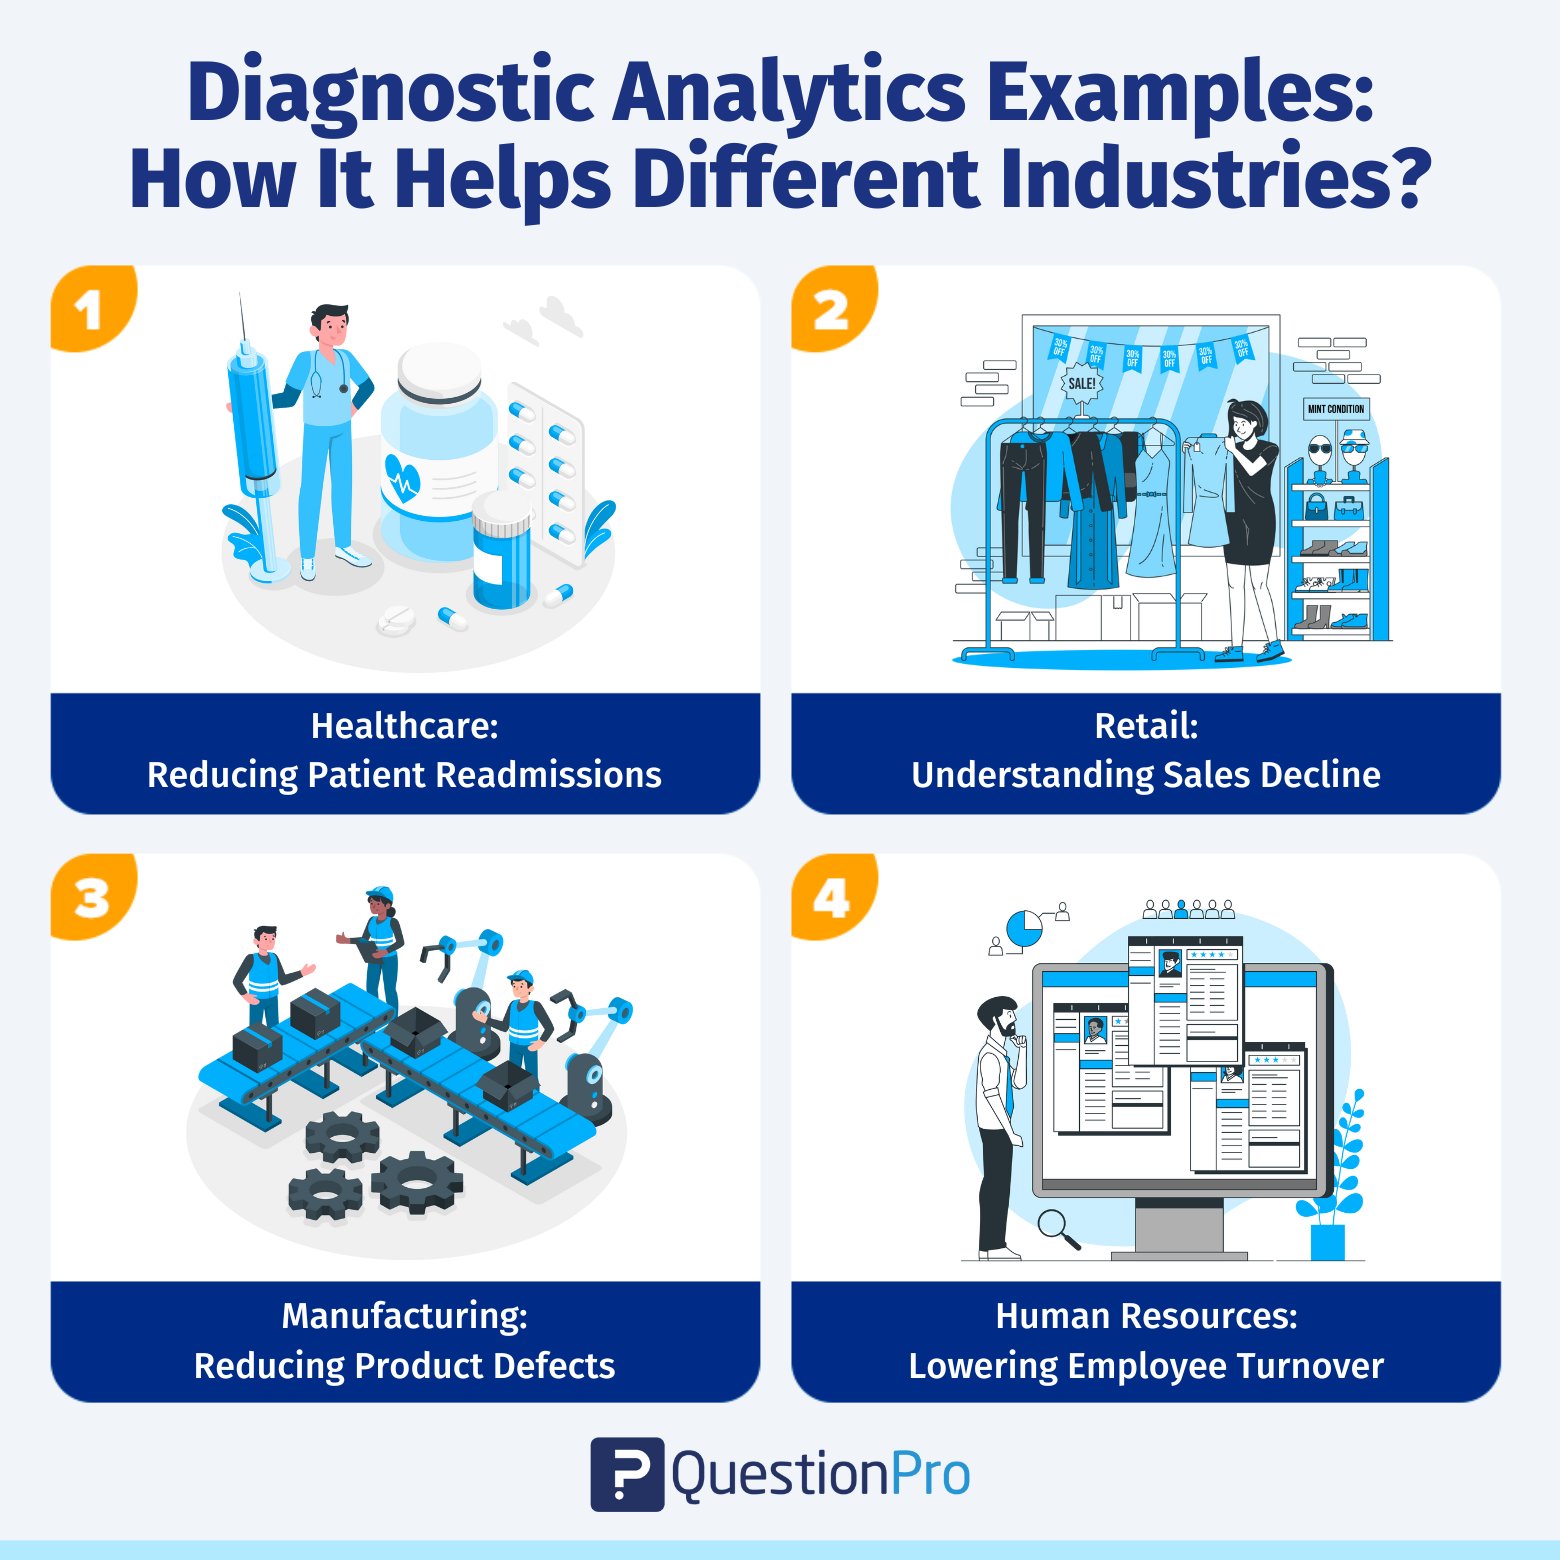
- Healthcare: Reducing Patient Readmissions
A hospital notices that many patients are being readmitted shortly after being discharged. To find out why, they analyze patient records, treatments, and follow-up appointments. The data reveals that patients who skipped their follow-up visits had a higher chance of being readmitted. Based on this insight, the hospital improves its patient follow-up system, leading to fewer readmissions.
- Retail: Understanding Sales Decline
A clothing store sees a drop in sales and wants to know why. They analyze customer shopping patterns, recent promotions, and competitor activity. The results show that a competing store launched a big discount campaign at the same time. To stay competitive, the store introduces its own limited-time offer, bringing customers back.
- Manufacturing: Reducing Product Defects
A factory notices an increase in defective products. To identify the cause, they analyze production data, machine performance, and employee shifts. The diagnostic analysis shows that one machine was malfunctioning during night shifts, leading to defects. After fixing the machine and training employees, defect rates go down, improving product quality.
- Human Resources: Lowering Employee Turnover
A company is losing employees faster than expected. They analyze exit interviews, employee surveys, and workload data to find out why. The data reveals that employees feel overworked and don’t see enough career growth opportunities. In response, the company adjusts workloads and creates new promotion paths, helping retain more employees.
Conclusion
In this blog, we’ve learned how diagnostic analytics can help businesses understand why problems are happening. Instead of guessing or trying random fixes, it helps you dig into your data to find the real cause behind issues like falling sales, unhappy customers, or drops in website traffic. Once you know what’s causing the problem, you can take smarter actions to fix it.
We also covered how to use diagnostic analytics in your business: identify the problem, gather the right data, look for patterns, test ideas, and take action. It’s all about making decisions based on real facts, not guesswork.
QuestionPro can make this process even easier. By gathering feedback through surveys, businesses can get the data they need to make better choices and solve problems more effectively. Contact QuestionPro for more information!
Frequently Asked Questions (FAQs)
Answer: In Google Analytics, diagnostic analytics helps you understand why changes occurred in metrics (e.g., traffic drops, conversion rate changes) by analyzing data trends, segments, and anomalies.
Answer: Diagnostic analytics is important because it helps businesses identify the root causes of problems, enabling data-driven decisions to improve performance.
Answer: Segmentation allows you to break down data into smaller groups (e.g., by demographics and behavior) to identify patterns and root causes more effectively.
Answer: Partially. Tools like Google Analytics and AI-driven platforms can automate data collection and anomaly detection, but human analysis is often needed for deeper insights.
Answer: Yes, diagnostic analytics can help analyze A/B test results by identifying why one variant performed better than the other.