
Let’s examine the Kano model, its background, the characteristics that make it effective, and the instances in which it may be used in this article.
Let’s examine the Kano model, its background, the characteristics that make it effective, and the instances in which it may be used in this article.
Together, the teams for marketing and products examine the data gathered in the form of models called priority frameworks. There are several models that organizations have adopted. The Kano model is one such example.
What is The KANO model?
The Kano Model, pronounced “Kah-no,” is a method for quality management in prioritizing features on a product roadmap based on how likely they are to please customers, as customers expect specific necessities to be met. To assess if adding a highly-rated item to the roadmap is a wise strategic move, product teams might compare its implementation costs with its use costs, considering how customers react.
The Kano model may give a detailed grasp of a customer’s demands as it delves into the intricacies of customer preferences. The voice of the customer table may be used to translate and modify the generated verbatims, recognizing that customers have distinct reactions to various features. Quality function deployment (QFD) House of Quality effectively utilizes this valuable input as a resource, ensuring customer expectations’ structured and effective fulfillment.
Specifically, the model has two dimensions:
- Achievement (the horizontal axis) ranges from the provider not doing it at all to the supplier performing it well.
- Satisfaction (the vertical axis) ranges from complete unhappiness with the product or service to complete satisfaction with the product or service.
Importance of KANO Model
The Kano Model holds significant importance in product development, marketing, and customer satisfaction management for several reasons:
- Customer-Centric Approach: The Kano Model places the customer at the center of decision-making, helping organizations understand and satisfy customers’ basic expectations, desires, and expectations more comprehensively. This approach enables them to tailor their offerings and conduct Kano analysis to prioritize features effectively.
- Product Innovation: It encourages organizations to think beyond basic requirements and develop features that can satisfy customers and, in some cases, even delight them, thus driving product innovation.
- Customer Retention: Meeting or exceeding expectations, particularly in the attractive and one-dimensional categories identified through Kano analysis, can enhance customer loyalty and reduce churn rates.
- Customer Segmentation: The Kano Model can assist in segmenting customers based on their preferences, allowing for targeted marketing and customized product offerings to satisfy diverse customer groups.
- Risk Mitigation: By identifying potential sources of customer dissatisfaction, including reverse needs through Kano analysis, the Kano Model helps mitigate the risk of product or service failures and negative customer experiences.
- Strategic Planning: It informs long-term strategic planning by aligning organizational objectives with customer expectations and market trends, aiming to satisfy customers and remain competitive.
The Kano Model is a valuable tool that empowers businesses to understand, prioritize, and meet customer needs effectively, leading to improved customer satisfaction, increased competitiveness, and sustained business success.
When to Use KANO Model
The Kano Model can be beneficial in various contexts and stages of product development, marketing, and satisfaction analysis. Here are some specific situations when you should consider using the Kano Model:
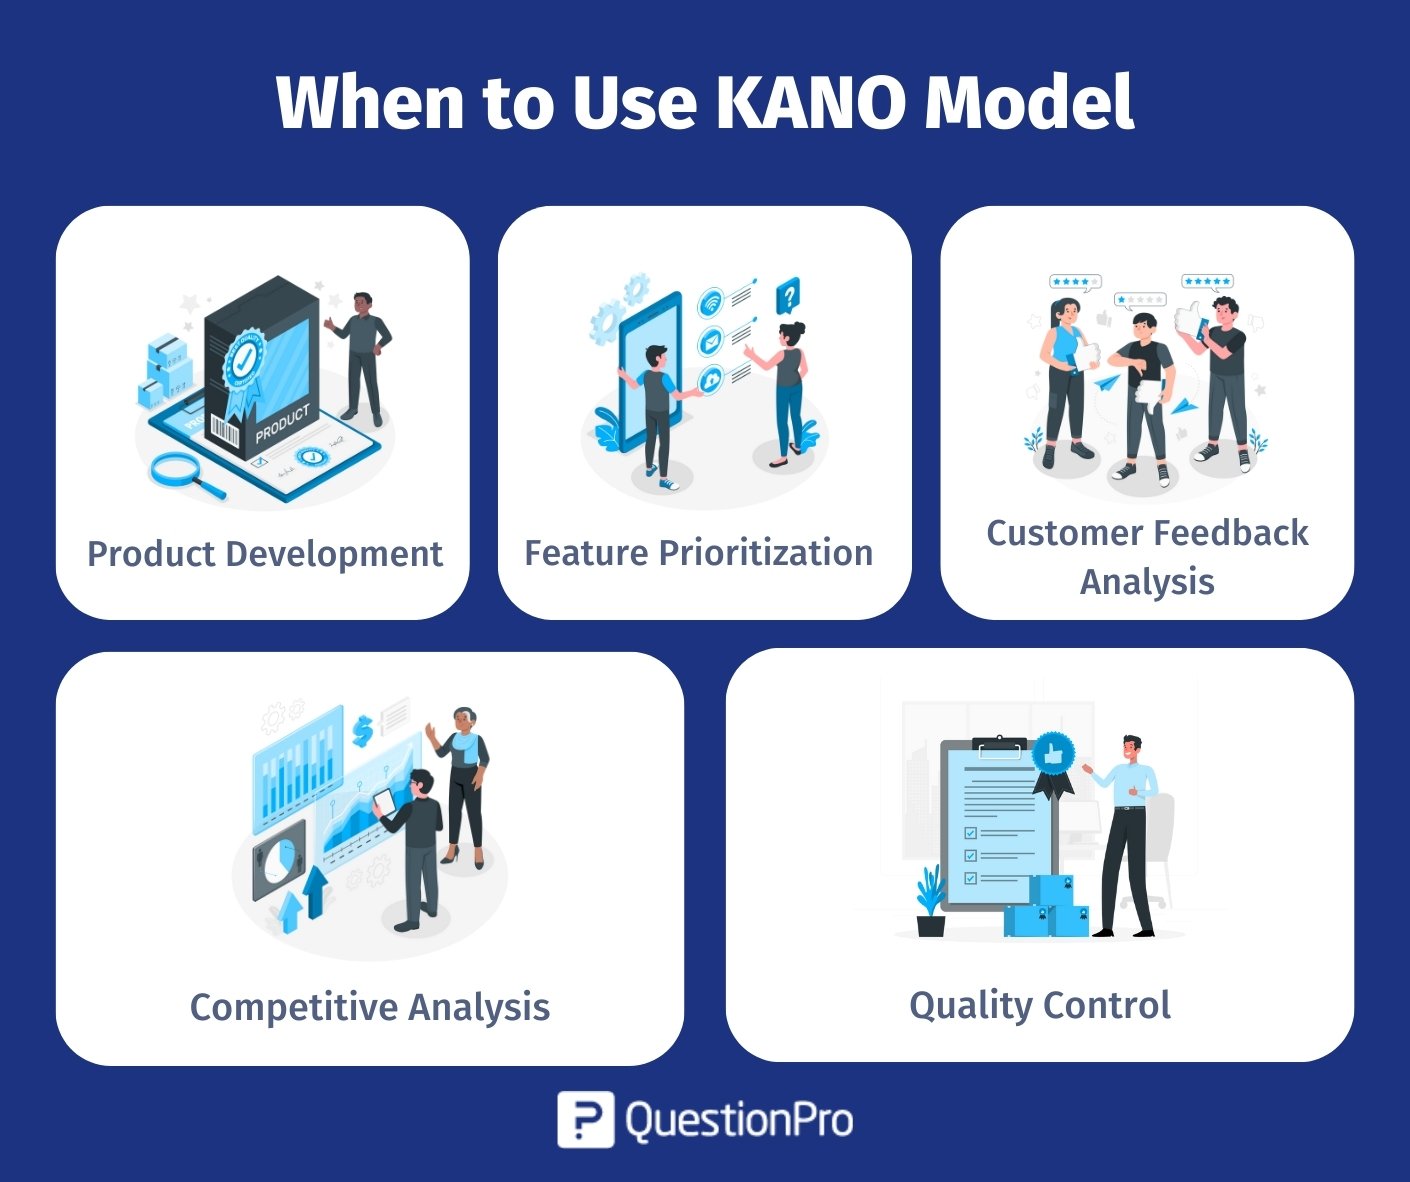
Product Development:
When you are in the early stages of designing a new product or service, use the Kano Model to understand which features to prioritize and how they will impact satisfaction.
Feature Prioritization:
When you need to prioritize features or attributes within an existing product or service, the Kano Model can help you determine which ones will significantly enhance customer satisfaction.
Customer Feedback Analysis:
If analyzing customer feedback or survey results, the Kano Model can help you categorize and prioritize customer comments and suggestions based on the five feature categories.
Competitive Analysis:
When you compare your product or service to competitors, the Kano Model can uncover opportunities for gaining a competitive edge by emphasizing appealing or overlooked features.
Quality Control:
When monitoring product quality and customer satisfaction, the Kano Model can help ensure that you consistently meet basic needs and avoid unintentionally introducing reverse needs.
Companies can apply the versatile Kano Model at various stages of product development and marketing strategy to gain insights into customer preferences, prioritize features, and drive customer loyalty and satisfaction.
Features of KANO Model with Examples
The Kano Model effectively categorizes features or attributes of a product or service into five distinct categories, considering their impact on customer satisfaction and how customers perceive them. Here are the five categories of the Kano Model, along with examples for each:
1.Must-Be Features (Basic Needs):
These are fundamental features that customers expect as a minimum requirement. Their absence leads to dissatisfaction, but their presence doesn’t necessarily increase satisfaction because customers take them for granted.
- Example: In a smartphone, must-be features include the ability to make calls, send text messages, and access the internet. Customers expect these functions to work reliably.
2.Performance Features (One-Dimensional):
These features or performance attributes have a direct and linear relationship with customer satisfaction. The better these features are, the more satisfied customers will be, and vice versa.
- Example: In a car, performance features encompass fuel efficiency, horsepower, and safety features. Customers compare and choose cars based on these factors.
3.Attractive Features (Excitement Needs):
These features, when present, unexpectedly delight customers, although their absence only occasionally leads to dissatisfaction.
- Example: In a hotel, an attractive feature might be a complimentary spa treatment or a personalized welcome gift for guests. These features can create a positive emotional response.
4.Indifferent Features (Indifferent Needs):
These are features that have little to no impact on customer satisfaction. Customers are generally neutral about them, and their presence or absence doesn’t significantly affect overall satisfaction.
- Example: In a restaurant, the color of the server’s uniform may be an indifferent feature. Most customers have a low preference for it.
5.Reverse Features (Reverse Needs):
These are features that, when present, can lead to customer dissatisfaction. These features may be counterproductive and should be avoided or carefully managed.
- Example: Excessive pop-up advertisements interrupting the user experience in a software application can be a reverse feature. Customers find them annoying and might even uninstall the software.
It’s crucial to recognize that the classification of features can evolve, with what was once seen as an attractive feature becoming a must-be feature as customer expectations change. Therefore, continuous customer feedback and market research are essential for effectively applying the Kano Model in product development and customer satisfaction management.
How The KANO Model Works
It’s time to discuss what it means to utilize the Kano model with numerous users and features now that we know how it works.
This section is based on several stories of practitioners and researchers using the Kano model, who have shared their experiences and key takeaways at each stage of the process:
- Selecting attributes and users for analysis;
- Obtaining the best information from clients;
- Analyze the outcomes.
Selecting Attributes and Users for Analysis
The first thing to consider is the breadth of your investigation regarding features and users.
Choosing Features
Choose features that provide substantial benefits to the user. Your backlog may comprise technical debt payment, a sales/marketing item, a reporting system, or a design refresh. Kano doesn’t cover these.
Although products are more significant, we can gauge customer contentment through external factors. Research conducted using Kano will be detrimental to your team, customers, and yourself if you need numbers to defend against not complying with a request from an internal stakeholder.
If you’re using volunteer participants, restrict the number of characteristics in your survey. It should boost participation and focus.
Selecting Customers
You must consider some demographic, logical cohort, or persona to which the consumers (or prospects) you choose to participate in your survey belong. If not, your data will probably be dispersed widely.
Your client or prospect base probably needs to be uniform, and neither will their opinions on your feature. But you may significantly lower the noise in your research if you consider a category to which they belong.
Obtaining The Best Information from Clients
The sole approach you used to contribute to the Kano research was the questionnaire and how you presented it. Therefore, make sure that this phase is as successful as possible.
Clarify Questions
It would help if you asked straightforward, concise questions. Each should represent one trait. If the feature is complicated, break the query down.
Your inquiries should focus on user advantages rather than product capabilities. How could you automatically enhance your photo?
Avoid polar question pairings. The dysfunctional question isn’t the Reverse of the functional one; it lacks functionality.
Instead of describing features, demonstrate them.
Better than asking direct questions is showing the consumer the functionality and how they feel about it.
Instead of a written query, you may offer a prototype, interactive wireframes, or mockups. The consumer may better grasp what’s being suggested with this visual and dynamic “explanation.”
If you inquire this way, ask for conventional answers after the user interacts with the feature prototype, like a detailed text query. It will help them remember your survey’s elements without confusing them.
Pay Attention to Phrases and Comprehension.
Some individuals are puzzled by Kano’s response order. “I like it that way” seems gentler than “It must be that way.”
The responses are ordered from pleasure to displeasure avoidance. Alternative word choices include:
- I like it that way.
- It will be a fundamental requirement.
- I’m unbiased.
- I don’t like it, but I can deal with it.
- I dislike it and cannot tolerate it.
You need to be cautious of how these alternatives are perceived and ensure respondents grasp the purpose of the questionnaire. Selecting the best responses and conveying them to participants should improve outcomes.
Ask The Customer About The Feature’s Significance.
Multiple teams have recommended adding additional questions following the functional/dysfunctional pair. Customers are asked how significant a feature is.
This information helps differentiate features and determine which are most important to customers. It lets you distinguish between primary and minor characteristics and how they affect consumer choices.
Examine Your Questionnaire.
Review the questionnaire with a few of your team members before distributing it to your clients. Speaking with individuals from the outside would undoubtedly cause any internal uncertainty, if there is any.
Analyze The Outcomes
Now, you reach the study’s motivation. After tabulating and analyzing data, you may classify characteristics and prioritize them. You may explore two types of analysis: – discrete and continuous. Both are mathematical notions that link participant answers to the Kano categories. Each method depends on the sort of insight you want.
Discrete Analysis
The most straightforward approach to analyzing the Kano results is to:
- Sort respondents based on the demographic and persona traits that best describe them.
- Using the Evaluation table, classify each respondent’s responses.
- Add all the replies for each category characteristic (and demographic).
- The most common answer (i.e., the mode) will be for each feature’s category.
- Use the leftmost wins rule when there are close outcomes among categories: Must-have > Performance > Beautiful > Uninteresting.
- If you asked respondents to rate the significance of certain features, you should average their responses if you did.
This kind of analysis provides you with a basic level of knowledge. It is helpful when a more thorough approach is unnecessary (e.g., testing design ideas or making a rough draft of your roadmap).
Continuous Analysis
The discrete analysis has a few problems, but it’s a fantastic place to start and gives a general understanding of the outcomes. Namely:
- In this process, we lose a lot of information. The first step was to assign each respondent’s 25 possible answers to one of six groups. The responses from each responder are then combined into a single category for each characteristic.
- The variation in data is entirely unknown; softer answers are given the same weight as tougher ones. Consider an attractive person with a dysfunctional “expect it” vs. a “live with it” attitude.
Score Answers
First, each response choice is given a potential satisfaction value between -2 and 4. The higher the number, the more the client wants the function. Importance is graded 1 to 9 like previously.
Functional: -2 (Dislike), -1 (Live with), 0, 2 (Must-be), 4 (Like);
Dysfunctional: -2 (Like), -1 (Must be), 0 (Neutral), 2 (Live With), 4 (Dislike);
Importance: -1 (Not Important), 9 (Extremely Important).
You may find the Dysfunctional scale backward. Don’t higher scores reflect more pleasure? In Dysfunctional responses, Disliking denotes strongly disagreeing with the feature’s absence. Inclusion would increase satisfaction. Hence, it receives a higher score.
The rationale for the asymmetrical scale (beginning at -2 instead of -4) is that the categories you obtain from negative replies (Reverse and Questionable) are weaker (Must-be and Performance).
These scores will categorize the characteristics of a 2-D plane. With this strategy, no evaluation table is needed.
Suppose a characteristic turns out to be Reverse. In that case, you may always define it as the opposite and swap the Functional and Dysfunctional scores to classify it into a different Kano category; alternatively, you can remove it from your research.
Conclusion
The KANO model is a structured prioritization methodology for product teams, aiding them in effectively prioritizing features believed to satisfy and delight clients, leading to high satisfaction and customer delight.
These approaches demonstrate their effectiveness in this challenging marketplace, where products compete for limited shelf space and consumers’ attention. Even before the product development phase, the Kano quality model strives to clarify the investment in features, time frame, and resources needed.
The KANO model case study demonstrated how to launch a new product successfully while working under limited resources and tight timing constraints.
You can rapidly assess customer sentiment with QuestionPro, which enables you to examine trends in client comments. Paying attention to, analyzing, and acting upon customer input ensures high satisfaction and creates the best customer experience. Now, give it a try!