• Skip to main content
  • Skip to primary sidebar
  • Skip to footer
QuestionPro

QuestionPro

questionpro logo
  • Products
    survey software iconSurvey softwareEasy to use and accessible for everyone. Design, send and analyze online surveys.research edition iconResearch SuiteA suite of enterprise-grade research tools for market research professionals.CX iconCustomer ExperienceExperiences change the world. Deliver the best with our CX management software.WF iconEmployee ExperienceCreate the best employee experience and act on real-time data from end to end.
  • Solutions
    IndustriesGamingAutomotiveSports and eventsEducationGovernment
    Travel & HospitalityFinancial ServicesHealthcareCannabisTechnology
    Use CaseAskWhyCommunitiesAudienceContactless surveysMobile
    LivePollsMember ExperienceGDPRPositive People Science360 Feedback Surveys
  • Resources
    BlogeBooksSurvey TemplatesCase StudiesTrainingHelp center
  • Features
  • Pricing
Language
  • English
  • Español (Spanish)
  • Português (Portuguese (Brazil))
  • Nederlands (Dutch)
  • العربية (Arabic)
  • Français (French)
  • Italiano (Italian)
  • 日本語 (Japanese)
  • Türkçe (Turkish)
  • Svenska (Swedish)
  • Hebrew IL (Hebrew)
  • ไทย (Thai)
  • Deutsch (German)
  • Portuguese de Portugal (Portuguese (Portugal))
Call Us
+1 800 531 0228 +1 (647) 956-1242 +52 999 402 4079 +49 301 663 5782 +44 20 3650 3166 +81-3-6869-1954 +61 2 8074 5080 +971 529 852 540
Log In Log In
SIGN UP FREE

Home Market Research Research Tools and Apps

5 Statistical Analysis Methods for Research and Analysis

Unlocking the value of corporate analytics starts with knowing the statistical analysis methods. Top 5 methods to improve business decisions.

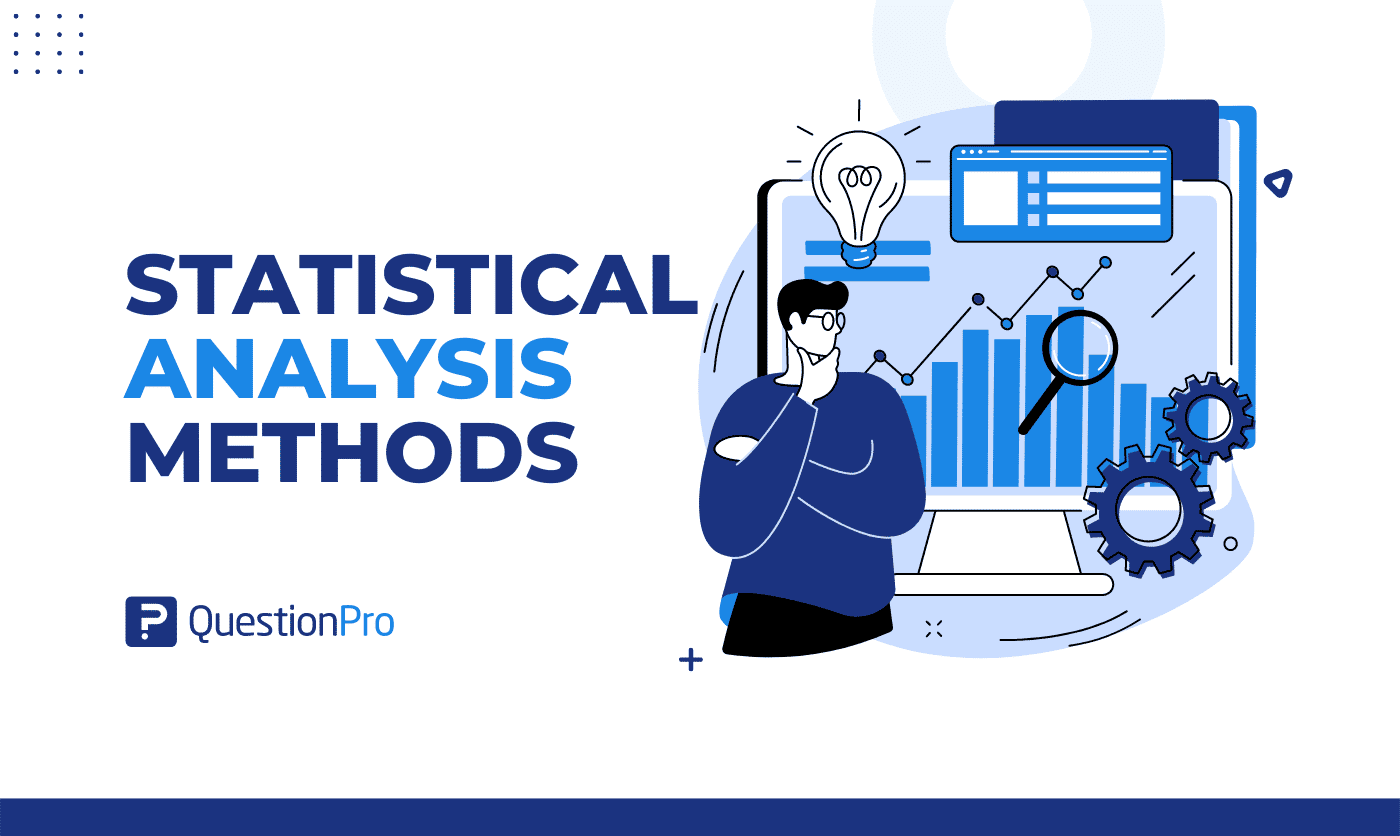
It all boils down to using the power of statistical analysis methods, which is how academics collaborate and collect data to identify trends and patterns.

Over the last ten years, everyday business has undergone a significant transformation. It’s not very uncommon for things to still appear to be the same, whether it’s the technology used in workspaces or the software used to communicate.

There is now an overwhelming amount of information available that was once rare. But it could be overwhelming if you don’t have the slightest concept of going through your company’s data to find meaningful and accurate meaning.

5 different statistical analysis methods will be covered in this blog, along with a detailed discussion of each method.

What is a statistical analysis method?

The practice of gathering and analyzing data to identify patterns and trends is known as statistical analysis. It is a method for eliminating bias from data evaluation by using numerical analysis. Data analytics and data analysis are closely related processes that involve extracting insights from data to make informed decisions.

And these statistical analysis methods are beneficial for gathering research interpretations, creating statistical models, and organizing surveys and studies.

Data analysis employs two basic statistical methods:

  1. Descriptive statistics, which use indexes like mean and median to summarize data,
  2. Inferential statistics, extrapolate results from data by utilizing statistical tests like the student t-test.

LEARN ABOUT: Descriptive Analysis

The following three factors determine whether a statistical approach is most appropriate:

  • The study’s goal and primary purpose,
  • The kind and dispersion of the data utilized, and
  • The type of observations (Paired/Unpaired).

“Parametric” refers to all types of statistical procedures used to compare means. In contrast, “nonparametric” refers to statistical methods that compare measures other than means, such as medians, mean ranks, and proportions.

For each unique circumstance, statistical analytic methods in biostatistics can be used to analyze and interpret the data. Knowing the assumptions and conditions of the statistical methods is necessary for choosing the best statistical method for data analysis.

5 Statistical Analysis Methods for Research and Analysis

Whether you’re a data scientist or not, there’s no doubt that big data is taking the globe by storm. As a result, you must be aware of where to begin. There are 5 options for this statistical analysis method:

  • Meaning

Big data is taking over the globe, no matter how you slice it. Mean, more often known as the average, is the initial technique used to conduct the statistical analysis. To find the mean, add a list of numbers, divide that total by the list’s components, and then add another list of numbers.

When this technique is applied, it is possible to quickly view the data while also determining the overall trend of the data collection. The straightforward and quick calculation is also advantageous to the method’s users.

The center of the data under consideration is determined using the statistical mean. The outcome is known as the presented data’s mean. Real-world interactions involving research, education, and athletics frequently use derogatory language. Consider how frequently a baseball player’s batting average—their mean—is brought up in conversation if you consider yourself a data scientist. As a result, you must be aware of where to begin.

  • Standard deviation

A statistical technique called standard deviation measures how widely distributed the data is from the mean.

When working with data, a high standard deviation indicates that the data is widely dispersed from the mean. A low deviation indicates that most data is in line with the mean and can also be referred to as the set’s expected value.

Standard deviation is frequently used when analyzing the dispersion of data points—whether or not they are clustered.

Imagine you are a marketer who just finished a client survey. Suppose you want to determine whether a bigger group of customers will likely provide the same responses. In that case, you should assess the responses’ dependability after receiving the survey findings. If the standard deviation is low, a greater range of customers may be projected with the answers.

  • Regression

Regression in statistics studies the connection between an independent variable and a dependent variable (the information you’re trying to assess) (the data used to predict the dependent variable).

It can also be explained in terms of how one variable influences another, or how changes in one inconsistent result in changes in another, or vice versa, simple cause and effect. It suggests that the result depends on one or more factors.

Regression analysis graphs and charts employ lines to indicate trends over a predetermined period as well as the strength or weakness of the correlations between the variables.

  • Hypothesis testing

The two sets of random variables inside the data set must be tested using hypothesis testing, sometimes referred to as “T Testing,” in statistical analysis.

This approach focuses on determining whether a given claim or conclusion holds for the data collection. It enables a comparison of the data with numerous assumptions and hypotheses. It can also help in predicting how choices will impact the company.

A hypothesis test in statistics determines a quantity under a particular assumption. The test’s outcome indicates whether the assumption is correct or whether it has been broken. The null hypothesis, sometimes known as hypothesis 0, is this presumption. The first hypothesis, often known as hypothesis 1, is any other theory that would conflict with hypothesis 0.

When you perform hypothesis testing, the test’s results are statistically significant if they demonstrate that the event could not have occurred by chance or at random.

  • Sample size determination

When evaluating data for statistical analysis, gathering reliable data can occasionally be challenging since the dataset is too huge. When this is the case, the majority choose the method known as sample size determination, which involves examining a sample or smaller data size.

You must choose the appropriate sample size for accuracy to complete this task effectively. You won’t get reliable results after your analysis if the sample size is too small.

You will use several data sampling techniques to achieve this result. To accomplish this, you may send a survey to your customers and then use the straightforward random sampling method to select the customer data for random analysis.

Conversely, excessive sample size can result in time and money lost. You can look at factors like cost, time, or the ease of data collection to decide the sample size.

Are you confused? Don’t worry! you can use our sample size calculator.

LEARN ABOUT: Theoretical Research

Conclusion

The ability to think analytically is vital for corporate success. Since data is one of the most important resources available today, using it effectively can result in better outcomes and decision-making.

Regardless of the statistical analysis methods you select, be sure to pay close attention to each potential drawback and its particular formula. No method is right or wrong, and there is no gold standard. It will depend on the information you’ve gathered and the conclusions you hope to draw.

By using QuestionPro, you can make crucial judgments more efficiently while better comprehending your clients and other study subjects. Use the features of the enterprise-grade research suite right away!


SHARE THIS ARTICLE:

About the author
Sanjida Satter

View all posts by Sanjida Satter

Primary Sidebar

Gain insights with 80+ features for free

Create, Send and Analyze Your Online Survey in under 5 mins!

Create a Free Account

RELATED ARTICLES

HubSpot - QuestionPro Integration

Release Notes September 2022

Sep 30,2022

HubSpot - QuestionPro Integration

Trivia online with friends: How to host the best party

May 31,2022

HubSpot - QuestionPro Integration

Explicit Data: What it is + Practical Guide

Sep 12,2022

BROWSE BY CATEGORY

  • Academic
  • Academic Research
  • Artificial Intelligence
  • Assessments
  • Audience
  • Brand Awareness
  • Business
  • Case Studies
  • Communities
  • Consumer Insights
  • Customer effort score
  • Customer Engagement
  • Customer Experience
  • Customer Loyalty
  • Customer Research
  • Customer Satisfaction
  • CX
  • Employee Benefits
  • Employee Engagement
  • Employee Engagement
  • Employee Retention
  • Enterprise
  • Events
  • Forms
  • Friday Five
  • General Data Protection Regulation
  • Guest Post
  • Insights Hub
  • Life@QuestionPro
  • LivePolls
  • Market Research
  • Marketing
  • Mobile
  • Mobile App
  • Mobile diaries
  • Mobile Surveys
  • New Features
  • non-profit
  • NPS
  • Online Communities
  • Polls
  • Question Types
  • Questionnaire
  • QuestionPro
  • QuestionPro Products
  • Release Notes
  • Research Tools and Apps
  • Revenue at Risk
  • Startups
  • Survey Templates
  • Surveys
  • Tech News
  • Tips
  • Training
  • Training Tips
  • Trending
  • Tuesday CX Thoughts (TCXT)
  • Uncategorized
  • VOC
  • Webinar
  • Webinars
  • What’s Coming Up
  • Workforce
  • Workforce Intelligence

Footer

MORE LIKE THIS

Medtech Market Research

MedTech Market Research: Fueling Innovation in 2025

May 8, 2025

customer-retention-strategies

15 Top Customer Retention Strategies to Boost Loyalty in 2025

May 8, 2025

the-home-depot-nps-2025

The Home Depot NPS & Customer Satisfaction 2025

May 7, 2025

panel-research-companies

Top 8 Panel Research Companies for Quality Research in 2025

May 6, 2025

Other categories

  • Academic
  • Academic Research
  • Artificial Intelligence
  • Assessments
  • Audience
  • Brand Awareness
  • Business
  • Case Studies
  • Communities
  • Consumer Insights
  • Customer effort score
  • Customer Engagement
  • Customer Experience
  • Customer Loyalty
  • Customer Research
  • Customer Satisfaction
  • CX
  • Employee Benefits
  • Employee Engagement
  • Employee Engagement
  • Employee Retention
  • Enterprise
  • Events
  • Forms
  • Friday Five
  • General Data Protection Regulation
  • Guest Post
  • Insights Hub
  • Life@QuestionPro
  • LivePolls
  • Market Research
  • Marketing
  • Mobile
  • Mobile App
  • Mobile diaries
  • Mobile Surveys
  • New Features
  • non-profit
  • NPS
  • Online Communities
  • Polls
  • Question Types
  • Questionnaire
  • QuestionPro
  • QuestionPro Products
  • Release Notes
  • Research Tools and Apps
  • Revenue at Risk
  • Startups
  • Survey Templates
  • Surveys
  • Tech News
  • Tips
  • Training
  • Training Tips
  • Trending
  • Tuesday CX Thoughts (TCXT)
  • Uncategorized
  • VOC
  • Webinar
  • Webinars
  • What’s Coming Up
  • Workforce
  • Workforce Intelligence

questionpro-logo-nw
Help center Live Chat SIGN UP FREE
  • Sample questions
  • Sample reports
  • Survey logic
  • Branding
  • Integrations
  • Professional services
  • Security
  • Survey Software
  • Customer Experience
  • Workforce
  • Communities
  • Audience
  • Polls Explore the QuestionPro Poll Software - The World's leading Online Poll Maker & Creator. Create online polls, distribute them using email and multiple other options and start analyzing poll results.
  • Research Edition
  • LivePolls
  • InsightsHub
  • Blog
  • Articles
  • eBooks
  • Survey Templates
  • Case Studies
  • Training
  • Webinars
  • All Plans
  • Nonprofit
  • Academic
  • Qualtrics Alternative Explore the list of features that QuestionPro has compared to Qualtrics and learn how you can get more, for less.
  • SurveyMonkey Alternative
  • VisionCritical Alternative
  • Medallia Alternative
  • Likert Scale Complete Likert Scale Questions, Examples and Surveys for 5, 7 and 9 point scales. Learn everything about Likert Scale with corresponding example for each question and survey demonstrations.
  • Conjoint Analysis
  • Net Promoter Score (NPS) Learn everything about Net Promoter Score (NPS) and the Net Promoter Question. Get a clear view on the universal Net Promoter Score Formula, how to undertake Net Promoter Score Calculation followed by a simple Net Promoter Score Example.
  • Offline Surveys
  • Customer Satisfaction Surveys
  • Employee Survey Software Employee survey software & tool to create, send and analyze employee surveys. Get real-time analysis for employee satisfaction, engagement, work culture and map your employee experience from onboarding to exit!
  • Market Research Survey Software Real-time, automated and advanced market research survey software & tool to create surveys, collect data and analyze results for actionable market insights.
  • GDPR & EU Compliance
  • Employee Experience
  • Customer Journey
  • Synthetic Data
  • About us
  • Executive Team
  • In the news
  • Testimonials
  • Advisory Board
  • Careers
  • Brand
  • Media Kit
  • Contact Us

QuestionPro in your language

  • English
  • Español (Spanish)
  • Português (Portuguese (Brazil))
  • Nederlands (Dutch)
  • العربية (Arabic)
  • Français (French)
  • Italiano (Italian)
  • 日本語 (Japanese)
  • Türkçe (Turkish)
  • Svenska (Swedish)
  • Hebrew IL (Hebrew)
  • ไทย (Thai)
  • Deutsch (German)
  • Portuguese de Portugal (Portuguese (Portugal))

Awards & certificates

  • survey-leader-asia-leader-2023
  • survey-leader-asiapacific-leader-2023
  • survey-leader-enterprise-leader-2023
  • survey-leader-europe-leader-2023
  • survey-leader-latinamerica-leader-2023
  • survey-leader-leader-2023
  • survey-leader-middleeast-leader-2023
  • survey-leader-mid-market-leader-2023
  • survey-leader-small-business-leader-2023
  • survey-leader-unitedkingdom-leader-2023
  • survey-momentumleader-leader-2023
  • bbb-acredited
The Experience Journal

Find innovative ideas about Experience Management from the experts

  • © 2022 QuestionPro Survey Software | +1 (800) 531 0228
  • Sitemap
  • Privacy Statement
  • Terms of Use