
Statistical analysis offers us a valuable set of interpretations for understanding the results of an investigation. It equips us to identify trends within different data points, develop statistical models, and design surveys and research studies. This capacity becomes particularly crucial when dealing with large volumes of data, as it enables us to analyze data values and collect relevant insights for shaping future trends, ultimately making sense of big data by applying various statistical tools.
We know data analysis involves an in-depth review of each part of a whole to understand its structure and interpret its operation. Data analytics and data analysis are closely related processes that involve extracting insights from data to make informed decisions. Statistics, on the other hand, is the science that uses probabilities as a basis to influence the possible outcomes of situations that are determined by numerical data when collecting, interpreting and determining their validity.
What is Statistical Analysis?
Statistical analysis collects, cleans, summarizes, interprets, and draws conclusions from data. It involves using statistical techniques and methods to analyze and make sense of information, helping researchers, analysts, and decision-makers understand patterns, relationships, and trends within data sets. Statistical analysis is fundamental to scientific research, market intelligence, quality control, and decision-making in various fields.
Hence, you engage in statistical analysis when you gather and interpret data with the purpose of uncovering patterns and trends. This signifies that, while it constitutes a form of data analysis on its own, it is undertaken with an interpretive perspective, which proves invaluable in making informed decisions and comprehending a company’s potential customers, their behaviors, and their experiences.
“Today, statistics is a tool that cannot be lacking in the analysis of data from an investigation, because from the conception of the idea of what is going to be investigated, through the definition of objectives, hypotheses, variables, collection of the data, organization, review, classification, tabulation and production of the results for their analysis it is important to know how to give an appropriate use to the different measures and statistical models for the analysis.
When it is accomplished, the results obtained represent a true contribution to solving the problems inherent to the field where the activities inherent to the different investigations are carried out. ” —Profr. Gerardo Bauce
With a statistical analysis, we can answer questions such as the following:
- Who are our clients?
- How much does a client pay in a visit?
- What is the age of our clients?
- How can we categorize our types of clients?
- What types of experiences do our clients enjoy?
Identifying patterns of behavior or different trends in a set of data helps companies observe and record the buying behavior of their customers, both to improve their products or services and to facilitate an updated and improved shopping experience, obtaining satisfied customers and great brand awareness as a result.
LEARN ABOUT: Data Analytics Projects
Types of Statistical Analysis
Statistical analysis is indispensable to data analysis, research, and informed decision-making. It encompasses a wide array of techniques, each tailored to specific purposes, making it a versatile tool in data analytics. Here are some of the most common types of statistical analysis:
Descriptive Analysis:
Descriptive statistics help in the presentation of data, making it more understandable through charts and tables, particularly valuable for market analysis or when working with categorical data.
Inferential Analysis:
Inferential statistics delve into relationships between variables, often involving hypothesis tests and drawing conclusions from sample data to generalize to a larger population.
Predictive Analysis:
Predictive statistical analysis harnesses the power of machine learning, data mining, and data modeling to discern patterns, thereby facilitating the anticipation of future events by drawing insights from historical data. This practice is fundamental not only in data analysis but also in guiding pivotal business decisions.
Prescriptive Analysis:
This statistical analysis provides recommendations and informed decisions based on the data. It’s invaluable for guiding strategic actions.
Exploratory Data Analysis:
This method explores unknown data associations and uncovers potential relationships, similar to inferential analysis, but emphasizes data landscape exploration.
Causal Analysis:
Causal statistical analysis unravels cause-and-effect relationships within raw data, delving into what specific events occur and their impacts on other variables. It is vital for understanding the market dynamics or conducting hypothesis tests.
The choice of statistical analysis method hinges on research questions, data type, and underlying assumptions. Researchers, statisticians, and data analysts meticulously select the appropriate method according to their objectives and the nature of the data they collect and analyze. Statistical software and data sets form the core of their toolbox, facilitating effective data collection, analysis, and informed decision-making.
How to perform a functional statistical analysis
In order to perform statistical analysis, we need to collect and review the data samples available in the results of the study to be analyzed.
Although there is no single way to carry out an interpretive analysis, there are practices that can be replicated in any study if they are carried out in the appropriate way to the information provided. These tips will allow us to carry out a useful analysis.
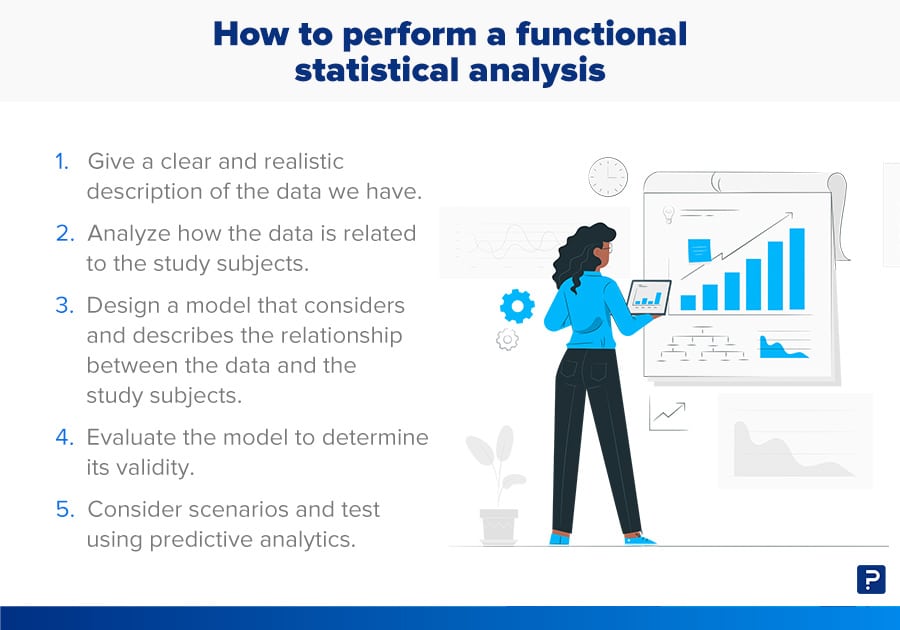
- Give a clear and realistic description of the data we have.
- Analyze how the data is related to the study subjects.
- Design a model that considers and describes the relationship between the data and the study subjects.
- Evaluate the model to determine its validity.
- Consider scenarios and tests using predictive analytics.
Advantages of Statistical Analysis
Statistical analysis, a cornerstone of data science, offers several advantages in various fields, including research, business, and decision-making. By effectively analyzing data, statistical analytics supports critical advantages:
Data Interpretation: Statistical analysis plays a pivotal role in data science, helping researchers and analysts summarize and interpret complex data, making it more accessible and enabling them to draw meaningful insights. This capability is especially crucial when dealing with vast data sets.
Objectivity: In data science, statistical analytics provides an objective and systematic approach to decision-making and hypothesis testing, reducing the influence of bias in interpreting collected data. This impartiality enhances the reliability of findings.
Generalization: One of the primary strengths of statistical analysis is its ability to generalize research findings from a sample to the entire data population, thereby enhancing the external validity of research studies.
Data Reduction: When dealing with extensive data sets, statistical analysis assists in data reduction, extracting key patterns and relationships. Simplifying these large data sets makes it easier to work with, facilitating more effective communication of results.
Comparisons: Statistical analysis, including calculating measures like standard deviation, makes comparing different groups or conditions within the collected data easier. It aids in identifying significant differences or similarities, a crucial step in decision-making and research.
Prediction: Statistical analysis goes beyond merely analyzing data; it enables the development of predictive models. These models are invaluable for forecasting trends, making predictions, and aiding in informed decision-making.
Statistical analysis is the backbone for gathering and analyzing data sets in data science. This robust framework is critical for extracting meaningful insights from collected data, thus enhancing decision-making and propelling progress in numerous fields
Uses of Statistics in Data Analysis
When we comprehensively understand the trends within our market, we gain a competitive advantage. We can employ statistical analysis to anticipate future behaviors by implementing suitable risk management strategies. Furthermore, by leveraging specific data on consumer behavior, we can discern their preferences, pinpoint the products or services that resonate most and least with them, and strategize on how to effectively engage them in making a purchase.
In a landscape where new trends and behaviors among clients and even employees constantly emerge, reviewing and analyzing complex data is imperative. For this purpose, we recommend using survey software like QuestionPro, which offers specialized tools and functions for designing a robust statistical analysis. This approach ensures that the data collected, the determination of sample sizes, and the selection of sample groups are aligned with the analysis’s objectives and represent the entire population. Engaging skilled statistical analysts in this process further enhances the effectiveness of the data collection and testing of statistical hypotheses.
There’s always new trends and behaviors among clients or even employees that we need to constantly review, for this reason, to carry out more complex data with specific tools and functions to design a statistical analysis, we recommend using survey software such as QuestionPro.
Uses of Statistical Analysis with Examples
Statistical analysis is widely adopted across various fields, serving numerous critical purposes. Here are some typical applications of this analysis, along with examples:
Business and Economics:
- Market Research: Businesses can analyze preferences and trends by collecting data from a representative sample of customers. For instance, a company might conduct surveys to determine which product features are most appealing to customers.
- Financial Analysis: In the financial sector, statistical analysis is instrumental in understanding stock market trends and forecasting future stock prices. Using historical data makes it possible to create models for predicting alterations in stock prices.
Healthcare:
- Clinical Trials: In the healthcare sector, statistical analysis is employed in clinical trials to assess the efficacy of new medications. Researchers compare patient outcomes in a control group with those in a treatment group to determine the drug’s impact.
- Epidemiology: Statistical analysis helps epidemiologists analyze disease patterns in populations. For example, data is examined during a disease outbreak like COVID-19 to understand how the disease spreads across different regions.
Manufacturing and Quality Control:
- Quality Assurance: Statistical process control (SPC) is applied in manufacturing to oversee and enhance production processes. It ensures consistent, high-quality product output. Statistical analysis allows real-time monitoring of critical parameters to detect variations and take corrective action.
- Defect Analysis: In quality control, the analysis of product defects involves collecting data through random sampling. For instance, a sample of widgets may be inspected to determine if they meet quality standards. This analysis aids in identifying and addressing defects effectively.
These examples highlight how data sets are collected through methods such as random sampling, allowing for the determination of sample sizes and the selection of representative sample groups. Statistical analysts play a crucial role in applying appropriate statistical techniques and methods to address specific research questions in these fields. This analysis is a versatile tool that enhances decision-making, problem-solving, and insights generation across diverse domains.
Conclusion
Statistical analysis, facilitated by advanced statistical analysis software, is a fundamental and versatile tool pivotal across many disciplines and industries. It empowers researchers, analysts, and decision-makers to extract valuable insights, make informed choices, and draw meaningful conclusions from data. Whether leveraging sophisticated statistical methods to reveal intricate patterns, employing statistical software to make accurate predictions, or conducting statistical tests to identify causal relationships, this analysis is an indispensable cornerstone for data-driven decision-making. It serves as the conduit between raw data and actionable knowledge, enabling evidence-based decision-making in areas as diverse as healthcare and economics, environmental science, and manufacturing.
Moreover, statistical analysis is pivotal in enhancing our understanding of the world and helps us mitigate risks, optimize processes, and tackle complex problems. Employing a wide array of statistical tests and techniques bridges the gap between the abundance of raw data and the practical insights needed for effective decision-making. Whether it’s assessing the impact of interventions on a dependent variable in healthcare research or optimizing manufacturing processes for improved product quality, statistical analysis is a linchpin in our ability to decipher the complex tapestry of data surrounding us and turn it into actionable information.