Teams searching for an Alida alternative are rarely starting from zero. They already run a research community and know its value. What sends them looking elsewhere is what happens once that community grows past its first few hundred members.
Visibility, participation quality, and data reliability start to outweigh simply keeping a community alive. When a platform cannot show whether engagement is improving or quietly declining, confidence in the data erodes with it.
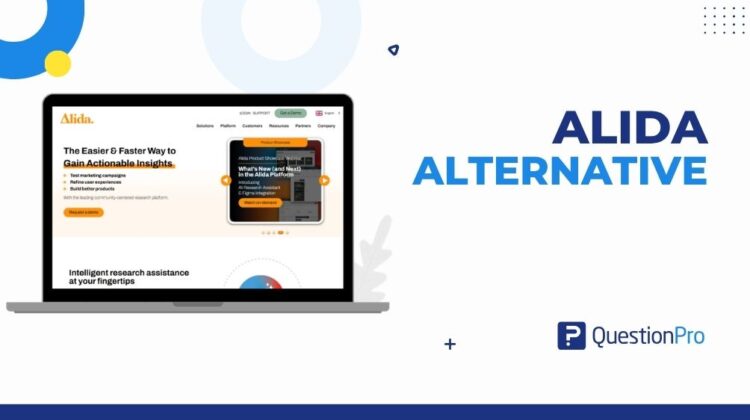
This guide breaks down why research teams evaluate an Alida alternative, what Alida offers today, and where QuestionPro fits as one option worth comparing.
What is an Alida alternative?
An Alida alternative is any research community or market research platform that a team evaluates as a replacement for Alida, the company formerly known as Vision Critical. Teams look at alternatives for the same reason they evaluate any incumbent vendor: to see whether a different platform handles community health, participation data, and representative sampling better than their current one.
The category spans dedicated research community platforms, broader customer insight platform options, and full-service research suites, depending on what a team needs beyond simply hosting a community.
Why do research teams look for an Alida alternative?
Teams typically start evaluating alternatives when their current platform shows activity but not health. Running surveys, polls, or discussions can look like healthy engagement on the surface, even when participation is quietly concentrated among a shrinking group of members.
Five gaps come up most often in these evaluations:
- Limited visibility into whether community health is improving or declining
- Unclear picture of how participation is distributed across members
- Little clarity on which activities actually drive engagement
- Member fatigue from outreach that is too frequent or too repetitive
- Weaker control over sample representation as the community scales
Each of these directly affects how much confidence a team can place in the resulting data.
Alida, formerly Vision Critical: A quick orientation
Alida is a Canadian customer experience and insights platform that operated under the name Vision Critical until a 2020 rebrand. The product line now follows a functional naming structure, with research, survey, and community tools sold under the Alida brand rather than the Vision Critical name some teams still recognize from older vendor comparisons or migration guides.
Anyone searching for a Vision Critical alternative is, in practice, researching an Alida alternative. The underlying evaluation criteria do not change with the name. What matters is how a platform performs on community health, participation data, and representative sampling, not which brand sits on the login page.
Common mistakes teams make when evaluating a new platform
Most evaluation mistakes come from judging a new platform the same way a team judged its original choice years earlier, when needs were simpler, and the community was smaller.
- Weighing total activity instead of participation trends over time
- Skipping a test migration, then discovering data mapping gaps after the contract is signed
- Assuming every member engages equally, which hides a small group carrying most of the data
- Underestimating how outreach frequency affects long-term response rates
- Choosing on price alone without checking for representative sampling tools
A platform that avoids these blind spots tends to also score well on the evaluation criteria below.
How do you evaluate community health, not just activity?
Community health means tracking participation trends over time, not counting recent survey completions. A platform that only reports totals hides whether engagement is trending up, down, or becoming inconsistent across activity types.
Look for a platform that surfaces early disengagement signals before they affect data quality, not just a monthly activity report after the fact. Features like community statistics dashboards, which track participation trends and member drop-off, give teams a continuous view instead of a reactive one.
What should you evaluate before choosing a platform?
Choosing an Alida alternative works best when the decision goes beyond a feature checklist. G2’s online community management category lists more than 180 products, which makes a structured comparison far more useful than browsing listings alone.
| Area to evaluate | Why it matters |
|---|---|
| Community health tracking | Shows whether engagement trends up or down, not just a point-in-time count |
| Participation distribution | Reveals whether data relies on a small, overrepresented group of members |
| Engagement strategy tools | Identifies which activity formats and send times actually drive responses |
| Member fatigue controls | Spaces out outreach to protect long-term response quality |
| Sample representation | Confirms participants match what a specific study needs, not just who is active |
| Data privacy compliance | Verifies the platform meets data privacy regulations relevant to your industry |
How does participation distribution affect data quality?
Participation in most communities skews toward a small, highly engaged group, while a larger share of members stay mostly inactive. Averages and totals hide this pattern, since a healthy-looking average can mask a handful of super-responders carrying most of the data.
A platform that shows how points, responses, or activity are distributed across members, rather than just in aggregate, makes this imbalance visible. That matters because research built on a narrow, overrepresented slice of a community produces less reliable, less representative results.
How do you avoid member fatigue while increasing research velocity?
Faster research cycles only help if the community stays willing to participate. Sending overlapping invitations or repeating the same activity format too often leads to fatigue, which shows up as declining response rates and weaker answers.
A few tactics reduce fatigue without slowing a research program down:
- Timing invitations around when members are most likely to respond
- Mixing activity formats across polls, discussions, and surveys instead of repeating one
- Spacing outreach with communication management instead of stacking requests
- Reviewing response trends monthly to catch fatigue before it shows up in the data
How do you maintain representative samples at scale?
As a community grows, keeping a representative sample gets harder because it stops being a question of recruiting more people. It becomes a question of recruiting and validating the right people for each specific study.
Features such as profile validation and sample quota management help by checking that participants match the criteria a study actually needs, rather than pulling from whoever happens to be most active. This control matters most when findings go in front of stakeholders who will ask how representative the sample was.
Example: What switching to a new platform looks like
Most teams moving off an older community platform follow a similar sequence, regardless of which vendor they choose. A mid-sized research team running a community of a few thousand members typically works through it in four stages.
- Export member profiles, response history, and reward balances from the current platform
- Map historical data fields to the new platform’s structure before go-live
- Rebuild recruitment and activation workflows on the new platform
- Run a short overlap period where both platforms stay active during the transition
Teams that skip the data mapping step in stage two are the ones most likely to run into the mistake described earlier: discovering gaps only after the contract is already signed.
What role does synthetic data play in extending community research?
Synthetic data is artificially generated information designed to reflect the statistical patterns of real data without containing personal or identifying details. In a research community context, synthetic data extends insights between live studies rather than replacing them.
When synthetic data is built from a community’s own historical patterns and known respondent profiles, it supports scenario testing and fills gaps where a new live study is not feasible within a tight timeline. It works best as a complement to ongoing community research, not a substitute for asking real members real questions.
Where does QuestionPro fit as an Alida alternative?
QuestionPro’s research community platform is built around the evaluation areas above rather than treated as an add-on to a broader suite. It pairs with QuestionPro’s survey software for the underlying data collection a community research program still needs.
- Community health monitoring that tracks participation trends, not just point-in-time totals
- Participation distribution views that surface over-reliance on a small group of members
- Sample validation tools for keeping study-specific samples representative as a community scales
Choosing the right fit matters more than the switch itself
Moving off Alida is rarely about replacing a platform for its own sake. It is about finding a system that keeps supporting engagement, data quality, and scale as a research community matures past its early stage.
The right choice depends on how closely a platform’s approach to community health, representation, and continuous research matches what a team actually needs going forward.
Frequently Asked Questions (FAQs)
Yes. Vision Critical rebranded to Alida in September 2020. The underlying product line continued under the new name, so content and vendor comparisons referencing Vision Critical describe the same company now operating as Alida.
Timelines vary by community size and data complexity. Most migrations center on exporting member profiles, historical response data, and reward history, then rebuilding recruitment and activation workflows on the new platform.
Not necessarily. Synthetic data works best for filling short-term gaps or testing scenarios between live studies, not for replacing an already active, well-engaged community that is consistently producing real, first-party member responses.
A survey panel is typically a larger, less engaged pool used for one-off studies. A research community is a smaller, more engaged group used repeatedly over time for ongoing, relationship-based feedback.
Not always. Communities work well for ongoing engagement with a known audience, but external panels still fill gaps when a study needs to reach beyond an organization’s existing customer or employee base.