Ah, Net Promoter Score. You have heard of it and you probably understand the importance of customer loyalty. The NPS system is a measure of customer loyalty with the correlation and reflection of a business’s profitability. Most companies measure NPS by asking customers right after a recent transaction via a survey.
However, very few companies actually take into account the different customer profiles when reporting NPS. In my experience with modeling, companies are losing out on a huge opportunity when they don’t leverage the power of weighted NPS.
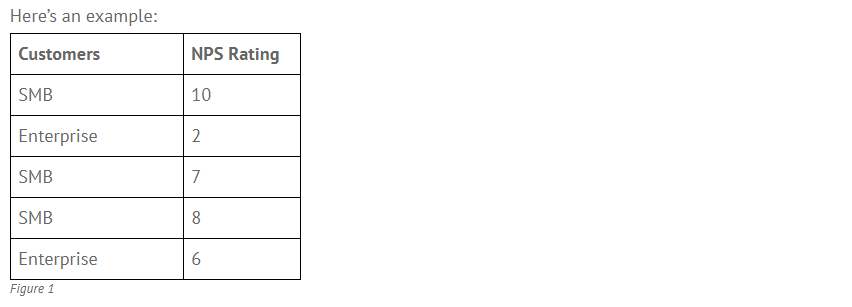
Here’s an example:
Now, let’s calculate the standard formula for NPS: % of Promoter customers minus % of your detractor customers.
Drawn from the numbers in Figure 1, you get the following:
(Note: the NPS is always a measurement valued between -100 and +100)
Calculating customer lifetime value into NPS
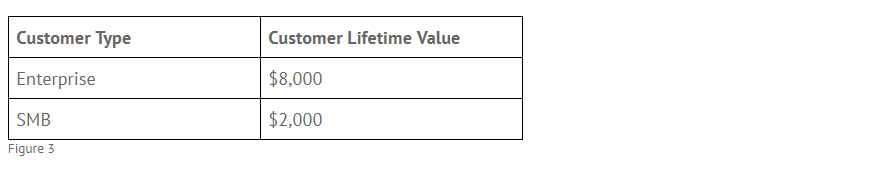
Now, lets bring in actual revenue. Let’s propose that the Lifetime Value of an Enterprise Customer is 4x higher than the value of an SMB Customer.
Let’s take the Customer Lifetime Values for Enterprise vs. SMB:
What if I told you that the absolute numbers ($8,000 and $2,000) don’t matter? Would you agree?
What the traditional model doesn’t take into consideration is that your Enterprise customer is 4X more valuable than the SMB customer, monetarily speaking.
Now this metric in this example we are using is revenue, but as you can imagine, you can replace revenue with any monetary metric, for example, profit margins.
Revenue weighted NPS
With the NPS survey response at granular level, you can compute the NPS by taking into consideration the spend or revenue as per customer.
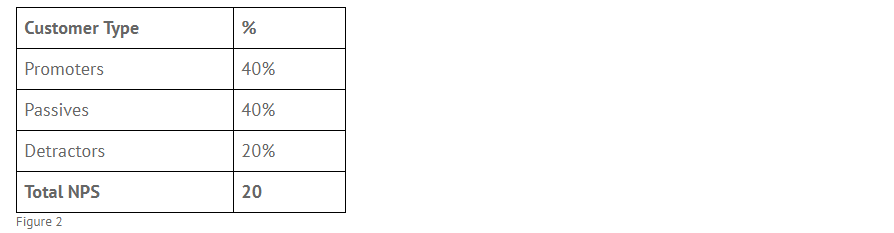
Now, let’s take into account the same NPS Score calculation, but using Customer LTV as an example. In the above example (Figure 1), we have two SMB promoters and one Enterprise detractor. Without taking LTV and the type of Customer into consideration, one would assume that approximately 40% are Promoters and 20% are Detractors. From a pure business and economics perspective, this assumption is flawed. Why? Since we are focused on the $4,000 value of Promoters, we run the risk of losing double the amount ($8,000) if we don’t hone in on understanding the value of different customer types.
To mitigate loss, we can “weigh” the Net Promoter scores based on LTV of each Customer Tier:
Calculating the revenue weighted NPS
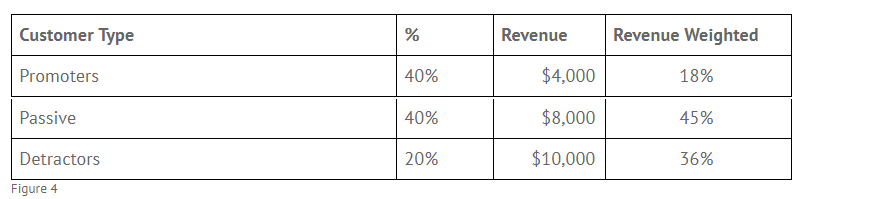
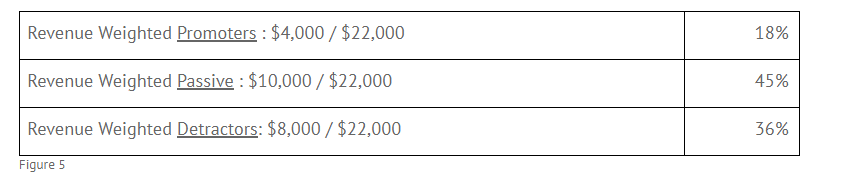
In our above sample dataset, we have two Promoters with a cumulative revenue of $4,000 (2x$2000). The cumulative revenue above totals $22,000. This number is derived from adding our three SMB customers and two Enterprise customers together (3 x $2,000 + 2 x $8,000)
To weigh the revenue between Promoters, Passives and Detractors, you take the total Promoter, Passive, and Detractor value and divide that by your cumulative revenue. Each of these will yield a percentage: 18%, 45%, and 36% respectively.
NPS vs. Revenue Weighted NPS Score
To calculate our new Revenue Weighted NPS, we take our new percentage of Promoters, 18% and subtract that from our new percentage of Detractors, 36%. Our new Revenue Weighted NPS is -18.
Compared to our Non-Revenue, traditional NPS score of +20, our new NPS becomes -18 when we add revenue weight to the NPS. Without this insight, most companies will continue to make decisions that are directly orthogonal to growth.
Using margins and profit in NPS
In the Revenue Weighted NPS example above, we used revenue as a metric to anchor and weigh the NPS. Companies in their lifecycle are generally interested in only two broad financial metrics, the Top Line and Bottom Line, synonymous to Revenue and Profit.
If your metric is based around profit, you can simply replace the model with your profit numbers. Rather than using the Lifetime Customer Values, use your Customer Gross Margin numbers for each Enterprise or SMB Customer.
NPS assumptions risks losing revenue
The NPS model assumes that all your detractors are at risk of leaving you for your competition. If you measure this with the revenue weighted NPS model, you can assign a clear dollar value of that risk. From above, we calculated the revenue at risk to be $8,000. This additional insight will help you prioritize your efforts and understand the impact.
Assigning value to each type of customer is critical to understanding and mitigating risk. After you have calculated and weighed your NPS, the next step is to figure out how to prioritize your actions. How do you know which interactions had the highest or lowest impact on the overall experience of all your customers? To help you answer this questions, QuestionPro CX offers an NPS Key Driver Analysis feature that will help you determine which attitudes and interactions have the biggest effect on your overall NPS. Like most people, you have limited time and resources. If you’re given a week to fix your top two priorities, it is critical that you know which determinants or variables will yield you the biggest return.
Impact of revenue and operational metrics on NPS
If you want to increase revenue and/or profitability, you must provide the appropriate tools and the underlying model that will help you increase revenue and profitability.
As Peter Drucker once said, “If you can’t measure it, you can’t manage it.”
Because NPS is generally seen as a specific profession’s metric, using the Revenue Weighted NPS will align the company, from executives to front-line employees. If you are someone who believes in customer experience, you can use the Revenue Weighted NPS to pitch internally to your management team and explain the revenue drivers using this NPS model.
 Survey Software
Easy to use and accessible for everyone. Design, send and analyze online surveys.
Survey Software
Easy to use and accessible for everyone. Design, send and analyze online surveys.
 Research Suite
A suite of enterprise-grade research tools for market research professionals.
Research Suite
A suite of enterprise-grade research tools for market research professionals.
 Customer Experience
Experiences change the world. Deliver the best with our CX management software.
Customer Experience
Experiences change the world. Deliver the best with our CX management software.
 Employee Experience
Create the best employee experience and act on real-time data from end to end.
Employee Experience
Create the best employee experience and act on real-time data from end to end.