
When you’re trying to understand what drives your customers’ choices, things can get complicated fast. Do they care more about price, design, or brand reputation? Conjoint analysis reveals how people trade off different product features, and conjoint factor analysis uncovers hidden patterns behind their choices. Together, you get a sharper lens for understanding what truly matters to your audience.
Conjoint analysis is widely used in applied sciences such as marketing, product management, and operations research to study decision-making and preferences.
In this blog, you’ll learn what conjoint factor analysis is, how it works, why researchers use it, and how you can apply it to your own studies.
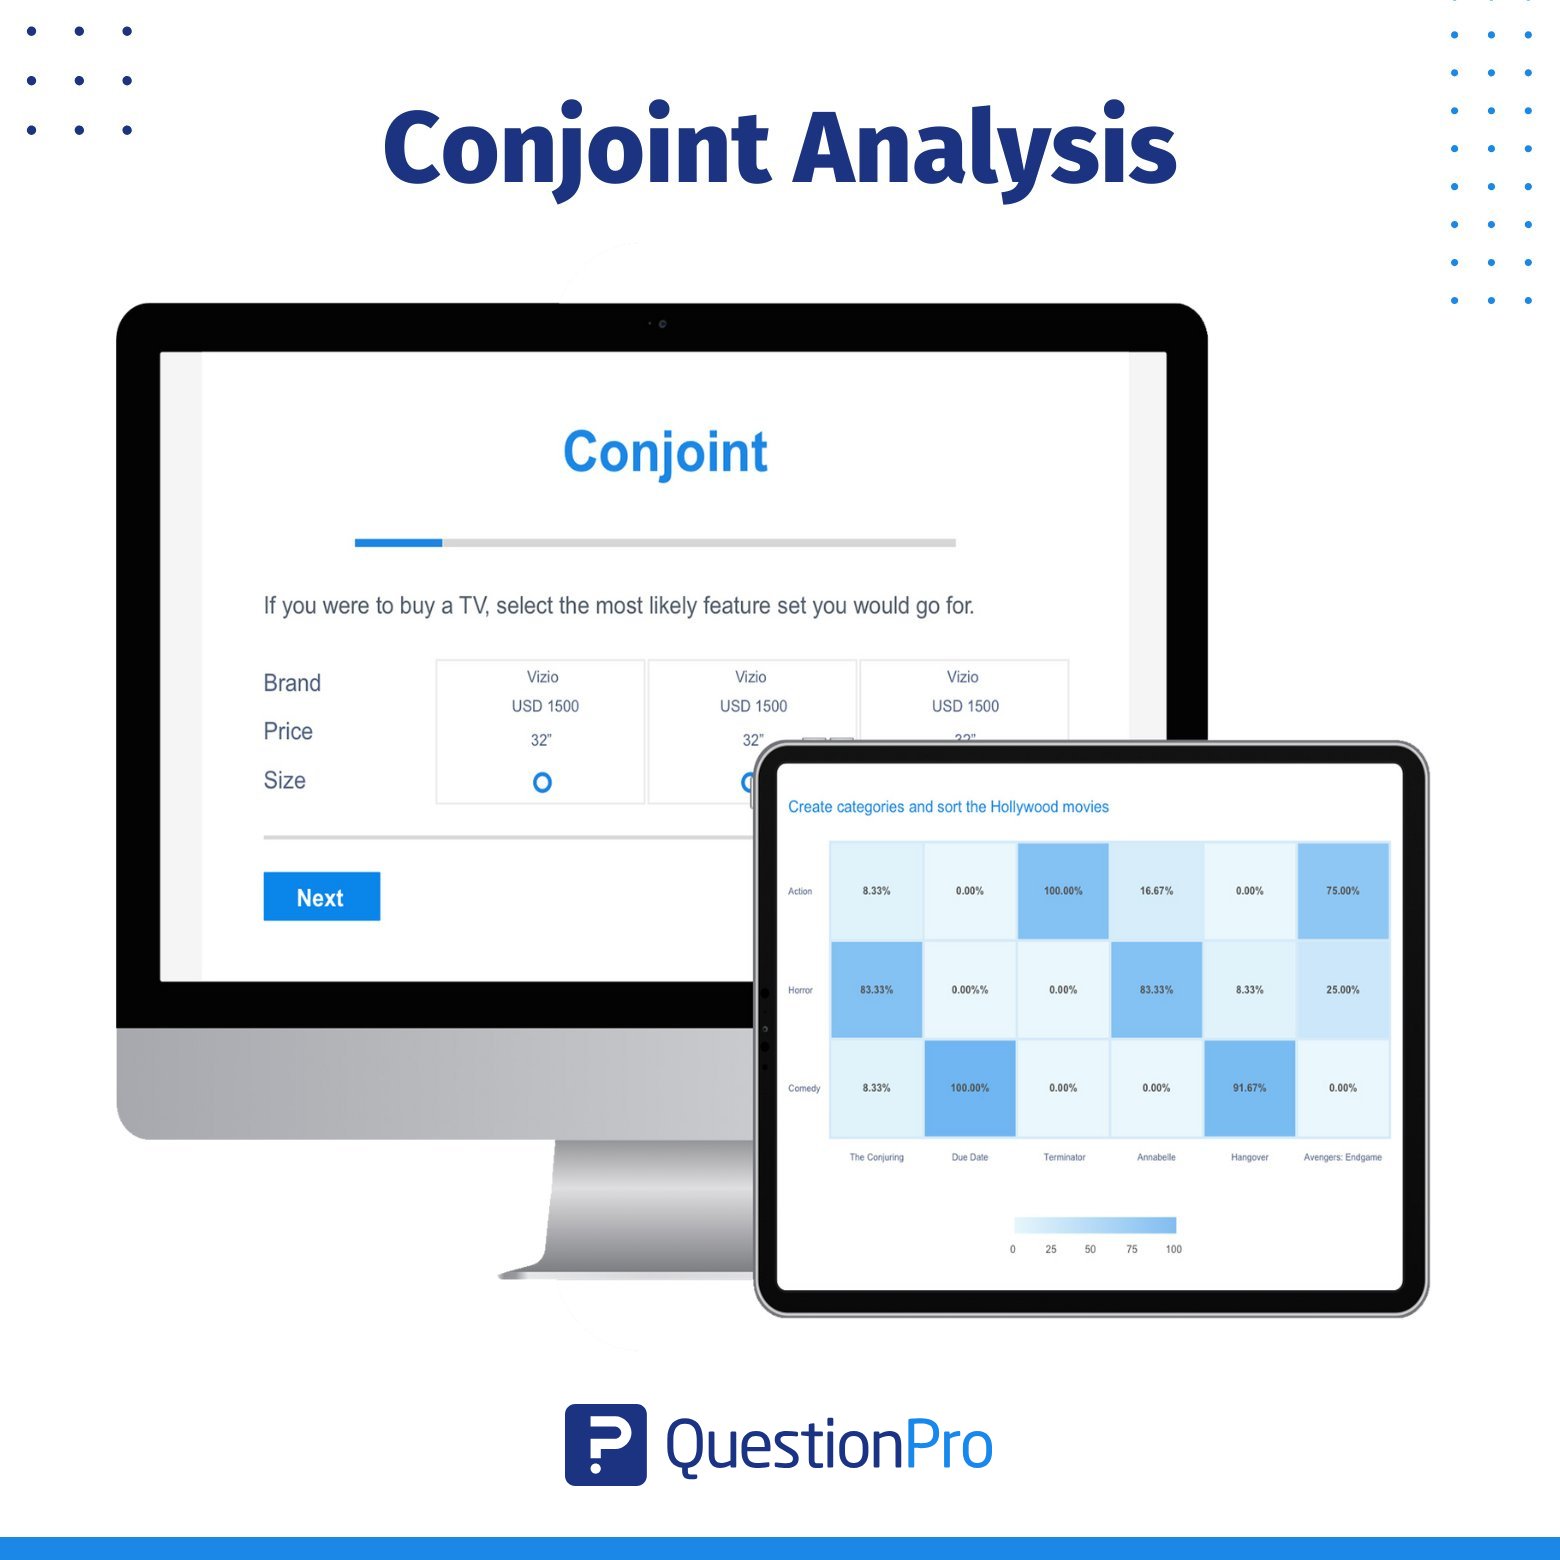
What is Conjoint Analysis in Market Research?
Conjoint analysis is a market research technique that helps you uncover how people make decisions when faced with multiple options. Instead of asking customers directly, “What’s most important to you?”, conjoint analysis simulates real-world trade-offs.
The real strength of conjoint analysis lies in its ability to break down why someone chooses one option over another. It quantifies the value (or utility) customers assign to each feature, showing you which attributes matter most and which ones barely move the needle. The method uses a model to simulate consumer preferences and forecast market behaviors.
For example, you might discover that your audience is willing to pay more for faster delivery but doesn’t care much about packaging design. This insight allows you to prioritize resources where they’ll have the biggest impact.
Businesses across industries use conjoint analysis techniques to:
- Test pricing strategies: How much customers are willing to pay for new products or subscription plans.
- Optimize product design: Which features or specifications customers consider “must-haves” versus “nice-to-haves.”
- Refine go-to-market strategies: The right mix of features, bundles, and price points to maximize appeal and drive sales.
- Enhance customer satisfaction research: What truly drives satisfaction beyond surface-level survey responses.
Conjoint analysis can also be used to estimate market share, revenue, and even profitability of new product or service designs, making it a valuable tool for business decision-making.
What is Factor Analysis in Conjoint Studies?
While conjoint analysis looks at trade-offs between product features, factor analysis takes a different approach. It’s a statistical method used to uncover the hidden dimensions (or “factors”) that influence how people respond to survey questions or data sets.
Instead of analyzing each variable in isolation, factor analysis groups related items together to reveal the underlying patterns. Factor analysis is often used in conjunction with regression analysis to predict how underlying factors influence customer outcomes.
If you ask customers a series of questions about satisfaction, trust, and loyalty, their answers might all be influenced by a single, deeper factor, such as “overall brand perception.” Factor analysis helps you identify and measure that hidden driver.
Here is how it works in market research:
- You collect responses on multiple survey items (e.g., product quality, customer service, ease of use).
- Factor analysis looks for correlations and clusters them into fewer, broader categories.
- These categories, called latent factors, represent the underlying forces that shape customer attitudes.
Factor analysis is especially useful when you want to simplify complex data without losing meaning. For example:
- Customer satisfaction research: This combines multiple survey questions into a single satisfaction score.
- Brand perception research: It reveals whether people see your brand as “innovative,” “trustworthy,” or “affordable.”
- Employee engagement surveys: They group responses into factors like motivation, leadership, and workplace culture.
By highlighting what truly drives responses, factor analysis makes large sets of survey data more actionable. It gives you clarity on the “why” behind patterns. It allows you to design more effective research, segment audiences more effectively, and identify insights that you might otherwise miss.
Recommended Read: Adaptive Conjoint Analysis: What is it, Types & User Cases
How Conjoint Factor Analysis Combines Both Methods
Now that you know what conjoint analysis and factor analysis are on their own, let’s talk about what happens when you bring them together.
Conjoint factor analysis builds on the foundation of conjoint measurement, a method developed in the 1960s to quantify how people value different attributes of products or services. It is a hybrid research method. The objective is to determine both the surface-level preferences and the deeper psychological drivers.
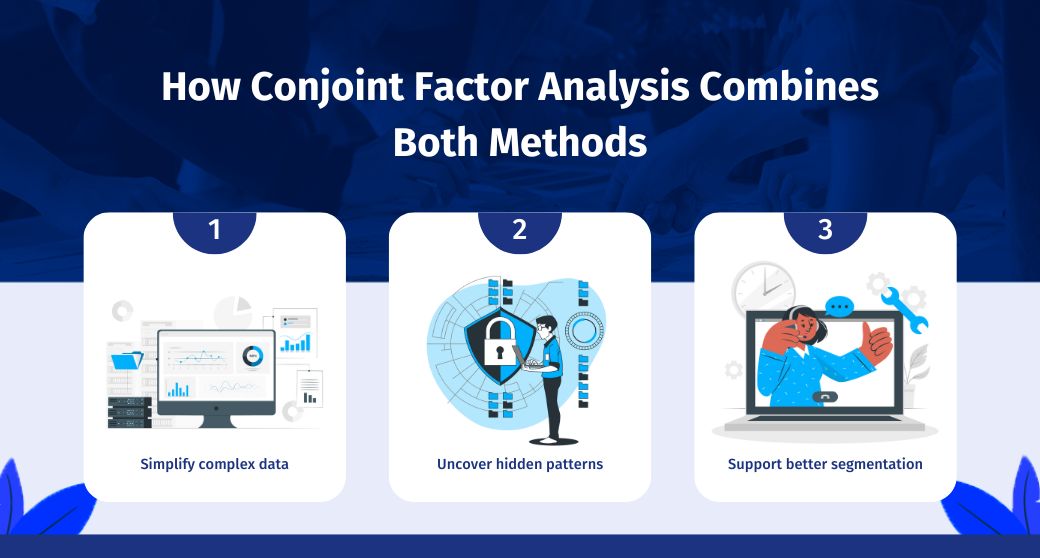
Here is why you should use conjoint factor analysis:
- Simplify complex data: If you’re testing many attributes, factor analysis can group them into broader categories before you run a conjoint study.
- Uncover hidden patterns: Instead of just knowing that “price” matters, you might learn that price is tied to a bigger factor like “perceived affordability.”
- Support better segmentation: By connecting conjoint utilities with factor-driven insights, you can identify distinct customer groups and what drives their decisions.
In conjoint factor analysis, the influence of different attributes on respondent choices is determined through the analysis. The output includes implicit valuations (utilities or part-worths) that quantify how respondents value each attribute.
Imagine you’re testing a new subscription app. Conjoint analysis can show that users prefer a mid-tier price plan with advanced features. However, with Factor analysis, you can reveal that their choices are actually shaped by two deeper factors: budget consciousness and technology adoption. Together, these insights tell you not just what customers choose, but why.
Why Use Conjoint Factor Analysis?
Many researchers are not yet familiar with conjoint factor analysis, but it offers significant advantages for understanding customer decision-making.
If you’re wondering why anyone would use conjoint factor analysis, the answer is simple: together, they create a more complete picture of customer decision-making than either method can provide alone.
Researchers can move beyond surface-level trade-offs and tap into the underlying motivations that drive behavior.
Here are the key reasons researchers use conjoint factor analysis:
- Handle complexity more effectively: When you have many attributes or survey items, factor analysis can simplify the data and make results easier to interpret and understand.
- Reveal hidden drivers: Conjoint analysis can tell you “price matters,” but factor analysis shows that price is really part of a bigger factor like perceived value or affordability.
- Improve segmentation: Pairing conjoint utilities with factor dimensions allows you to group customers into meaningful segments, like value-seekers, brand loyalists, or innovation adopters.
- Enhance predictive power: Together, they help forecast not just what customers will pick, but also why they’re likely to stick with that choice.
For you as a researcher, this means sharper insights, more actionable strategies, and stronger confidence in your findings.
Instead of simply knowing which features people like, you’ll understand the psychological patterns shaping their decisions. And that makes it easier to design products, pricing models, and marketing strategies that actually connect with your audience.
When to Use Conjoint Factor Analysis
When your research involves complex decisions or overlapping attributes, your project needs s conjoint factor analysis. By blending conjoint and factor analysis, you get insights that go beyond “what people choose” to reveal “why they choose it.”
Here are some situations you can use this approach:
- Multi-attribute products or services: If you’re testing products with a long list of features, factor analysis can group them into broader categories before you run conjoint, making the results easier to digest.
- Overlapping attributes: When several features are related (e.g., performance, speed, reliability), factor analysis helps you see the underlying theme driving preferences.
- Customer segmentation projects: If you need to divide your audience into meaningful groups, conjoint analysis with factor-based insights makes segmentation sharper and more actionable.
- Exploratory research: When you’re not entirely sure which features matter most, this hybrid approach helps uncover hidden drivers you might not have considered.
- Market forecasting: By connecting attribute utilities with psychological factors, you can better predict how customers will respond to new products, pricing changes, or feature updates.
For example, consider you’re researching electric vehicles. Conjoint analysis reveals that buyers prioritize battery range and price. Factor analysis could then show that these two preferences are part of a bigger factor, like cost efficiency. Together, you’d know not just which features matter, but the broader motivation behind the choice. It can help you design both the product and the marketing message more effectively.
This approach is most useful when you’re dealing with complex data-driven decision-making and need to uncover the hidden “why” behind customer preferences.
How to Conduct Conjoint Factor Analysis: Step-by-Step
If you’re ready to apply conjoint factor analysis in your own research, the good news is that the process is straightforward once you break it down. The key is to design your study carefully so you can capture both the trade-offs customers make and the underlying factors driving those choices.
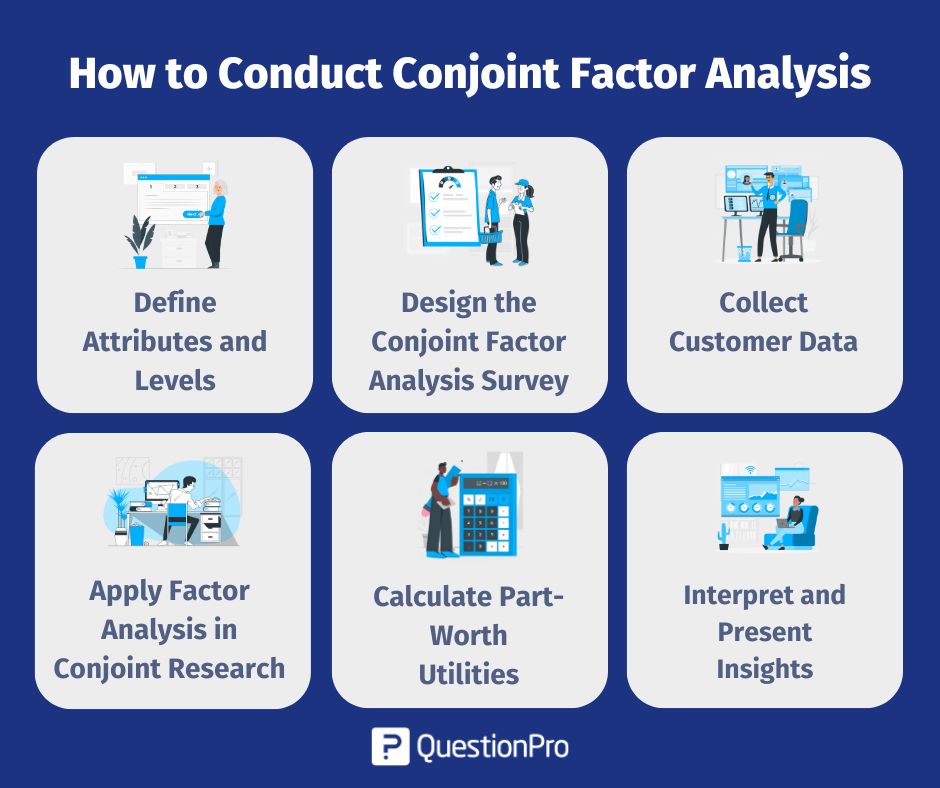
Step 1: Define Attributes and Levels
The first step is to decide which product or service features you want to test. Attributes can include anything from price, delivery speed, and warranty length to design, functionality, or customer support.
Include attributes that are actionable. Asking about features you can’t influence doesn’t help you make business decisions.
For example, in a subscription app, your attributes might be:
- Price: $5, $10, $15 per month
- Feature set: Basic, Standard, Premium
- Customer support: Email only, Live chat, 24/7 support
Each attribute should have multiple attribute levels, so respondents can experience realistic trade-offs. Too many attributes or too many attribute levels can make surveys overwhelming, but too few can miss important drivers of choice.
Step 2: Design the Conjoint Factor Analysis Survey
Designing the survey is where your study starts to take shape. This step is all about creating realistic choice scenarios that reveal how customers actually make decisions rather than just what they say matters.
If you conduct your survey correctly, your survey will provide clean, actionable data for both conjoint and factor analysis. It’s essential to design the survey in a way that engages the survey taker, as this leads to higher-quality data and more reliable insights.
The type of conjoint survey depends on your research goal:
- Choice-Based Conjoint (CBC): Participants pick one option from a set of alternatives. This simulates real-world buying decisions and is the most commonly used method.
- Rating-Based Conjoint: Respondents rate or rank each product profile. This is useful when you want to capture the intensity of preference across multiple options.
- Adaptive Conjoint: The survey adjusts based on previous answers to focus on the most relevant features for each participant.
CBC is usually the best starting point because it mirrors how people make real-life choices.
Create combinations of products (profiles) for respondents to evaluate. Each respondent will see several profiles with varying combinations and will make choices based on their preferences. The key outcome here is respondent choice, which provides valuable data on how different attributes influence decision-making.
Use a survey platform like QuestionPro to build choice tasks. Respondents will see different combinations of features and select the one they prefer. This is where conjoint analysis captures the trade-offs people make.
Step 3: Collect Customer Data for Conjoint Factor Analysis
Once your conjoint survey is designed, the next step is to get it in front of the right people. Collecting high-quality data is critical because the insights you’ll gain from both conjoint and factor analysis depend entirely on the participants you include.
Ensuring an adequate sample size is essential for statistical validity, especially in complex designs like partial profile choices. A larger sample maintains statistical power and reliability.
For a new fitness app, your target audience can be adults aged 18–45 who exercise at least three times a week. Use personas, past customer data, or segmentation criteria to define your audience.
Select channels that best reach your target audience and encourage genuine customer engagement. Options include:
- Email campaigns to existing customers
- Social media advertising targeting specific demographics
- Online panels that provide access to pre-screened participants
- Embedded surveys on websites or apps
If possible, mix channels to enhance diversity in your sample.
For choice-based conjoint analysis, aim for at least 100–300 respondents per key segment to achieve a sufficient sample size. More is better if you plan to analyze multiple subgroups.
Step 4: Apply Factor Analysis in Conjoint Research
Once you’ve collected your survey data, it’s time to dig deeper with factor analysis. Before running factor analysis, make sure your data is clean and structured:
- Check for missing or inconsistent responses and handle them appropriately.
- Standardize attribute ratings if you’re using rating-based conjoint data.
- Encode categorical attributes numerically if needed.
A well-prepared dataset ensures that the factors you extract are meaningful, stable, and interpretable.
There are multiple ways to conduct factor analysis, depending on your data and objectives:
- Exploratory Factor Analysis (EFA): Useful when you don’t know how many underlying factors exist. It helps discover patterns in responses.
- Confirmatory Factor Analysis (CFA): Use this if you have a hypothesis about how attributes should cluster together and want to test it.
If you believe features like “fast delivery” and “easy returns” belong to a single factor called convenience, CFA can confirm that assumption.
Factor analysis groups correlated attributes together into latent factors. These are not immediately observable, but they represent broader themes that influence preferences.
Look at factor loadings to see which attributes contribute most to each factor. For example, in a subscription app survey:
- Factor 1: Cost-effectiveness includes price, discounts, and feature limitations
- Factor 2: User experience includes app usability, support quality, and onboarding ease
- Factor 3: Advanced functionality includes premium features and customization options
After extraction, assign factor scores to respondents. These scores quantify how strongly each respondent values a particular latent factor.
Step 5: Estimate Part-Worth Utilities
Once your survey responses are collected and factor analysis is complete, it’s time to calculate part-worth utilities. These numbers show how much each attribute or feature level influences customer choices, giving you a quantitative view of preferences.
Part-worth utilities assign a numerical value to each attribute level, indicating its relative importance in decision-making. The importance of each attribute is determined through analysis. Higher values mean stronger preference; lower values indicate less influence.
In the given example of a streaming service survey, you might find:
- Price: $5 → +20, $10 → +10, $15 → -15
- Feature set: Basic → -10, Standard → +5, Premium → +15
- Customer support: Email only → -5, Live chat → +5, 24/7 support → +10
These implicit valuations tell you that participants strongly prefer lower prices, but premium features and 24/7 support also positively impact choices.
Step 6: Interpret the Results Together
Once you have both conjoint and factor analysis results, it’s time to combine them for a full picture.
By mapping part-worth utilities to latent factors, you can:
- Understand key trade-offs between different attributes and motivations
- Identify patterns across different customer segments
- Make data-driven decisions on product design, pricing, and marketing
The conjoint analysis model integrates utilities and factor scores to provide a comprehensive view of how respondents value different attributes. In the given example, you might see that for a subscription app, respondents prefer:
- Mid-tier pricing ($10/month) → highest utility
- Standard features → moderate utility
- 24/7 support → high utility
You might see that mid-tier pricing is popular because it aligns with a broader cost-effectiveness factor, while 24/7 support appeals to the user experience factor. Together, these insights guide smarter, targeted strategies.
Understand More About: Beginners’ guide to choice-based Conjoint Analysis
Benefits of Conjoint Factor Analysis for Businesses
Conjoint factor analysis gives you a clearer, deeper, and more actionable understanding of customer preferences.
- Uncover true customer priorities: Reveals not just what features matter, but why they matter.
- Simplify complex data: Reduces many attributes into interpretable factors, making decision-making easier.
- Improve segmentation: Helps identify distinct customer groups and their unique drivers.
- Support product and pricing strategy: Shows which combinations of features and price points maximize appeal.
- Enhance predictive insights: Provides a stronger basis for forecasting how customers will respond to new products or changes.
Challenges of Conjoint Factor Analysis
While conjoint factor analysis provides powerful insights, it’s important to be aware of potential challenges so you can plan accordingly.
- Complexity of design: Creating surveys with multiple attributes and levels can be tricky and time-consuming. Developing effective experimental designs is a key challenge, as poor design can lead to confusing tasks for respondents.
- Data requirements: Reliable results require a sufficient number of respondents, especially when segmenting or analyzing multiple factors. Small samples can skew insights.
- Interpretation can be challenging: Combining conjoint utilities with latent factors adds analytical depth, but it also requires expertise in applied statistics to accurately interpret the results.
- Potential for respondent fatigue: Long or complex surveys can cause participants to lose focus, leading to less accurate data.
- Resource-intensive: Running the survey, cleaning data, performing factor analysis, and interpreting results can require a significant amount of time and specialized tools.
Also Read: Conjoint Analysis Survey Template + Sample Questionnaire
Conjoint Factor Analysis vs. Traditional Conjoint Analysis: Key Differences
When you’re deciding how to study customer preferences, it is helpful to understand the difference between traditional conjoint analysis and conjoint factor analysis. Both aim to uncover what drives choices, but the latter goes a step further by revealing the underlying factors or motivations behind those preferences.
Here’s a clear comparison to see how they differ:
| Feature | Traditional Conjoint Analysis | Conjoint Factor Analysis |
| Purpose | Product design, pricing, and basic market research | Measures features and uncovers underlying latent factors driving those choices |
| Data Complexity | Focuses on direct trade-offs between attributes | Handles larger, more complex datasets by grouping correlated attributes into factors |
| Insight Level | Shows what customers prefer | Shows what and why they prefer it |
| Segmentation | Can segment based on observed preferences | Enables deeper segmentation by combining utilities with latent factor scores |
| Applications | Measures that feature or attributes influence choices | Product design, pricing, marketing strategy, predictive modeling, advanced segmentation |
| Analytical Effort | Moderate; standard conjoint modeling | Product design, pricing, marketing strategy, predictive modeling, and advanced segmentation |
How QuestionPro Supports Conjoint Factor Analysis
Running conjoint factor analysis can seem complex, but platforms like QuestionPro make it far easier to design, execute, and analyze your studies. By combining powerful survey tools with advanced analytics, QuestionPro lets you focus on insights rather than technical hurdles.
- Easy survey design: Build choice-based or rating-based conjoint surveys with simplicity, including attributes, levels, and realistic product profiles.
- Advanced analytics: Automatically calculate part-worth utilities and run factor analysis on your collected data, giving you both what customers prefer and why.
- Segmentation and filtering: Analyze results by demographic or behavioral segments to identify distinct customer groups and their preferences.
- Visualization tools: Generate charts, heatmaps, and interactive dashboards that clearly show utilities, factors, and patterns across segments.
- Predictive modeling: Simulate new product configurations or pricing strategies using part-worth utilities and factor-driven insights to forecast customer choice.
- Time-saving automation: Automates calculations, randomization, and reporting, reducing the manual effort required for complex conjoint studies.
Suppose you’re testing a new subscription app. QuestionPro makes it easy to create choice tasks with multiple pricing and feature combinations. You can also run factor analysis to uncover hidden drivers, such as cost-effectiveness or user experience. Additionally, the platform allows you to simulate adoption rates for different subscription plans.
Conclusion
Conjoint factor analysis is a powerful way to understand not just what your customers prefer, but why they make those choices. By combining the trade-off insights from conjoint analysis with the hidden patterns revealed by factor analysis, you gain a multidimensional view of customer decision-making.
This approach helps you design products, optimize pricing, segment audiences, and create marketing strategies that truly resonate. Platforms like QuestionPro make it easier than ever to run conjoint factor analysis studies. You can analyze results quickly and turn insights into action.
Frequently Asked Questions (FAQs)
Answer: Conjoint factor analysis combines conjoint analysis and factor analysis to reveal not only which features customers prefer, but also the underlying motivations driving their choices. It’s a hybrid approach for deeper, multidimensional insights.
Answer: Traditional conjoint analysis focuses on trade-offs between features. Conjoint factor analysis goes further by uncovering latent factors—the hidden dimensions that influence preferences—allowing for richer segmentation and predictive insights.
Answer: Use it when you have complex products or services, overlapping attributes, or need to understand the deeper drivers behind customer decisions. It’s especially useful for segmentation, pricing, and product optimization.
Answer: Sample size depends on the number of attributes, levels, and segments you want to analyze. A general rule is 100–300 respondents per key segment to ensure reliable results. Larger samples improve precision.
Answer: Yes. Platforms like QuestionPro automate much of the statistical heavy lifting, including part-worth utility estimation and factor extraction, letting you focus on interpreting insights and making data-driven decisions.
Answer: It helps you understand customer priorities, simplify complex data, improve segmentation, optimize products and pricing, and predict market behavior, all in a single framework.