



Cluster analysis is a statistical method that groups a set of objects, such as customers or survey respondents, into smaller clusters based on shared characteristics, so that each group behaves differently from the others.
Brands and researchers rely on it to bucket large data sets into segments that actually mean something, instead of treating every customer as identical. That grouping shows up everywhere from retail demographics to fraud detection to sports performance analysis.
This guide explains what cluster analysis is, the main clustering methods, how to choose between them, and where the technique runs into limits.
What is cluster analysis?
Cluster analysis is a statistical method that groups objects into clusters so that items within a cluster are more similar to each other than to items in other clusters.
It sits inside exploratory data analysis, which means researchers use it to spot trends and validate hypotheses in data they have already collected, rather than to prove a theory from scratch. The method shows up across pattern recognition, machine learning, market research, data cleaning, and bioinformatics. Because the underlying goal is the same everywhere: find groups that behave differently, without deciding those groups in advance.
A common example is a bank using transaction data to cluster claims by pattern. It helps investigators flag likely fraud and understand how honest customers behave differently from fraudulent ones.
How is cluster analysis different from market segmentation?
Cluster analysis is the statistical technique used to find groups in data, while market segmentation is the business practice of dividing customers into target groups. It often uses cluster analysis as one of its tools. Research firm Ipsos makes this same distinction, noting that clustering always produces a grouping, but that grouping only becomes a useful segmentation once it is statistically tested and profiled against real business goals.
Segmentation can also rely on simple, predefined rules, such as splitting customers by age bracket or region. Customer segmentation built on cluster analysis instead lets the data reveal groupings that a predefined rule would miss, such as a segment defined by a combination of purchase frequency, price sensitivity, and support ticket history that no single demographic field would capture on its own.
What are the main cluster analysis methods?
The four main cluster analysis methods are hierarchical clustering, centroid-based clustering, distribution-based clustering, and density-based clustering. Each groups data differently and fits different kinds of problems.
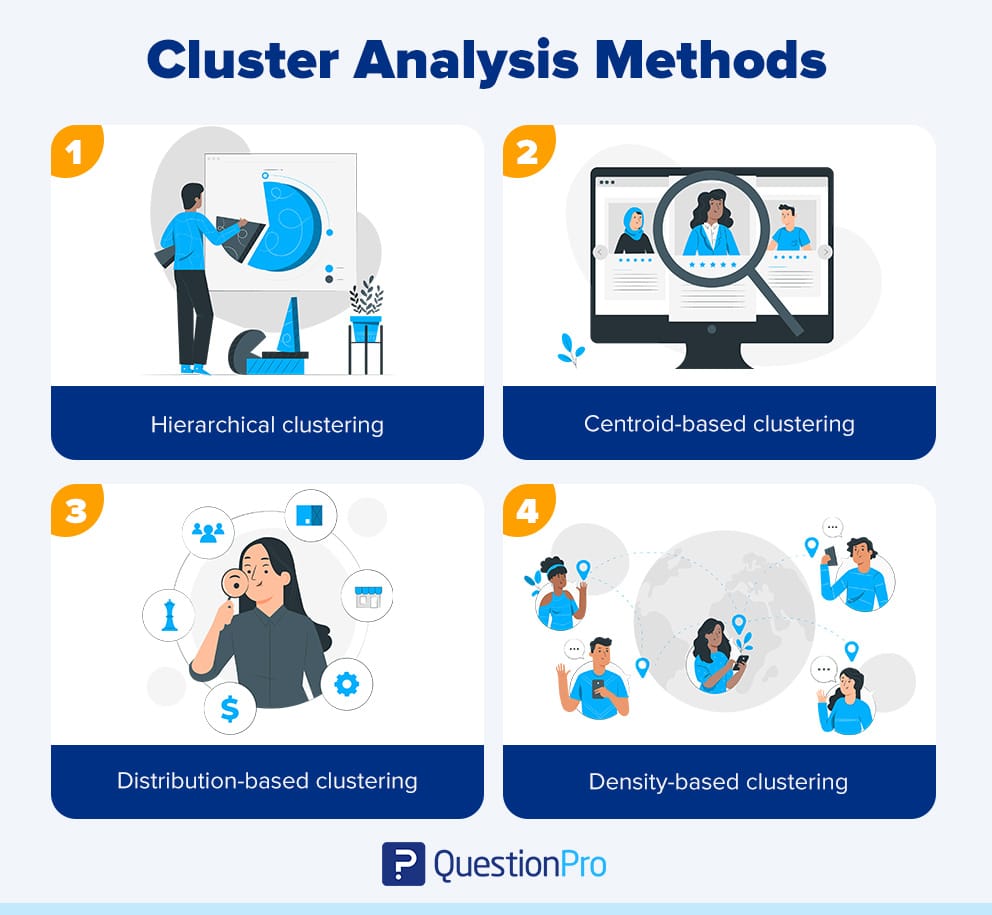
1. Hierarchical clustering
Hierarchical clustering, also called connectivity-based clustering, groups data points that share similar characteristics, then links those groups to other clusters with related properties. The core idea is that objects closer together are more related than objects farther apart.
A divisive version works in reverse, starting with one large data set and splitting it into progressively smaller clusters based on defined linkage criteria. There is no single correct way to partition the data in this method. It makes it flexible but also more subjective to interpret.
2. Centroid-based clustering
Centroid-based clustering defines each cluster by a single central point, most commonly using the k-means algorithm. Data points are grouped around the center that minimizes the distance between them and that centroid.
The main drawback is that the number of clusters, or k, has to be set in advance. This limits how the data gets represented if that initial number turns out to be wrong.
3. Distribution-based clustering
Distribution-based clustering groups data into clusters based on the statistical distribution the data points appear to follow. It relies on random sampling to build sample sets from a distribution and works best when a business needs to show a correlation between specific attributes and objects.
The tradeoff is that objects get grouped according to predefined attributes, which can introduce bias if the real data does not actually fit the assumed distribution.
4. Density-based clustering
Density-based clustering, most commonly run through the DBSCAN algorithm, defines clusters based on how densely packed data points are relative to the rest of the data set. Points in sparse areas are treated as noise or border points, since they typically separate one cluster from another.
The limitation here is that the method needs a noticeable drop in density to mark where one cluster ends and another begins, which can feel arbitrary in data sets with gradual, rather than sharp, transitions.
How do you choose the right cluster analysis method?
Choosing a clustering method depends on how much you already know about your data’s structure. Since there is no universally correct choice, it is usually decided experimentally unless a clear mathematical reason points to one method.
| If your data… | Consider using |
|---|---|
| Has no predetermined number of groups | Hierarchical clustering |
| Needs a fast, simple grouping with a known group count | Centroid-based (k-means) clustering |
| Is expected to follow a known statistical distribution | Distribution-based clustering |
| Contains noise, outliers, or irregular shapes | Density-based clustering |
Many teams run more than one method on the same data set and compare the results. No single method is guaranteed to reveal the most useful grouping on the first try.
What are real-world examples of cluster analysis?
Cluster analysis shows up in retail marketing, sports science, healthcare, and fraud detection, wherever a business needs to group people or events by shared behavior rather than a single label.
Cluster analysis in retail marketing
Retailers use cluster analysis to understand purchase behavior by grouping customers on factors like geographic location, age, and household income. These clusters show how different consumer groups make different purchase decisions, which retailers then use to target marketing spend more precisely and reduce customer churn.
Cluster analysis in sports sciences
Coaches, scouts, and sports scientists use cluster analysis to group players by body type, age, position, and performance metrics. This grouping helps teams see how similarly built or positioned athletes perform under comparable conditions. This supports scouting, training design, and injury prevention decisions. Pairing this with qualitative input, such as focus group sessions with coaching staff, often explains why a cluster performs the way it does, not just that it does.
Cluster analysis in fraud detection
Financial institutions cluster transaction and claims data to separate typical customer behavior from unusual patterns. Clusters that fall far outside the normal behavioral group often get flagged for manual review. This speeds up fraud investigation without requiring every transaction to be checked by hand.
What are common mistakes in cluster analysis?
The most common mistake is choosing a clustering method based on familiarity rather than on what the data’s structure actually calls for.
Other frequent mistakes include:
- Fixing the number of clusters before checking whether the data actually supports that count
- Skipping data cleaning, which lets outliers distort every cluster’s boundaries
- Treating clusters as permanent instead of re-running the analysis as new data comes in
- Assuming a cluster is meaningful without checking whether it holds up on a second data sample
- Mixing variables measured on very different scales without standardizing them first
How can QuestionPro support cluster analysis?
QuestionPro supports cluster analysis by giving research teams a platform to collect clean survey data. It also helps run advanced analysis without exporting everything to a separate statistics tool.
Using Market Research Software built for this kind of work. Teams can gather both qualitative and quantitative data from the same audience and then segment respondents based on patterns the data reveals, rather than relying only on predefined demographic buckets.
Cluster analysis turns raw data into decisions
Cluster analysis is not about running a single formula and calling it done. It is about picking the method that matches your data’s structure, testing the results, and staying open to re-running the analysis as new information comes in.
Done well, it turns a large, undifferentiated data set into groups a business can actually act on, whether that means a sharper marketing segment, a faster fraud flag, or a clearer read on athletic performance.
Frequently Asked Questions (FAQs)
No. Classification sorts data into categories that are already known and labeled in advance, while cluster analysis discovers groups directly from the data without any predefined labels. Cluster analysis is considered unsupervised, and classification is considered supervised.
There is no fixed number, and it depends heavily on the method and the business question being asked. Many analysts test several cluster counts and compare results using statistical measures before settling on the number that best explains the data’s structure.
Yes. Survey responses on attitudes, preferences, and behaviors are a common input for cluster analysis, especially in market research. Clustering survey respondents often reveals segments that a single demographic question would never surface on its own.
Many statistical software packages and research platforms include built-in clustering tools that do not require writing code, though teams with more advanced needs sometimes use programming languages for finer control. The right choice depends on the complexity of the analysis and the team’s technical resources.
Retail, financial services, healthcare, and technology companies in the USA are among the heaviest users of cluster analysis, largely because each industry generates large volumes of customer or transaction data suited to segmentation. Sports organizations and academic researchers also use it regularly for performance and behavioral studies.



