Our minds can do some brilliant things. For example, it can memorize the jingle of a pizza truck. The louder the jingle, the closer the pizza truck is to us. Who taught us that? Nobody! We relied on our understanding and came to a conclusion. We don’t stop there, do we? If there are multiple pizza trucks in the area and each one has a different jingle, we would memorize it all and relate the jingle to its pizza truck.
This is what correlational research precisely is, establishing a relationship between two variables, “jingle” and “distance of the truck” in this particular example. The correlational study looks for variables that seem to interact with each other. When you see one variable changing, you have a fair idea of how the other variable will change.
What is Correlational research?
Correlational research is a type of non-experimental research method in which a researcher measures two variables and understands and assesses the statistical relationship between them with no influence from any extraneous variable. In statistical analysis, distinguishing between categorical data and numerical data is essential, as categorical data involves distinct categories or labels, while numerical data consists of measurable quantities.
Correlational Research Example
The correlation coefficient shows the correlation between two variables (A correlation coefficient is a statistical measure that calculates the strength of the relationship between two variables), a value measured between -1 and +1.
When the correlation coefficient is close to +1, there is a positive correlation between the two variables. If the value is relative to -1, there is a negative correlation between the two variables. When the value is close to zero, then there is no relationship between the two variables.
Let us take an example to understand correlational research.
Consider hypothetically, a researcher is studying a correlation between cancer and marriage. In this study, there are two variables: disease and marriage. Let us say marriage has a negative association with cancer. This means that married people are less likely to develop cancer.
However, this doesn’t necessarily mean that marriage directly avoids cancer. In correlational research, it is not possible to establish the fact, what causes what. It is a misconception that a correlational study involves two quantitative variables. However, the reality is two variables are measured, but neither is changed. This is true independent of whether the variables are quantitative or categorical.
Types of correlational research
Mainly three types of correlational research have been identified:
1. Positive correlation: A positive relationship between two variables is when an increase in one variable leads to a rise in the other variable. A decrease in one variable will see a reduction in the other variable. For example, the amount of money a person has might positively correlate with the number of cars the person owns.
2. Negative correlation: A negative correlation is quite literally the opposite of a positive relationship. If there is an increase in one variable, the second variable will show a decrease, and vice versa.
For example, being educated might negatively correlate with the crime rate when an increase in one variable leads to a decrease in another and vice versa. If a country’s education level is improved, it can lower crime rates. Please note that this doesn’t mean that lack of education leads to crimes. It only means that a lack of education and crime is believed to have a common reason – poverty.
3. No correlation: There is no correlation between the two variables in this third type. A change in one variable may not necessarily see a difference in the other variable. For example, being a millionaire and happiness are not correlated. An increase in money doesn’t lead to happiness.
QuestionPro recently published a blog about correlation matrix. Explore to learn about it.
Characteristics of correlational research
Correlational research has three main characteristics. They are:
- Non-experimental: The correlational study is non-experimental. It means that researchers need not manipulate variables with a scientific methodology to either agree or disagree with a hypothesis. The researcher only measures and observes the relationship between the variables without altering them or subjecting them to external conditioning.
- Backward-looking: Correlational research only looks back at historical data and observes events in the past. Researchers use it to measure and spot historical patterns between two variables. A correlational study may show a positive relationship between two variables, but this can change in the future.
- Dynamic: The patterns between two variables from correlational research are never constant and are always changing. Two variables having negative correlation research in the past can have a positive correlation relationship in the future due to various factors.
Data collection
The distinctive feature of correlational research is that the researcher can’t manipulate either of the variables involved. It doesn’t matter how or where the variables are measured. A researcher could observe participants in a closed environment or a public setting.

Researchers use two data collection methods to collect information in correlational research.
01. Naturalistic observation
Naturalistic observation is a way of data collection in which people’s behavioral targeting is observed in their natural environment, in which they typically exist. This method is a type of field research. It could mean a researcher might be observing people in a grocery store, at the cinema, playground, or in similar places.
Researchers who are usually involved in this type of data collection make observations as unobtrusively as possible so that the participants involved in the study are not aware that they are being observed else they might deviate from being their natural self.
Ethically this method is acceptable if the participants remain anonymous, and if the study is conducted in a public setting, a place where people would not normally expect complete privacy. As mentioned previously, taking an example of the grocery store where people can be observed while collecting an item from the aisle and putting in the shopping bags. This is ethically acceptable, which is why most researchers choose public settings for recording their observations. This data collection method could be both qualitative and quantitative.
If you need to know more about qualitative data, you can explore our newly published blog, “Examples of Qualitative Data in Education.”
02. Archival data
Another approach to correlational data is the use of archival data. Archival information is the data that has been previously collected by doing similar kinds of research. Archival data is usually made available through primary research.
In contrast to naturalistic observation, the information collected through archived data can be pretty straightforward. For example, counting the number of people named Richard in the various states of America based on social security records is relatively short.
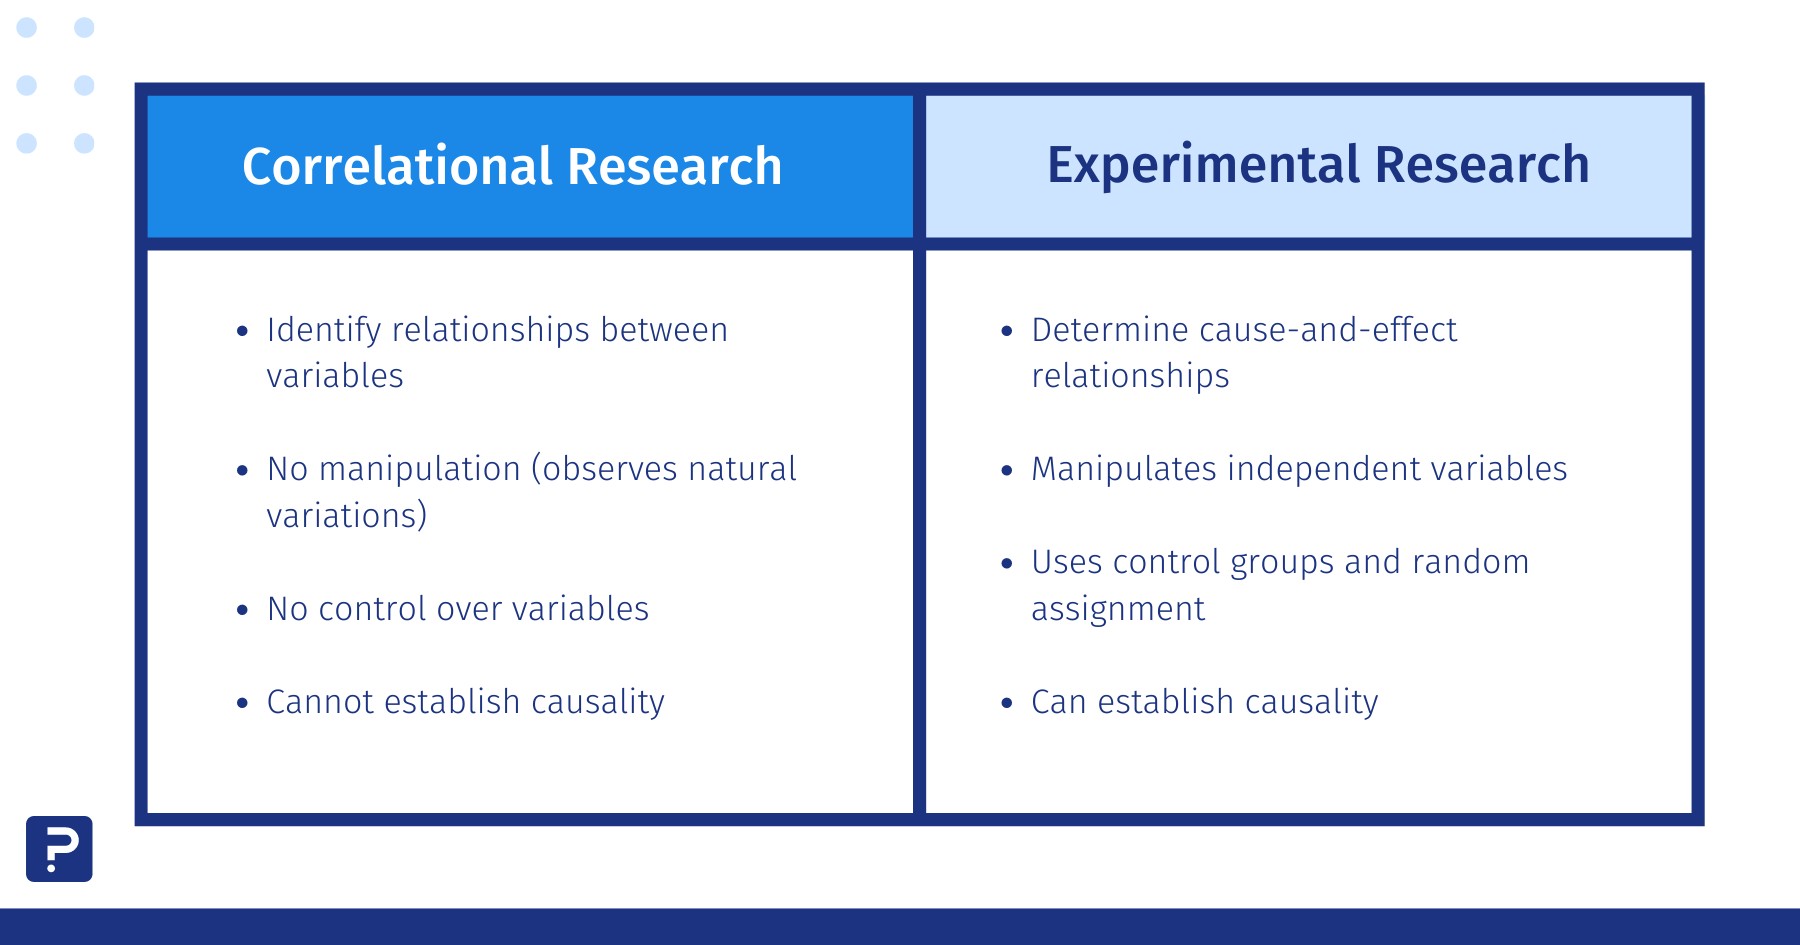
Correlational Research vs Experimental Research
Correlational Research and Experimental Research are two research methods that are often related or come to mind for researchers when designing a research project, especially because both use quantitative methods. However, each has unique characteristics to consider when choosing the ideal method for your needs.
Correlational Research: The goal of this type of research is to examine how variables relate to each other without establishing a cause-and-effect relationship. Researchers typically observe variables occurring naturally and measure their relationship using correlation coefficients that range from -1 to +1.
Experimental Research: The main objective of this type of research is to establish causal relationships between variables. To do this, researchers manipulate the independent variables to observe the effects of this manipulation on the dependent variables (DV). This is done with certain controls and standards to minimize bias.
Conclusion on Correlational Research
We hope this information helps you choose the ideal method for your next study. The correlational research method is a great alternative if conducting an experimental investigation proves more complex, and what you need is to measure the statistical relationship between two variables.
Need help? Using the right tool can make all the difference. Uncover the insights that matter most with QuestionPro’s research platform and start obtaining results that allow you to reach valuable conclusions and make decisions that truly impact your goals.
Research to make better decisions! Start a free trial today. No credit card is required.