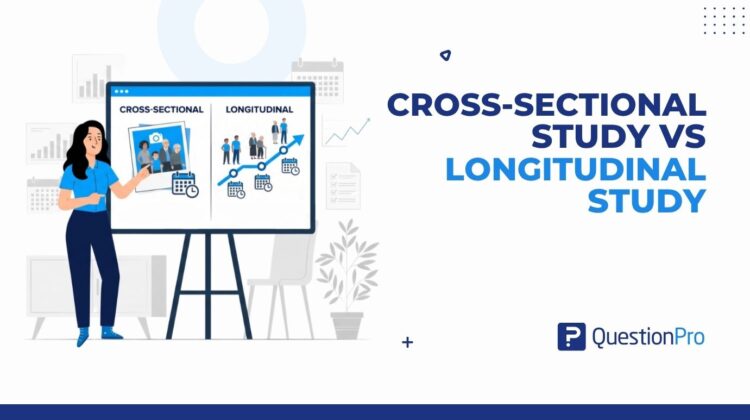
A cross-sectional study vs longitudinal study comes down to one question. Do you measure people once, or do you measure them again and again? A cross-sectional study captures a population at a single point in time. A longitudinal study follows the same people over weeks, years, or decades.
Both are observational designs, so researchers record what happens without changing participants’ conditions. The choice still shapes your budget, your timeline, and how strong your conclusions can be.
In this guide, we’ll compare the two designs side by side, walk through US examples, and show you how to choose.
What is the difference between a cross-sectional and a longitudinal study?
A cross-sectional study measures many different people once. A longitudinal study measures the same people repeatedly. The first describes what is true right now, and the second shows how things change and which event came first.
| Feature | Cross-sectional study | Longitudinal study |
|---|---|---|
| Timing | One point in time | Repeated points over time |
| Participants | Different people in each group | The same people in every wave |
| Best for | Prevalence, comparisons, segments | Change, trends, sequence of events |
| Cause and effect | Cannot establish it | Can point toward it |
| Time to results | Days to weeks | Months to decades |
| Cost | Lower | Higher |
| Main risk | Reads correlation as cause | Participants drop out over time |
| Example | A 2,000-person survey on remote work preferences | Surveying the same 2,000 workers every year for five years |
What is a cross-sectional study?
A cross-sectional study is an observational research design that collects data from a population, or a representative sample of it, at one point in time. Think of it as a photograph. It shows who is in the frame today, not how they got there.
Researchers use it to measure prevalence, which is the share of a population with a given trait or condition. They also use it to compare groups, such as age bands, regions, or income levels, and to test whether two variables are associated. Because it needs only one round of data collection, it is fast and affordable.
The limitation is direction. Imagine a snapshot finds that joggers have lower cholesterol than non-joggers. It cannot tell you whether jogging lowered cholesterol or whether people with healthy cholesterol were simply more likely to jog. For a deeper look at this design, see our guide to the cross-sectional study.
What is a longitudinal study?
A longitudinal study is an observational design that measures the same participants repeatedly over an extended period. Researchers call each measurement round a wave. Because every wave links back to the same person, researchers can see change within individuals, not just differences between groups.
That makes it the stronger choice when timing matters. It can show which event happened first, how fast something changes, and whether early conditions predict later outcomes. Our full guide to the longitudinal study covers the design in detail.
Longitudinal research takes several forms:
- Panel study: The same individuals answer repeated surveys. See how a panel survey works in practice.
- Cohort study: A group that shares a trait, such as birth year, is tracked together.
- Prospective study: Participants are enrolled now and followed forward.
- Retrospective study: Researchers look back at records that already exist.
How do repeated cross-sectional, panel, cohort, and time-series studies differ?
These four terms are often confused. The deciding factor is whether the same people are measured each time. A repeated cross-sectional study draws a fresh sample every wave, so it tracks population trends but not individual change. A panel or cohort study keeps the same people.
| Design | Who is measured each wave | What it shows | Example |
|---|---|---|---|
| Repeated cross-sectional | A new sample each time | Population-level trends | An annual customer satisfaction survey with a fresh sample |
| Panel | The same individuals | Individual-level change | The same shoppers surveyed every quarter |
| Cohort | The same group sharing a trait | Outcomes for that group | Everyone born in 1980 followed for decades |
| Time series | One unit or measure, at regular intervals | Pattern of one metric over time | Monthly unemployment rate |
A time series is a sequence of values for a single measure, recorded at regular intervals. A repeated cross-sectional study is sometimes called a trend study. It remains a cross-sectional design, because no individual is tracked from one wave to the next.
What do real-world examples of each design look like?
Federal health and labor agencies run some of the best-known studies of both types. Each example below matches the design to the question it needed to answer.
Cross-sectional example: NHANES
The National Health and Nutrition Examination Survey (NHANES) is, in the words of the US Department of Health and Human Services, a series of cross-sectional, nationally representative health examination surveys. It has run continuously since 1999. Data come out in two-year cycles.
Each cycle pairs home interviews with physical exams and lab tests. The result is a reliable picture of national health, such as how common diabetes or high blood pressure is.
Why it fits a cross-sectional design:
- Every cycle samples new people, so no one is followed.
- The goal is national prevalence, not individual change.
- Results arrive in two-year cycles, not decades.
Longitudinal examples: Framingham and NLSY79
The Framingham Heart Study began in 1948 in Massachusetts and enrolled 5,209 men and women. Researchers examined participants about every two years. That repeated tracking is how researchers linked risk factors such as blood pressure and cholesterol to later heart disease.
The Bureau of Labor Statistics runs the National Longitudinal Survey of Youth 1979. It follows 12,686 people born between 1957 and 1964. Interviews ran yearly until 1994 and every two years after that.
What each study tracks:
- Framingham: Heart health, from risk factors to later disease.
- NLSY79: Education, early jobs, and long-term careers.
Business example: Employee engagement
A company runs one engagement survey and finds that employees with longer tenure score lower. That is cross-sectional. It cannot say whether engagement falls over time or whether disengaged people simply stay longer.
Surveying the same employees every six months resolves the question. Now the company can see whether each person’s score drops, and when.
The contrast in one view:
- Cross-sectional finding: Tenure and engagement move in opposite directions.
- Longitudinal answer: Engagement declines for each person after a set point, or it does not.
Why can only a longitudinal study point toward cause and effect?
Longitudinal studies can point toward cause and effect because they record the order of events. Three conditions support a causal claim:
- Association: The two variables move together.
- Time order: The cause comes before the effect.
- No better explanation: Other factors have been ruled out.
Only repeated measurement of the same people can confirm time order. A cross-sectional study sees both variables at the same moment.
Take the engagement example. A survey might show that trained employees are more engaged. A cross-sectional design cannot tell whether training raised engagement or whether engaged people were more likely to sign up. Measuring the same employees before and after training settles the sequence.
Longitudinal data also lets each person serve as their own comparison. That removes stable differences such as personality or background from the picture. Even so, neither design proves causation alone. Controlled experiments remain the strongest test, as explained in our guide to causal research.
What are the pros and cons of each design?
Each design trades speed and cost against depth of insight. The lists below summarize the main trade-offs so you can weigh them against your project.
Cross-sectional study
Pros:
- Fast to run and low in cost
- Measures many variables at once
- Works well for prevalence and group comparisons
- No risk of participants dropping out
Cons:
- Cannot show cause and effect
- Cannot show change within individuals
- Reflects only one moment, which may not be typical
- Age comparisons can mix up aging and generational differences
Longitudinal study
Pros:
- Shows change and the sequence of events
- Tracks individuals, not only averages
- Supports stronger causal reasoning
- Captures early signals before outcomes appear
Cons:
- Expensive and slow to complete
- Participants drop out between waves
- Long timelines can outlast the original question
- Repeated measurement can change how people answer
How do you choose between a cross-sectional and a longitudinal study?
Choose by working through your research question, not by defaulting to the cheaper option. The five steps below give you a clear decision path.
- Write the question in plain words.
If it asks “how many” or “how do groups differ,” lean cross-sectional. If it asks “how does this change” or “what leads to what,” lean longitudinal.
- Decide whether order matters.
If you need to know what came first, you need repeated measurement of the same people.
- Check your timeline and budget.
A decision due in a month rules out a multi-year panel.
- Estimate your retention risk.
If participants are hard to reach again, plan for dropouts or favor a simpler design.
- Consider doing both in sequence.
Start with a cross-sectional study to spot associations. Then run a longitudinal follow-up on the ones that matter.
The sequential path is common in practice. A cross-sectional survey is a low-cost way to find what deserves a longer, costlier investigation.
How do you evaluate the quality of each design?
Quality depends on who you reached and, for longitudinal work, who stayed. Whichever design you pick, start by defining your target group and sample clearly. Our explainer on population vs. sample walks through this step.
Cross-sectional quality checks
Four checks matter most:
- Representativeness: Compare your sample’s age, gender, and region against the population you want to describe.
- Response rate: Track how many invited people completed the survey. Low rates raise the risk of nonresponse bias, where non-responders differ from responders.
- Sample size and margin of error: A larger sample narrows the margin of error, the range within which the true value likely falls.
- Question consistency: Use identical wording and order for every respondent.
Longitudinal quality checks
Track these after every wave:
- Retention rate: Divide respondents in the current wave by respondents in wave one. Report it after every wave.
- Attrition bias: Compare people who dropped out with those who stayed. If they differ on key traits, your trends may be skewed.
- Measurement consistency: Keep question wording and scales the same across waves, so changes reflect people and not the instrument.
- Wave spacing: Match the gap between waves to how fast the topic changes.
How do you reduce attrition in a longitudinal study?
Attrition is the loss of participants between waves, and it is the biggest threat to a longitudinal study. The fix starts at wave one, when you collect more than one way to reach each person, such as email, phone, and a backup contact.
- Keep each wave short: A ten-minute survey is far easier to repeat than a forty-minute one.
- Remind without nagging: Gentle, scheduled reminders recover many late responders.
- Show participants their value: Share summary findings and thank them after each wave. Small incentives help too.
Tools make this easier to manage. QuestionPro survey software offers automatic reminders and piping, which carries earlier answers into later questions. Its panel management features track participants and schedule automated follow-up surveys. Research teams in universities can see how this fits academic research needs.
What mistakes should researchers avoid?
Most errors come from mismatching the design and the claim. These are the five most common ones.
- Reading correlation as cause.
A cross-sectional link between two variables does not show that one produced the other.
- Calling a repeated cross-sectional study longitudinal.
If the sample changes each wave, you cannot claim to have tracked individual change.
- Ignoring cohort effects.
A cohort effect is a difference caused by the era a group grew up in, not by age. A cross-sectional comparison of 25-year-olds and 65-year-olds may reflect generation, not aging.
- Changing wording between waves.
Even small edits can create fake trends.
- Skipping the attrition plan.
Losing the least engaged participants first makes results look better than reality.
Pick the design that matches your question
The best design is the one that fits the question, the clock, and the budget. A cross-sectional study gives you a fast, clear picture of where things stand today. A longitudinal study gives you the story of how they got there.
Many strong research programs use both. They start with a snapshot to find what stands out, then follow the same people to learn why. Decide what you need to claim first, and let that choice drive the design:
- Need a current picture? Run a cross-sectional study.
- Need to explain change? Follow the same people.
Frequently Asked Questions (FAQs)
Yes. A cohort-sequential design follows several age groups over time. It separates aging effects from generational differences and finishes sooner than tracking a single group for decades, which makes it useful when a long timeline is not realistic.
Two waves are the minimum, since you need at least two measurements to see change. Three or more waves reveal the shape of change, such as steady decline or a sudden jump. Match spacing to how quickly your topic shifts.
It is usually quantitative, because surveys and exams produce numbers that describe a population. It can also include qualitative interviews collected at one point in time. What defines it is the single moment of measurement, not the data type.
A cross-sectional study costs less because it needs one round of data collection. A small business can still track change cheaply by repeating a short pulse survey, though a fresh sample each time gives trends without individual tracking.
Often, yes. Research with people at US universities and federally funded institutions typically goes through Institutional Review Board (IRB) review. Longitudinal studies may also need renewed consent and periodic review because participants stay involved for years.