



Picking between Customer Effort Score and Net Promoter Score usually starts with the wrong question. It is not which one wins. It is which one answers the question you are actually asking. In this blog, we break down what Customer Effort Score (CES) and Net Promoter Score (NPS) measure. We also cover where each one falls short and how to use them together.
CES tells you how hard a single interaction was. NPS tells you how customers feel about your brand overall. Research from the Corporate Executive Board, now part of Gartner, found something surprising. Reducing customer effort predicts loyalty better than trying to delight customers at every turn. That finding is the reason CES exists. It is also why most mature customer experience (CX) programs run CES and NPS side by side.
What is Customer Effort Score (CES)?
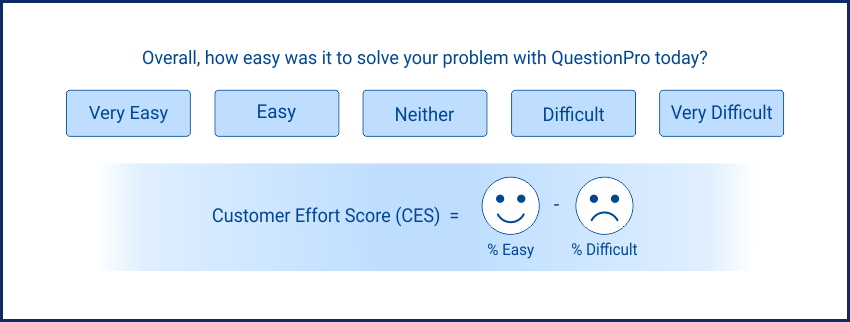
Customer Effort Score is a metric that measures how much effort a customer had to spend to get something done with your company. It is usually asked right after a specific interaction.
Common CES triggers include:
- A support call or chat that just closed.
- A product return or refund request.
- A self-service task, like resetting a password.
The classic CES question reads something like “How easy was it to resolve your issue today?” Customers respond on a scale. Most programs use 1 to 5 or 1 to 7, running from “very difficult” to “very easy.” A low score signals friction. A high score signals a smooth interaction.
CES grew out of Customer Effort Score research by the Corporate Executive Board, later acquired by Gartner. Their team studied more than 75,000 customer interactions. Effort, not satisfaction, turned out to be the strongest predictor of whether a customer would stay loyal. That single insight reshaped customer service strategy: stop chasing delight, start removing friction.
What is Net Promoter Score (NPS)?
Net Promoter Score is a single-question metric. It measures how likely a customer is to recommend your company to a friend or colleague, scored from 0 to 10. Unlike CES, which looks at one interaction, NPS reflects a customer’s overall relationship with your brand.
Bain & Company created the methodology in 2003. It sorts respondents into three groups.
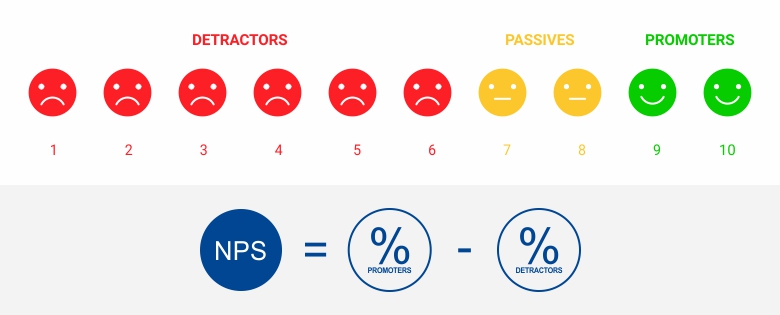
- Promoters score 9 or 10. They are loyal, likely to buy again, and likely to refer others.
- Passives score 7 or 8. They are satisfied but not enthusiastic, and they will switch if a better offer appears.
- Detractors score 0 to 6. They are at risk of churning and may actively discourage others from buying.
Your NPS is the percentage of promoters minus the percentage of detractors, giving you a single number between -100 and 100. A positive score is generally considered good, above 50 is strong, and above 70 is rare even among top-performing brands.
CES, NPS, and CSAT: How the three metrics differ
Teams often lump CES in with Customer Satisfaction Score (CSAT), a metric that asks how satisfied a customer felt with one interaction or purchase. The three metrics look similar on a dashboard, but they answer different questions and belong at different points in the customer journey.
| Metric | What it measures | Typical question | When to use it |
|---|---|---|---|
| Customer Effort Score (CES) | Ease of a specific task or interaction | “How easy was it to resolve your issue today?” | Right after support, onboarding, or a self-service task |
| Net Promoter Score (NPS) | Overall loyalty and likelihood to recommend | “How likely are you to recommend us to a friend or colleague?” | Periodically, across the full customer relationship |
| Customer Satisfaction Score (CSAT) | Happiness with one interaction or purchase | “How satisfied were you with your recent purchase?” | Immediately after a transaction or delivery |
CES and CSAT are both transactional, but they are not interchangeable. CSAT asks how a customer felt. CES asks how hard it was. A customer can rate an interaction 5 out of 5 for satisfaction while still calling it high effort. That gap is exactly what CES is built to catch.
Advantages and disadvantages of Customer Effort Score (CES)
CES earns its place in a CX program because it points directly at fixable friction, not vague sentiment.
Advantages:
- Flags specific process problems, such as a confusing return policy or a support script that takes too long.
- Correlates strongly with repeat purchase behavior, since low-effort customers are far more likely to buy again.
- Short and fast to answer, which keeps response rates high.
- Easy to act on, because a low score usually points to one identifiable step in the journey.
Disadvantages:
- Limited to the interaction it was asked about, so it says little about brand-wide loyalty.
- Tells you effort was high without explaining why, which means you still need follow-up questions or customer experience versus customer service analysis to find the root cause.
- Does not account for price, product quality, or competitive pressure, all of which shape loyalty too.
Advantages and disadvantages of Net Promoter Score (NPS)
NPS earns its place because it is the metric leadership teams recognize and can track over years.
Advantages:
- Simple enough for any team to understand and report on.
- Tracks the health of the overall customer relationship, not just one touchpoint.
- Comparable across time periods and, with the right benchmarks, across industry peers.
- Cheap and fast to run, since it is a single question.
Disadvantages:
- Says nothing about why a customer scored the way they did unless you add a follow-up question.
- A high score does not guarantee retention. A customer can be a promoter today and still switch providers after one bad support experience.
- Averages can hide the real story, since a 7 out of 10 from a happy customer and a 7 from a customer barely holding on look identical in the raw number.
How to choose between CES and NPS
The honest answer is that you rarely choose only one. The more useful question is which one to lead with for a given goal.
Lead with CES when you want to:
- Diagnose friction in support, onboarding, checkout, or self-service.
- Reduce churn tied to a specific process.
- Give frontline teams a metric they can influence day to day.
Lead with NPS when you want to:
- Track brand-level loyalty and advocacy over quarters or years.
- Report customer sentiment to leadership or the board.
- Identify promoters worth turning into referral sources or case studies.
Most CX teams end up running both. CES covers key operational touchpoints, and NPS runs on a recurring cadence to track the bigger picture. A drop in CES after a product change often shows up as a drop in NPS a quarter later. That gives you an early warning system instead of a lagging one.
Real-world examples of CES and NPS in action
- Support ticket resolution.
A subscription software company sends a one-question CES survey the moment a support chat closes. When scores dip for billing issues specifically, the team knows exactly where to focus, without waiting for a quarterly NPS report to surface the problem.
- Post-purchase loyalty check.
A regional retailer sends an NPS survey to customers 30 days after a major purchase. Detractors get a personal follow-up from a service manager, while promoters get invited into a referral program. The retailer never asks NPS after a single interaction, since one bad delivery day should not define the whole relationship.
- Onboarding friction.
A B2B software vendor tracks CES after each onboarding milestone. A low score at the “connect your data” step reveals a confusing setup screen. A quarterly NPS survey would never isolate that on its own.
How to measure and benchmark CES and NPS
Both metrics are simple to calculate, but the details matter.
- Decide the trigger. CES fires after a specific interaction; NPS fires on a recurring schedule, such as quarterly or twice a year.
- Collect responses on a consistent scale. Most CES programs use a 1 to 7 scale; NPS always uses 0 to 10.
- Calculate CES as the average of all responses in the period. Calculate NPS as percentage of promoters minus percentage of detractors.
- Compare against your own trend line first, then against industry benchmarks second.
According to Gartner’s effortless experience research, 96% of customers who go through a high-effort interaction become more disloyal. Only 9% of those with a low-effort interaction say the same. On the NPS side, a positive score is generally read as good. Above 50 is strong, and above 70 is world-class. The right benchmark still depends on your industry, not a single global number.
Common mistakes to avoid with CES and NPS
Most CES and NPS programs fail for the same handful of reasons.
- Surveying too often, which drives down response rates and survey fatigue across your customer base.
- Treating NPS as a transactional metric by sending it right after a single support call instead of on a relationship cadence.
- Never closing the loop with detractors or high-effort respondents, which wastes the most actionable feedback you collect.
- Chasing an arbitrary benchmark score instead of watching the trend line over time.
- Reporting a single number without segmenting by product, channel, or region, which hides where the real problem lives.
QuestionPro Customer Experience: Measuring CES and NPS together
Running CES and NPS as separate spreadsheets makes it hard to see how they connect. QuestionPro Customer Experience brings both into one system. A CES dip at a specific touchpoint and a shift in overall NPS then show up on the same timeline, not in two disconnected reports.
The platform includes:
- Real-time alerts that flag detractors and high-effort responses the moment they come in.
- Dashboards that segment CES and NPS by channel, product line, or region.
- Closed-loop workflows that route flagged responses to the right team automatically.
Making CES and NPS work for your CX program
Customer Effort Score and Net Promoter Score are not competitors, even though the comparison gets framed that way. CES tells you where a specific process is breaking down. NPS tells you whether your customers, overall, still trust you enough to stick around and bring others with them.
The businesses that get the most value from these metrics do three things well:
- They match the metric to the moment, CES for interactions and NPS for the relationship.
- They close the loop on every flagged response instead of just tracking the number.
- They watch trends over time rather than treating any single score as a verdict.
Frequently Asked Questions (FAQs)
Yes, and most mature CX programs do. CES triggers right after a specific interaction, while NPS runs on a recurring schedule. Running both gives you an early warning system, since a CES drop at a key touchpoint often predicts a future dip in loyalty.
Neither wins outright. B2B teams typically lean on CES around onboarding and support, since friction there threatens renewals. NPS tracks account-level loyalty across the full contract. Multi-stakeholder buying means both signals matter.
CES should trigger immediately after a specific interaction, like a support ticket closing. NPS works best on a recurring cadence, typically quarterly or twice a year, since it measures the relationship rather than one moment.
On a 1 to 7 scale, scores from 5.5 to 6 are generally strong. Context matters more than the raw number. A 5 after a complex support case can be excellent, while the same score after a simple task signals friction.
No. CSAT measures how satisfied a customer felt about one interaction. CES measures how much effort that interaction took. A customer can report high satisfaction while still calling the process effortful, a gap CSAT alone will not reveal.
Not necessarily. NPS reflects the overall relationship. A customer can stay a promoter even after one frustrating support call if the rest of the relationship holds up. CES is built to catch that process-level friction on its own.



