
Customer experience analytics is the practice of collecting and analyzing customer data from every interaction, such as surveys, support tickets, and website behavior, to understand how people actually experience a brand.
Most companies are increasing what they spend on customer experience without seeing the results improve. Forrester’s 2025 Customer Experience Index found that only 7% of US brands improved their CX scores over the past year, while 25% declined, showing that investment alone does not guarantee a better experience.
This guide explains how CX analytics works, the metrics worth tracking, and how to turn that data into changes customers actually notice.
What is customer experience analytics?
Customer experience analytics, often shortened to CX analytics, is the process of collecting and analyzing customer data across every touchpoint to understand how people feel about a brand and why.
That data can come from surveys, social media comments, support tickets, product usage, and direct reviews. CX analytics covers both the good and the difficult interactions a customer has with a company, which is what makes it useful for spotting problems before they show up as lost revenue. The end goal is not the data itself, but the action a business takes once it understands where an experience is working and where it is breaking down.
How does customer experience analytics actually work?
Customer experience analytics works by collecting data from multiple sources, unifying it into one view, and analyzing it to surface patterns a business can act on.
The process generally moves through three stages:
- Collection.
Data comes in through surveys and feedback forms, website and app behavior, and CRM or support system records.
- Unification.
These separate sources get combined into a single view of the customer, replacing a fragmented picture with one a team can actually use.
- Analysis.
Patterns emerge, such as drop-off points in the journey, high-performing touchpoints, and specific sources of friction.
US companies increasingly act on these patterns directly, using them to reduce churn and strengthen long-term retention rather than treating analytics as a quarterly report that sits unread.
What CX metrics should you actually track?
The core CX metrics worth tracking are Net Promoter Score, Customer Satisfaction Score, Customer Effort Score, churn rate, retention rate, and customer lifetime value.
- Net Promoter Score (NPS): Measures loyalty by asking how likely a customer is to recommend the brand.
- Customer Satisfaction Score (CSAT): Tracks satisfaction after a specific interaction, such as a purchase or support call.
- Customer Effort Score (CES): Measures how easy it was for a customer to complete an action, like resolving an issue.
- Churn rate: Shows the percentage of customers who stop doing business with a company over a given period.
- Retention rate: Indicates how effectively a business keeps customers over time.
- Customer lifetime value (CLV): Estimates the total revenue a customer generates across their full relationship with a company.
No single metric tells the whole story. Tracking these together gives a far more reliable read on performance than relying on any one score in isolation.
Why does customer experience analytics matter?
Customer experience analytics matters because it replaces guesswork about customer sentiment with evidence a business can actually act on.
- Sharper customer insight.
Analytics reveals how customers genuinely feel, not how a team assumes they feel. - Better acquisition strategy.
Marketing campaigns built on real customer data convert more efficiently than campaigns built on assumptions. - Stronger retention.
Spotting a customer’s pain points early gives a business time to fix them before that customer adds to the customer churn count.
How do you use CX analytics to improve the experience?
CX analytics improves the customer experience when a business prioritizes the fixes with the clearest financial impact and applies what it learns consistently across touchpoints.
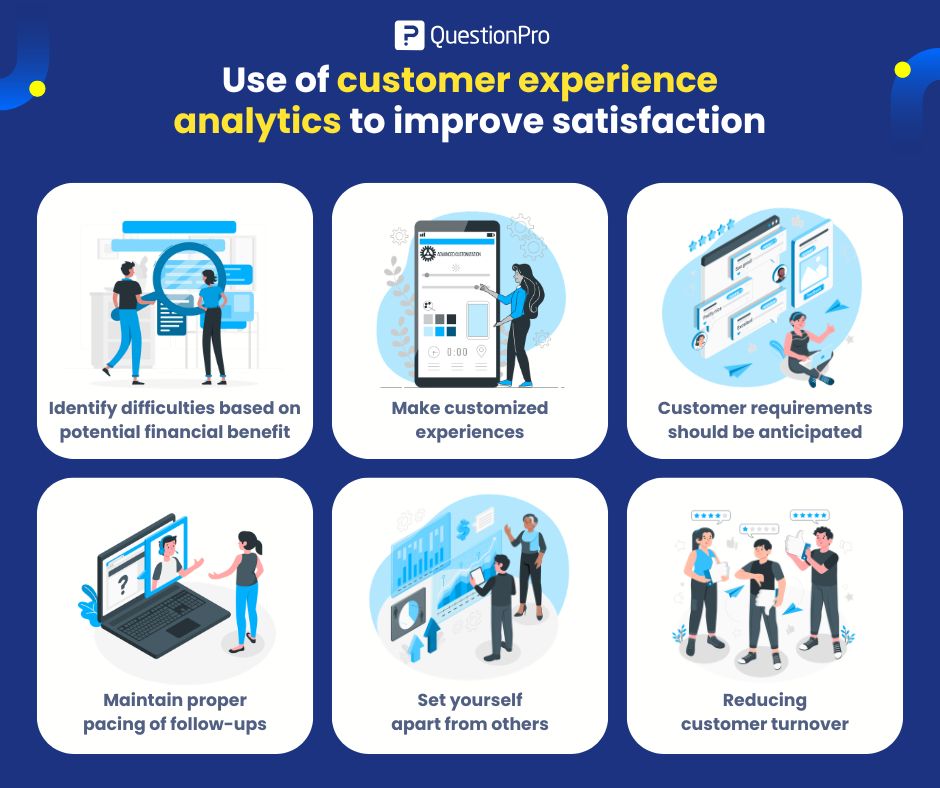
Prioritize by financial impact first
Not every problem deserves immediate action. Start with the friction point that has the clearest, most direct effect on revenue, such as automating a slow support process that is driving complaints.
Personalize using real segments
Use demographic and behavioral data to build genuine customer segmentation and tailor messaging to specific groups, rather than treating every customer the same way.
Watch for signals outside direct feedback
Social listening captures what customers say about a brand when they are not filling out a survey. This unsolicited feedback often surfaces problems and praise that structured feedback channels miss entirely.
Pace follow-ups carefully
Checking in too often on long-term customers can feel intrusive rather than caring. Testing different follow-up intervals helps a business find the point where it stays relevant without becoming a nuisance.
Watch competitors, not just your own brand
Tracking what competitors do well, and poorly, often reveals ideas a business would not have generated by studying its own experience alone.
Address churn directly
Talking to customers who are at risk of leaving, rather than only analyzing why past customers left, gives a business the chance to intervene while the relationship is still salvageable.
How is customer experience analytics different from customer journey analytics?
Customer experience analytics measures how customers feel about an experience, while customer journey analytics tracks the specific path customers take through touchpoints and where they convert or drop off.
The two overlap but answer different questions, which is why many CX teams run both together.
| Aspect | Customer experience analytics | Customer journey analytics |
|---|---|---|
| Focus | Overall satisfaction and loyalty | The path across touchpoints |
| Data type | Feedback data, metrics like NPS and CSAT | Behavioral and interaction data |
| Key insight | How customers feel about the experience | Where customers drop off or convert |
| Example | Measuring satisfaction after a support call | Tracking steps from website visit to purchase |
How can QuestionPro support CX analytics?
QuestionPro supports CX analytics by giving teams a single platform to collect customer feedback and turn it into real-time, actionable dashboards.
Through QuestionPro Customer Experience, teams can track NPS, CSAT, and other core metrics alongside behavioral data, giving a fuller view of customer sentiment than feedback surveys alone would provide. This kind of unified view is what separates a report nobody reads from a system a business actually acts on.
Analytics only matters if it changes what you do next
Customer experience analytics is not valuable because it produces dashboards. It is valuable because it tells a business exactly where to focus limited time and budget to keep customers from leaving.
The companies improving their CX scores are not necessarily spending more than everyone else. They are the ones consistently acting on what their data tells them, touchpoint by touchpoint, instead of collecting feedback and setting it aside.
Frequently Asked Questions (FAQs)
Core metrics like NPS and CSAT are worth reviewing monthly at minimum, with deeper analysis quarterly to catch longer-term trends. Waiting for an annual review often means missing problems while they are still small and fixable.
Small businesses benefit just as much, though the scale looks different. Even tracking a simple post-purchase CSAT score and reading support tickets regularly counts as CX analytics and can catch problems early.
The most common mistake is collecting data without assigning anyone to act on it, which turns analytics into a report nobody reads. A metric only creates value once a specific team owns the follow-up action.
Yes, to a degree. Patterns like declining usage, falling satisfaction scores, and reduced engagement often appear before a customer actually leaves, giving a business a window to intervene with outreach or support.
It includes both. Numeric scores like NPS and CSAT show the size of a problem, while open-ended comments and support transcripts explain why it is happening, which is often the more actionable half of the picture.