
If you have a stack of survey responses in front of you, it’s exciting to think about what insights they might hold. But wait, what if some answers are incomplete, others don’t make sense, and a few look like they came from a robot? That’s why, before you can trust your data, it needs good data cleansing.
Data cleansing is the crucial process of spotting and fixing those messy, incomplete, or inaccurate responses so your insights are actually reliable. Think of it like tidying up a messy room before inviting guests. The cleaner it is, the easier it is to find what you need.
In this blog, we’ll walk through how proper data cleansing can turn a chaotic batch of survey results into a crystal-clear picture you can actually use.
What is Data Cleansing in Survey Research?
Data cleansing is the process of fixing or removing faulty, messy, or incomplete data so it’s clean and ready to use. It helps make sure your information is accurate, consistent, and useful for analysis or decision-making.
While data cleaning focuses on basic fixes like correcting formats or deleting blanks, data cleansing goes further. It checks if the data actually makes sense and can be trusted, not just that it looks tidy, but that it’s also logical and accurate.
When cleaning survey data, here’s what to watch for:
- Fix inconsistent formatting (e.g., “yes” vs. “Y”)
- Remove duplicate responses
- Catch logic errors (like conflicting answers)
- Filter out fake or random responses
- Clean up misused “Other” fields
- typographical errors
- Handle skipped required questions
Why Clean Survey Data Is Important for Accurate Results
Clean survey data is the backbone of reliable insights. When responses are filled with errors, duplicates, or incomplete answers, analyzing results correctly becomes a challenge. Data cleaning might seem like a small step, but it’s what separates valuable findings from misleading ones. Here’s why it’s crucial for your results:
- Statistical Accuracy: Clean survey data removes errors like duplicates, missing values, and formatting issues, ensuring reliable analysis and actionable insights.
- Data Analysis and Visualization: Clean data ensures charts and dashboards accurately represent trends, avoiding misleading visuals and helping your reports tell the true story.
- Research Validity: If your dataset includes fake, incomplete, or conflicting answers, it undermines the credibility of your entire study. Clean survey data ensures that your findings genuinely reflect real opinions and behaviors.
- Better Decision-Making: Clean data supports informed decision-making by providing accurate and trustworthy insights that help guide business strategies.
Common Data Issues in Survey Responses
Often, the quality of your data is compromised by common issues that, if not addressed, can lead to inaccurate analysis. Identifying and fixing these problems before they impact your results is crucial to ensuring your findings are trustworthy.
- Understanding the most frequent data quality problems can help you detect and fix them before they affect your analysis.
- Respondent fatigue or incomplete surveys can lead to incomplete responses, creating data gaps. Short, engaging surveys help prevent this issue.
- Fake responses from bots or people trying to game the system distort data. Tools that detect suspicious patterns help maintain data integrity.
- Straight-lining or pattern-based answers for every question (e.g., “Strongly Agree”) signals low engagement. These responses should be filtered out during data cleaning.
- Conflicting or illogical answers suggest misunderstanding or lack of attention. Correcting or removing these responses preserves data quality.
- Multiple submissions from the same person can skew results. Removing duplicates ensures each participant’s response is counted fairly.
Data Cleansing vs. Data Cleaning vs. Data Scrubbing
When working with data, you might hear the terms data cleansing, data cleaning, and data scrubbing used interchangeably. While they all refer to improving the quality of data, there are subtle differences in what each term means and how they’re used.
Understanding these differences can help you choose the right process (and tools) depending on your project, whether you’re cleaning a simple spreadsheet or preparing large datasets for research or automation.
| Criteria | Data Cleansing | Data Cleaning | Data Scrubbing |
| Definition | A thorough process of correcting, validating, and standardizing data for accuracy and logic | General process of fixing or removing incorrect or missing data | Automated process of detecting and removing invalid or corrupt data |
| Depth | More detailed focuses on both surface errors and deeper inconsistencies | Focuses on basic errors like typos, blanks, or simple duplicates | Focuses on cleaning large datasets quickly, often in bulk |
| Common Use Cases | Surveys, research studies, data analytics reports | Daily business tasks, CRM maintenance, spreadsheets | Data migration, system updates, and cleaning databases |
| Tools | Manual checks + tools like Excel, Python, R, or survey platforms | Excel, Google Sheets, basic scripts | ETL tools, SQL scripts, data integration platforms (e.g., Talend, Informatica) |
| Used By | Data analysts, researchers, data scientists | Business users, marketers, and admin staff | Data engineers, IT professionals |
| Level of Automation | Often semi-automated with manual review | Mostly manual | Highly automated |
Recommended Read: Understanding data cleansing vs data cleaning and their key differences
When & Where to Apply Data Cleansing
If you’ve ever worked with survey data (or any kind of data, really), you probably know that it rarely comes in perfect. There are typos, skipped questions, weird answers, even fake responses, and if you’re not careful, those small errors can mess up your entire data analysis.
Good data cleansing happens at three key stages: before, during, and after data collection. Here’s a simple breakdown of when and where you should be cleaning your data.
1. Before Fielding the Survey
Yes, data cleansing actually starts before you collect a single response. Why? Because a well-designed survey reduces the chances of bad data in the first place.
Here’s what you can do:
- Use logic checks: Show or hide questions based on earlier answers. For example, only ask follow-ups about pet food if someone says they own a pet.
- Apply skip logic: This helps people avoid irrelevant questions, keeping things clear and reducing mistakes.
- Set validation rules: Stop people from entering unrealistic values, like “150” for age or “aaa” as an email.
Think of this stage as setting up guardrails; it prevents problems instead of fixing them later.
2. During Fieldwork (While the Survey Is Live)
Once the survey is out in the world and responses are coming in, your job isn’t over yet. This is your chance to catch issues in real time.
Here’s what to watch for:
- Response patterns that look suspicious, like people finishing a 10-minute survey in 20 seconds, or selecting the same answer for every question.
- Duplicate responses if someone fills out the survey multiple times.
- Bot activity or spam, sometimes you’ll get fake responses from bots just clicking through.
You can pause the survey or flag unusual entries as they come in. It’s easier to deal with 10 bad responses now than 200 at the end.
3. After Data Collection (Before Analysis)
Now comes the big clean-up. Once your responses are in, you need to go through everything carefully before you start analyzing or visualizing the data.
Here’s what you should do:
- Run audits: Look for incomplete surveys, missing answers, or strange values.
- Filter out fake or inconsistent responses: Like someone claiming to be 6 years old with a job title of “CEO.”
- Do basic statistical checks: Make sure averages, totals, and percentages actually make sense.
Cleaning at this stage ensures that your final insights are based on accurate, high-quality data, not junk.
How to Clean Survey Data: Step-by-Step
You’ve collected your survey responses; that’s the exciting part. But before you start analyzing trends or making decisions, there’s an important job to do: clean the data.
Survey data can be messy. Some people rush through it, others skip questions, and sometimes you even get responses that just don’t make sense. Cleaning your data helps ensure that what you’re working with is accurate, useful, and ready for analysis.
Let’s walk through this in a simple, step-by-step way.
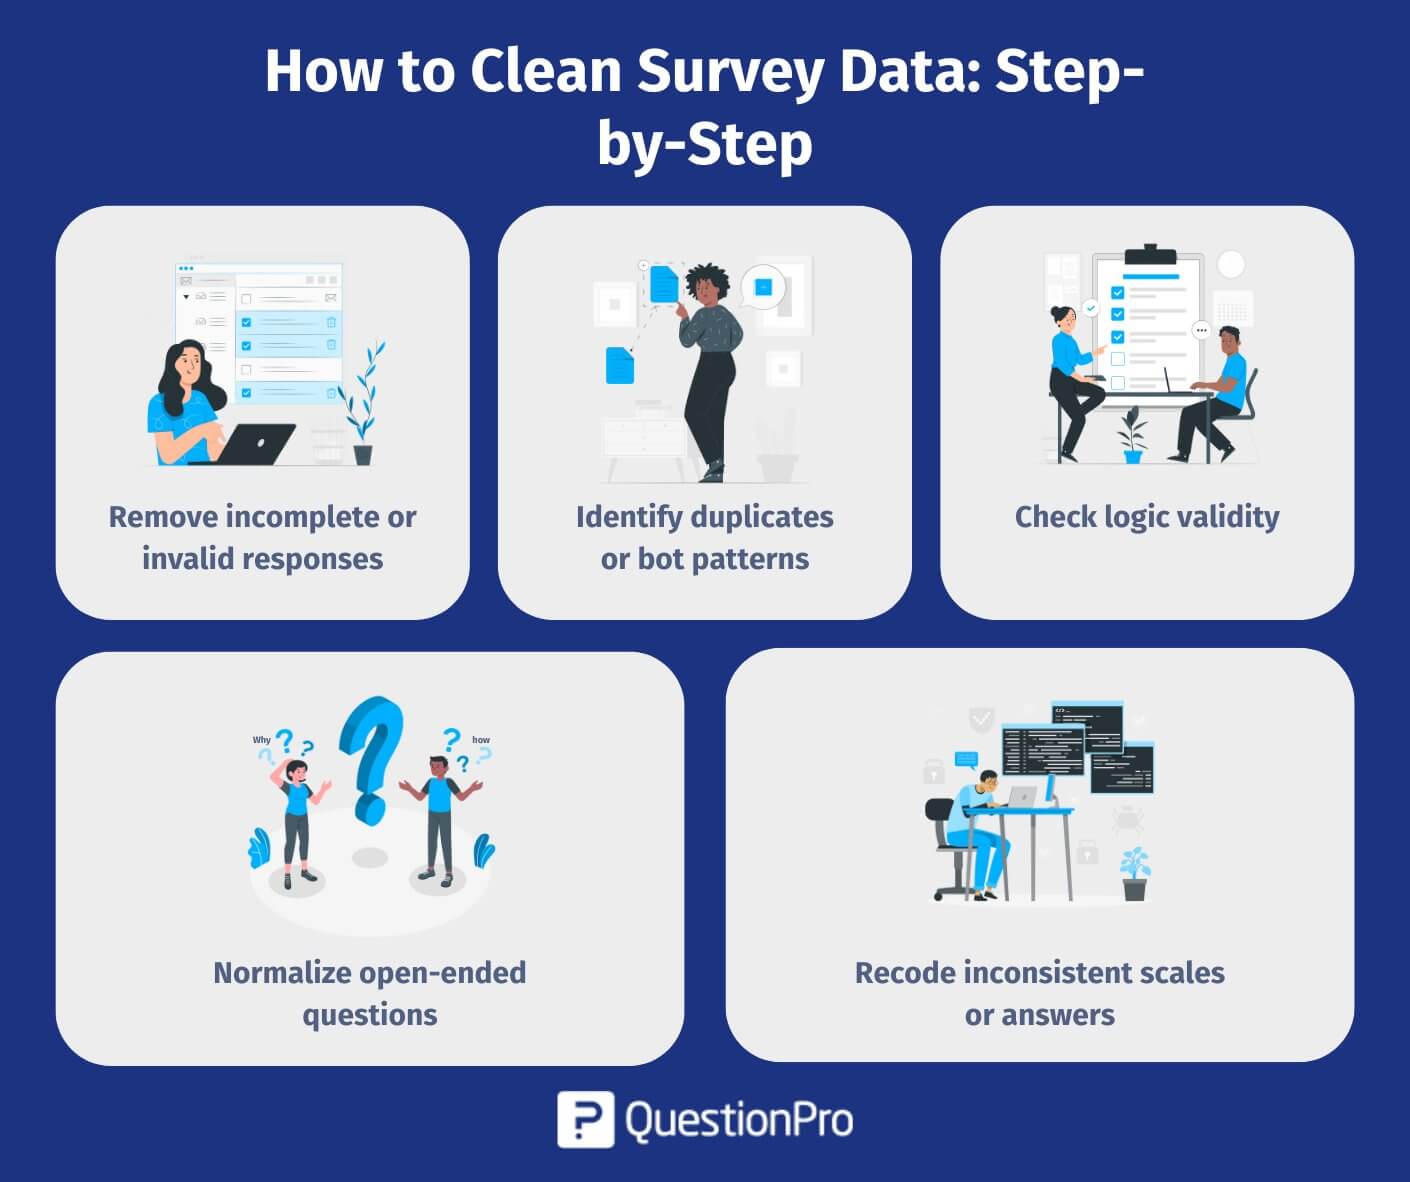
Step 1: Remove incomplete or invalid responses
The first thing to check is whether all the responses are actually usable. Sometimes people abandon a survey halfway through or enter random text just to finish quickly. If someone answered only one or two questions or gave answers that are clearly nonsense, it’s best to remove those responses altogether.
There’s no need to hang on to data that doesn’t contribute anything meaningful. It’ll only clutter your results and skew your insights.
Step 2: Identify duplicate data or bot patterns
Now, take a look at your data and see if anything feels off. Sometimes, people submit a survey multiple times, or bots fill it out automatically, especially if the survey link is public.
Here’s where using a few quick checks can help:
- Do you see identical responses submitted within seconds of each other?
- Are the same answers repeated over and over?
- Did someone complete the survey in an unrealistically short time?
If so, those responses might be duplicates or bot-generated, and they should be removed. Your data should reflect real, thoughtful human input.
Step 3: Check logic validity
This step is all about making sure the answers make sense together.
Let’s say someone says they’re 17 years old in one question but also mentions having 10 years of work experience. That’s a clear contradiction. Or maybe someone says they “never use social media” but later says they post on Instagram daily. These inconsistencies can pop up more often than you think.
When you find them, it’s a good idea to either flag those responses for further review or remove them completely if they don’t seem trustworthy.
Step 4: Normalize open-ended responses
Open-ended questions can be goldmines of insight, but they can also be messy.
People often use different words to describe the same thing. One person might write “NY,” another says “New York,” and someone else types “nyc.” If you leave those as-is, your data will treat them as separate categories. So here, it helps to standardize similar responses into one consistent format.
This isn’t just about place names; it applies to job titles, product feedback, and more. Cleaning this up makes your data far more organized and easier to analyze later.
Step 5: Recode inconsistent scales or answers
Lastly, make sure all your rating questions are on the same page. You might have used a 1–5 scale for some questions, and a 1–10 scale for others, or maybe respondents interpreted options differently.
It’s important to go back and adjust or “recode” your responses to match a standard format. That way, you can actually compare the answers side by side and draw accurate conclusions.
For example, if someone rated something “10” on a 1–10 scale, and another rated “5” on a 1–5 scale, those should both represent the same level of customer satisfaction. Recoding helps align that data properly.
Survey Data Cleansing Use Case
From incomplete responses to obvious spam or inconsistent answers, unclean data can throw off your results. That’s why data cleansing is so important. In this post, Here, take a quick look at a simple use case to show how cleaning up survey data can lead to clearer, more accurate insights.
Example: A retail company ran a product satisfaction survey and received over 8,500 responses.
Problems Found:
- Around 12% of responses were incomplete (people dropped off halfway).
- 200+ entries had the exact same answers, likely bots.
- Some open-ended feedback included random keyboard smashes like “asdfgh” or emojis only.
What They Did:
They cleaned the data by:
- Removing incomplete and bot-like responses.
- Filtering out nonsensical text entries.
- Recoding some ratings to fix inconsistent scales used by different branches.
Result:
After cleaning, they had 7,200 reliable data points or responses, which gave them accurate NPS scores and clear insights into what customers liked and disliked. It helped them improve the next product launch.
How QuestionPro Helps in Data Cleansing?
Getting accurate and clean data is one of the biggest challenges in any survey or research project. The good news is, QuestionPro is built to make this easier for you. It comes with several smart features that help you prevent messy data and clean it up when needed.
Clean Data Starts with Smart Surveys
The best way to avoid bad data is to design your survey well from the beginning. QuestionPro gives you data cleansing tools like:
- Validation: You can make sure people don’t skip important questions or give incomplete answers. For example, if a question must be answered in a certain format (like a valid email address), the tool won’t let the user go forward unless it’s correct.
- Text Piping: This feature brings answers from earlier questions into later ones. It helps keep responses consistent and avoids confusion. Additionally, text piping makes the survey feel more personal and relevant to the user.
- Randomization: You can shuffle answer choices to avoid bias. This ensures that people aren’t just clicking the first option they see every time.
- Logic Checks: With skip logic and branching, you can guide people to only the questions that apply to them. This cuts down on irrelevant data.
Helpful During and After Data Collection
Even after your survey goes live, QuestionPro helps clean up the data:
- Clean Exports: When it’s time to analyze your results, you can export the data in a neat, organized format. Whether you’re using Excel, SPSS, or another tool, the data is easy to understand and work with.
- Filters in Reports: You can use built-in filters to remove incomplete responses or test entries. This helps you focus on high-quality data during analysis.
QuestionPro Tip: One of the easiest ways to avoid data problems is to think ahead. Use QuestionPro’s tools to build smart surveys from the start, which reduces the need for clean-up later.
Conclusion
Data cleansing may not be the most exciting part of survey research, but it’s one of the most important. Without clean, accurate data, even the most beautifully designed survey can lead to misleading insights or poor decisions. Whether you’re trying to understand your customers better or make a key business move, your conclusions are only as good as the data behind them.
The good news? You don’t have to tackle it all manually. From setting up smart surveys with logic checks and validations to cleaning up responses with filters and exports, tools like QuestionPro make the entire data cleansing process easier and more reliable. When you build your survey thoughtfully and take the time to clean your data properly, you set yourself up for trustworthy results and smarter outcomes.
Frequently Asked Questions (FAQs)
Answer: You can prevent bad data in your survey by designing it smartly from the start.
Use clear, simple questions, apply validation rules to make sure required questions are answered, use randomization to avoid bias, and add logic checks to filter out inconsistent answers.
Answer: Not always. It depends on how much of the survey is incomplete and which questions are missing values. If key questions (the ones crucial for your analysis) are unanswered, it’s usually best to remove that response. But if only a few non-essential questions are skipped, you might still keep it, just note the gaps in your analysis.
Answer: Yes, you can automate parts of data cleansing using survey tools that offer built-in features like validation rules, logic checks, and filters. These help catch incomplete answers, duplicates, or suspicious patterns automatically, making the cleaning process faster and more efficient.
Answer: Cleaning open-ended responses means organizing and standardizing the text answers so they’re easier to analyze. This includes fixing typos, merging similar answers (like “NY” and “New York”), removing irrelevant or nonsensical replies, and sometimes categorizing responses into meaningful groups.
Answer: If you skip data cleansing, your survey results might be full of errors like duplicates, incomplete answers, or fake responses. This can lead to inaccurate insights, poor decisions, and wasted time because you’re basing conclusions on messy, unreliable data.