There are several ways in which data manipulation may be used in data science. Data must be organized to be read by machines. On the other hand, humans must be taught how to utilize it. It is more important than ever as the quantity of data being consumed and stored grows exponentially.
Every industry has a direct impact on how organizations function because of knowledge. Structured data, or data that computers can only access, must follow a pattern to work correctly.
Humans need to cleanse and map the data after it has been processed and altered to deliver valuable insights. As the amount of data being utilized and processed rises, so does its importance.
In this blog, we’ll learn what it is, how it works, and different ways to manipulate data.
What is Data Manipulation?
Data manipulation is the process of organizing data to make it more understandable. Any type of data may be sorted alphabetically for easy comprehension. Unorganized employee information might make discovering a specific person in a company challenging.
All employee information might be sorted alphabetically, making it easy to access individual employee information. This lets website owners track traffic and popular sites, and web server logs often utilize it.
Accounting users utilize this technique to arrange data to determine production costs, future tax responsibilities, pricing trends, etc. It helps stock market forecasters estimate future stock performance. It may also be used to show information more realistically on websites, software code, or data formatting.
It is possible for computer programs, web pages, or data formatting determined by the user to manipulate data and present it to the user in a more understandable manner.
How to Use Data Manipulation Effectively
The financial data manipulation process involves cleaning, transforming, and analyzing numerical information related to an individual’s or organization’s finances to gain insights and make informed decisions. To perform data manipulation effectively, follow these key steps:
- Understand Your Data: Begin by thoroughly understanding your dataset, including its structure, variables, and any limitations or biases.
- Data Cleaning: Clean and preprocess the data to remove inconsistencies, missing values, and outliers. This ensures the existing data is reliable and ready for analysis.
- Data Transformation: Transform the data as needed, such as encoding categorical variables, normalizing numeric values, and creating new features to extract meaningful information.
- Filtering and Selection: Choose relevant subsets of the data processing for specific analyses. This can involve selecting specific rows, columns, or periods.
- Aggregation and Summarization: Aggregate and summarize data to extract insights. Common techniques include group-by operations, aggregating statistics, and creating summary tables or visualizations.
- Feature Engineering: Create new features or variables that may enhance the predictive power of your models. Feature engineering involves a deep understanding of the domain.
- Data Visualization: Visualize your data to identify trends, patterns, and outliers. Visualizations help in communicating findings and making informed decisions.
- Modeling: If your goal is predictive modeling, select appropriate algorithms and train models using the manipulated data. Ensure you use suitable evaluation metrics to assess model performance.
- Iteration: Data manipulation is often an iterative process. Analyze results, refine your data manipulations, and repeat the process as needed to achieve your goals.
- Documentation: Document all your purpose of data manipulation steps, which are critical for reproducibility and collaboration.
- Testing and Validation: Regularly test and validate your data manipulations and analyses to ensure consistent and reliable results.
- Ethical Considerations: When handling and manipulating data, consider privacy, biases, and ethical concerns.
Techniques for Data Manipulation
Data analysis might be difficult if you don’t know how to manipulate data. You may use all these methods to better understand your data or its workings, from learning about various kinds of visualization to looking for outliers. Make things easy on yourself and others by using these simple tips.
Multi-step approaches to effective data manipulation may be quite successful. If you’re looking to manipulate data, here are some standard techniques:
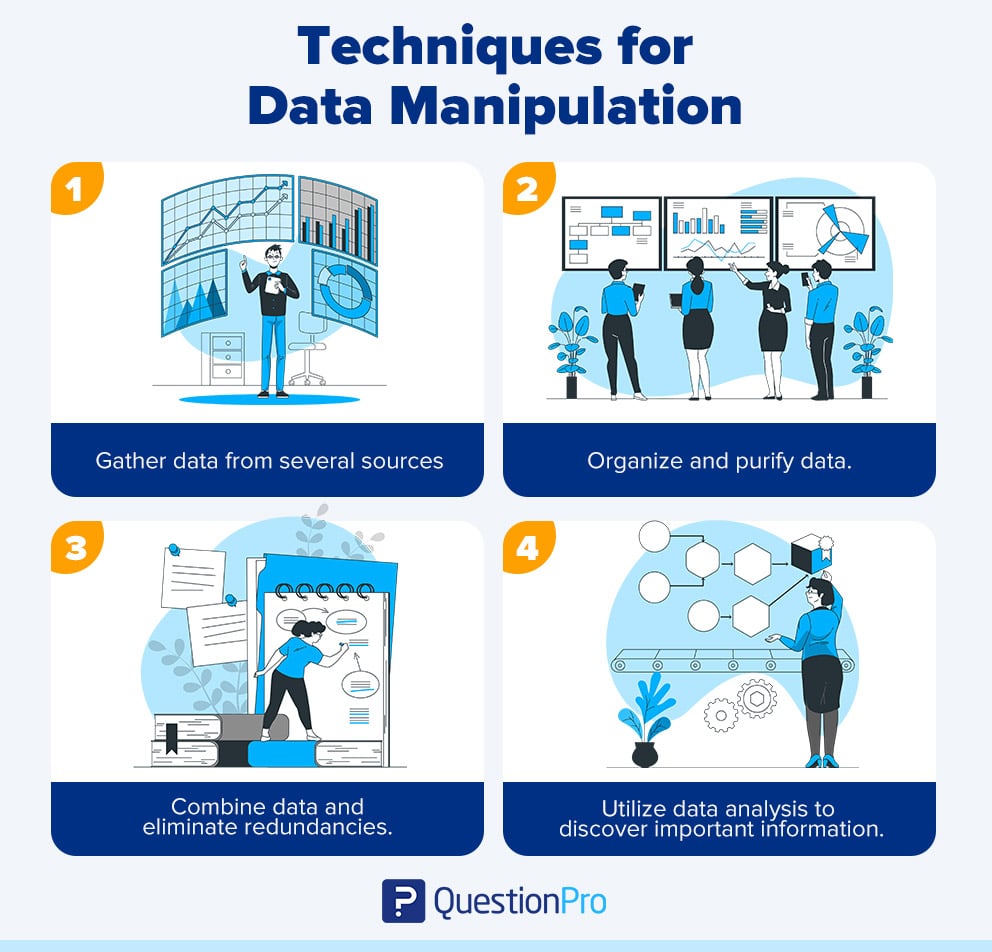
1. Gather Data from Several Sources and Store it in a Database.
Creating a database containing data and information from many sources is the first technological step. This could be a collection you build or an automated program you employ. You may use programs like Microsoft Excel, Google Analytics, and Data Studio to establish a database if you want to do it yourself.
2. Organize and Purify Data.
Another frequent technical step is structuring and cleaning data content to guarantee accuracy and organization. This procedure may be completed for you if you utilize automated software. This might involve ensuring that all data analytics and data are linked in structured patterns.
3. Combine Data and Eliminate Redundancies.
The following technical stage normally involves integrating your data to search for redundancy once you’ve sorted it in the database. This may help you arrange your database by removing overlapping data. This might also mean using a formula to combine data to create comprehensive specialist data to fulfill corporate demands.
5. Utilize Data Analysis to Discover Important Information.
The last technical stage usually involves studying the full data findings to identify helpful information. Consumer purchase patterns, profit insights, and digital brand interaction are examples of beneficial information. The amount of helpful information found and analyzed by a corporation might vary depending on its demands.
Data Manipulation Tools
The modification and handling of data are possible thanks to using data manipulation tools. As a result, data collections promote order and are easy to read and access. The tools enable the identification of patterns and trends in the data with precision, making it easy to find discrete or otherwise invisible data.
Talking about data manipulation is not the same as other data transformation techniques. Data manipulation tools allow data ordering, reorganization, and movement without making essential changes. The data is adapted depending on the needs, whether the sampling of information or the feeding and training of a new analysis model.
Data manipulation tools aim to change the relationship between data elements and not between the data itself. Regression analysis and string manipulation are some of the operations carried out with these tools, from the filtering of rows and columns to the classification.
Several data manipulation tools are available that cater to various data analysis and transformation needs. Here are some widely used tools:
- Microsoft Excel: A versatile spreadsheet tool for basic data manipulation and analysis.
- Python: The Pandas library in Python is popular for data manipulation, offering powerful data structures and tools.
- R: R is a statistical programming language with packages like dplyr and tidyr that excel in data manipulation.
- SQL: Structured Query Language manages and manipulates data in relational databases.
- OpenRefine: A tool for cleaning and transforming messy data, handy for data cleaning.
- Apache Spark: An extensive data processing framework that supports data manipulation for large datasets.
- Tableau Prep: A data preparation tool for cleaning, shaping, and enriching data before analysis in Tableau.
- Trifacta: A user-friendly platform for data wrangling, cleaning, and preparing data for analysis.
- Alteryx: A data blending and advanced analytics platform for data preparation and manipulation.
- Knime: An open-source platform for data analytics, reporting, and integration.
- Excel Power Query: An Excel add-in for advanced data transformation and querying.
- Jupyter Notebooks: Popular for data analysis in Python, it supports code and rich-text elements to document data manipulation processes.
The Advantages of Data Manipulation
Data manipulation improves company and organization development. It helps organize primary data in a structured fashion, which is vital for enhancing efficiency, identifying trends, decreasing expenses, studying client behavior, etc. Below are some advantages to data that gets manipulated.
- Consistency in design: It helps c-suiters grasp business information by singly organizing data. DML (Data Manipulation Language) organizes and makes visible unstructured data from multiple sources.
- Reviewing the Past: This data manipulation helps you make the best choices by offering simple access to past project data. It may assist with team size, budgeting, and deadlines.
- Build Efficiency: This is efficient in obtaining ordered data or valuable information. You may not realize that results conflict or are duplicated; measurements have a minor or major influence on whether the data is meaningful. DML gives you the advantage of swiftly separating and recognizing key facts.
It includes telemarketing calls, tailored advertisements on websites, and email. It helps with online information extraction. When you provide your email address and agree to the terms and conditions on a website, it will track your activity and create relevant information for you.
Conclusion
Data manipulation may be utilized in data science in a variety of ways. It is used to make data more understandable or more structured. Data is best used when it can be manipulated for marketing, sales, accounting, and customer support. Proper data analysis involves rearranging, sorting, modifying, and shifting data.
Finally, data manipulation helps organizations and people to make their data more usable. And to do that, these techniques can be followed.
In addition to survey software, QuestionPro has a solution for every issue and sector. Our research repository, Insights Hub, is one example of the data manipulation tool or data management software we provide.
LEARN ABOUT: Customer data management