What happens after you collect survey data? That’s where the real work begins and where data orchestration steps in. As the volume and complexity of data grow, it’s no longer enough to collect survey responses and hope for clarity simply.
Organizations today need a reliable way to connect data from multiple data sources, clean it for accuracy, and route it efficiently to the right tools, teams, or workflows.
Data orchestration is the process that makes this possible. It’s the behind-the-scenes engine that ensures your survey data, along with CRM inputs, behavioral metrics, or operational records, flows seamlessly through your tech stack.
What is Data Orchestration?
Data orchestration is the process of managing and automating the movement of data between systems, from collection to destination. It goes beyond simple transfers by ensuring data flows efficiently, is properly formatted, and reaches the right tools or teams at the right time.
It’s what turns raw survey responses into usable, actionable information. Here’s how it works:
- Connects multiple data sources.
- Cleans and validates data.
- Enriches with additional context.
- Routes to dashboards, alerts, or reports.
- Automates real-time workflows.
While data integration and ETL (Extract, Transform, Load) focus on moving and transforming data, orchestration adds process intelligence. It handles real-time flows, supports multiple outputs, and makes conditional decisions.
For example, survey feedback can be instantly routed to customer support, logged in a data warehouse, and visualized in a dashboard, all without manual work.
Why Survey Data Needs Orchestration?
Survey campaigns generate a growing volume of data across customer, product, and employee touchpoints. Without orchestration, this data becomes overwhelming, and valuable insights risk being buried or delayed.
To complicate things, different teams use different tools. Marketing looks at analytics dashboards, sales relies on CRM systems, and executives want BI reports. Connecting all these manually is time-consuming and prone to errors.
Manual processes only make this worse, leading to:
- Delays in reporting.
- Mismatched or duplicate data.
- Silos between departments.
- Missed opportunities for real-time action.
Orchestration solves these challenges by ensuring survey data is:
- Cleaned for accuracy and consistency.
- Categorized for easy analysis.
- Routed to the right place, whether that’s a CRM, a data warehouse, or a stakeholder’s inbox.
With orchestration, your survey data doesn’t just sit in a spreadsheet; it powers decisions across your organization, fast.
In Case You Missed It: Journey Orchestration: What It Is, How It Works
Data Orchestration vs Data Integration: Key Differences
If you’re working with survey data (or any kind of data), it’s important to know what data orchestration and data integration do and where they fit into your data flow. Think of data integration as connecting the pipes, while data orchestration is programming how and when the water flows.
Here’s a quick and easy comparison:
| Feature | Data Integration | Data Orchestration |
| Purpose | Moves data between multiple systems. | Manages how, when, and where data flows. |
| Process | Typically, one-way, static transfers. | Dynamic, rules-based workflows with branching logic. |
| Flexibility | Limited to source-destination setup. | Handles data from multiple sources and destinations simultaneously. |
| Real-Time Capabilities | Often batch data processing. | Supports real-time and event-driven automation. |
| Data Handling | Focuses on transferring data. | Includes cleaning, transforming, and routing data. |
| Example | Sends survey data to a database. | Routes responses based on sentiment to CRM, Slack, and BI dashboard. |
Data integration is a necessary part of the puzzle, but data orchestration gives you the full picture. It’s what makes survey data useful across your organization, not just stored.
You May Also Like: Journey Orchestration Platforms: Top 11 Platforms in 2025
Core Components of a Survey-Oriented Data Orchestration System
A good data orchestration system isn’t just about moving data; it’s about making survey responses actually useful. Whether you’re collecting feedback from customers, employees, or event attendees, here are the core building blocks that keep everything flowing smoothly:
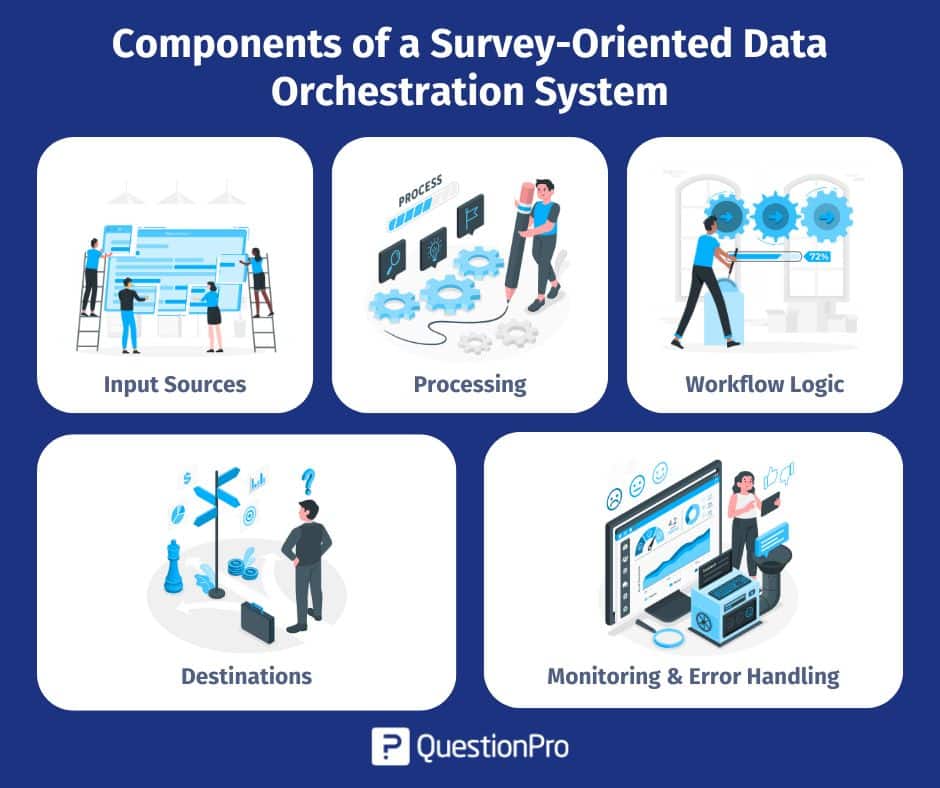
1. Input Sources: Where Your Survey Data Begins
This is where everything begins. In a survey-driven setup, data can come from a variety of sources: online surveys, email campaigns, field surveys at kiosks, or embedded feedback forms on websites and apps.
The orchestration system must be able to pull data from all these sources, regardless of format or channel, and do so in real time or at scheduled intervals.
2. Processing: Cleaning, Validating, and Enriching Your Data
Raw survey data can be messy. This step ensures it’s ready for action:
- Cleaning removes duplicates or incomplete responses.
- Validation checks for logic or input errors.
- Enrichment adds value, like tagging sentiment or grouping by segment.
3. Workflow Logic: Defining Rules and Automations
This is the brain of the system. It defines what happens to the processing data after it’s collected:
- If negative feedback is received → alert support.
- If it’s a completed NPS response → push to the dashboard.
- If it’s from a VIP customer → flag in the CRM.
4. Destinations: Getting Survey Data to the Right Place
Once processed, the data needs to reach the right people and systems. This could mean pushing customer feedback to a CRM like Salesforce, sending NPS scores to a live dashboard, exporting results into spreadsheets for analysis, or triggering team alerts via Slack or email.
The goal is to deliver the right data to the right place instantly and automatically.
5. Monitoring & Error Handling: Keeping Your Data Flow Healthy
Even the best systems need a safety net. A strong orchestration setup includes:
- Automatic alerts when something fails.
- Retry logic if the data doesn’t go through.
- Ongoing checks for quality, volume, or inconsistencies.
- Logging and audit trails to track what happened, when, and why.
Together, these components create a system that not only moves your survey data but also makes it smarter, faster, and more actionable without you needing to chase it down manually.
Also Read: Experience Orchestration: What It Is, Principles, and Uses
Common Use Cases in Research & CX
Data orchestration isn’t just a technical concept; it has a real, everyday impact on how research and customer experience (CX) teams work smarter and faster. Here are some practical examples of how orchestration brings survey data to life:
- Real-time feedback routing to customer support: When a customer submits negative feedback, orchestration can instantly alert the support team so they can follow up before the issue escalates.
- Cleaning NPS survey data before it hits dashboards: No one wants messy metrics. Orchestration ensures incomplete, duplicate, or invalid NPS responses are filtered out before they impact your reports.
- Automatically categorizing open-ended responses: Free-text answers are rich with insight if you can organize them. Orchestration tools can tag comments by topic or sentiment (positive, neutral, negative), making it easier to spot trends.
- Triggering follow-up surveys or interviews: If someone shows high interest in a new feature, orchestration can schedule a follow-up interview or send a deeper survey automatically, with no manual chasing needed.
- Combining multiple survey streams into one dataset: Whether you’re running product, CX, and employee surveys in parallel, orchestration helps unify everything into one clean, centralized view for analysis.
These use cases show how orchestration doesn’t just save time, it creates space for deeper insights and more meaningful customer interactions.
How to Implement Survey Data Orchestration?
Getting started with survey data orchestration might sound technical, but when you break it down, it’s really just about setting up smart, automated workflows that move your data where it needs to go. Here’s a simple step-by-step guide to help you build an orchestration system that works for your team:
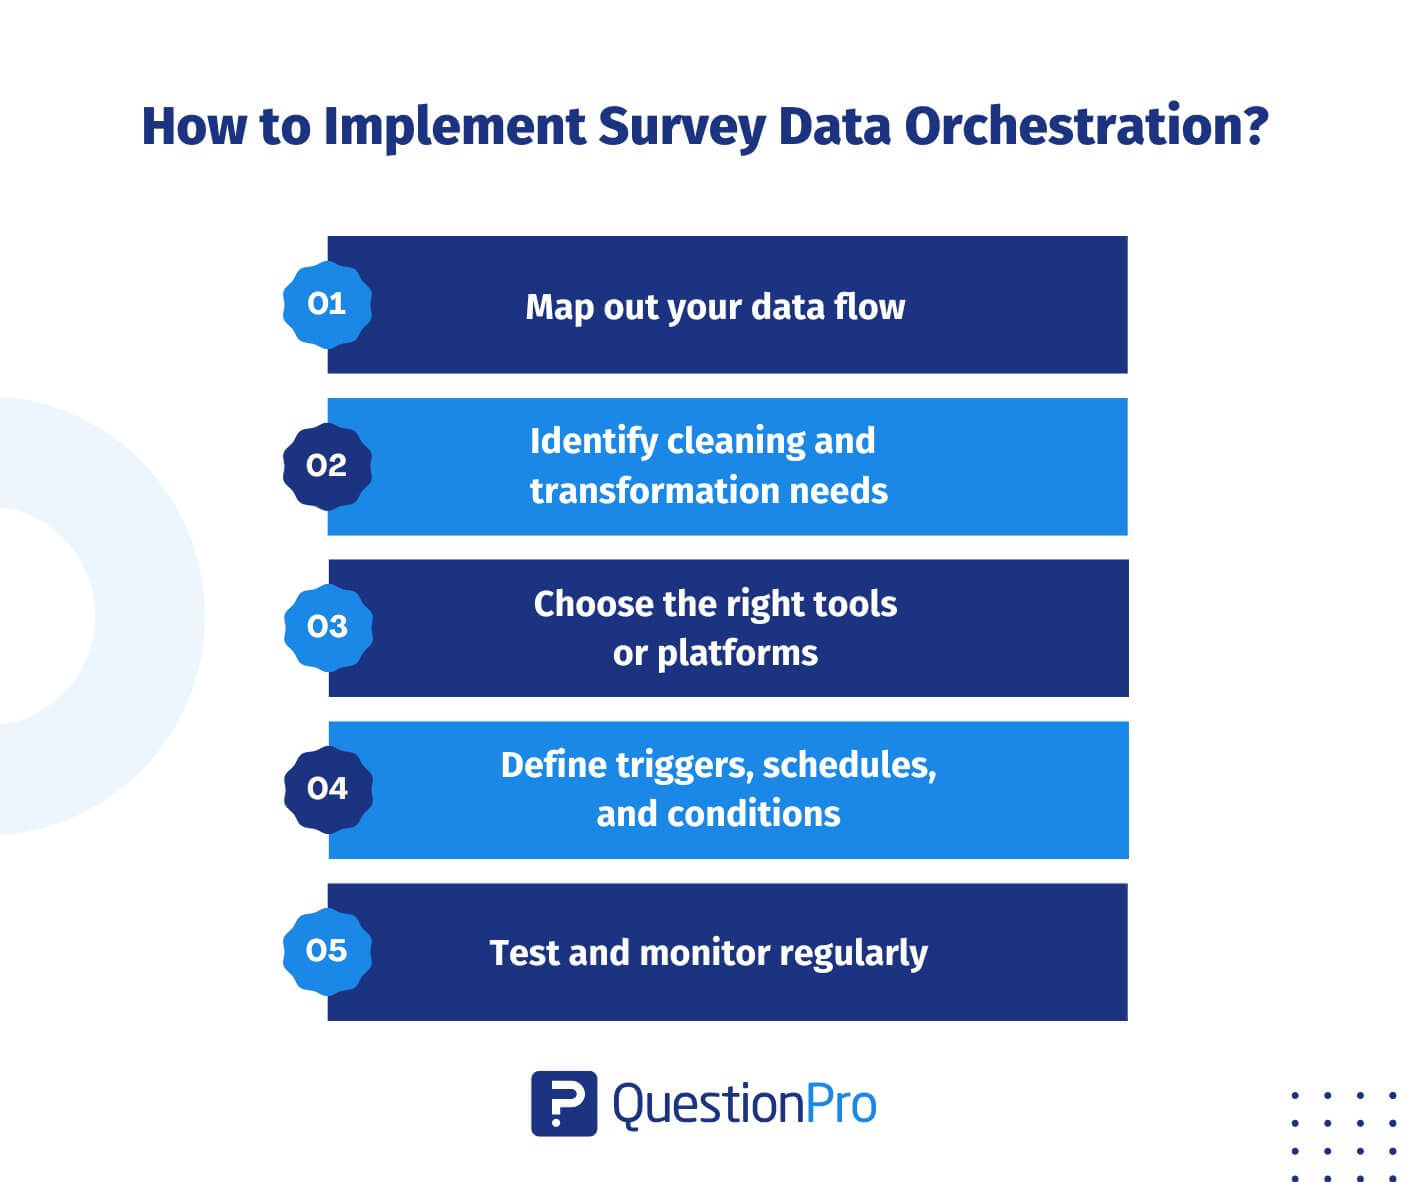
Step 1: Map out your data flow
Start by visualizing how your survey data moves today.
Where is it coming from?
- Online forms.
- Email surveys.
- Field data.
Where should it go?
- CRM.
- Dashboards.
- Team alerts
Mapping this out helps you spot gaps, manual steps, or opportunities for automation.
Step 2: Identify cleaning and transformation needs
Raw survey data often needs some work before it’s useful. Decide what needs to be cleaned (like duplicates, incomplete responses), what should be validated (like logic errors), and how you want to enrich the data (like tagging sentiment or segmenting by demographics).
Step 3: Choose the right tools or platforms
Look for tools that support orchestration, especially those with APIs, integrations, or visual workflow builders. Many survey platforms like QuestionPro, automation tools, or middleware solutions, Make, or custom-built systems can help.
Step 4: Define triggers, schedules, and conditions
Decide what should kick off the data flow.
- Is it when someone submits a survey?
- On a daily schedule?
- Only if certain answers are given?
This is where you build the logic to make your complex data workflows smart and responsive.
Step 5: Test and monitor regularly
Don’t just set it and forget it. Run test data through your pipeline to catch errors early. Set up alerts for failed transfers or unexpected data issues, and check in periodically to make sure everything is running smoothly.
With a clear plan and the right setup, you’ll save time, reduce errors, and make your survey data instantly useful without chasing spreadsheets or hunting down responses.
Challenges & Considerations of Using Data Orchestration
While data orchestration can dramatically streamline your survey workflows, it’s not without its hurdles. As you develop a data orchestration process, consider the following challenges and key considerations, particularly when working with modern data pipelines and automation tools.
- Data consistency and formatting across surveys: Different surveys may use varying formats, question types, or naming. Without standardized inputs, the data transformation process becomes harder, leading to errors or misinterpretations.
- Handling errors and failed data syncs: Automated workflows can break fields that might be missing, and syncs might fail. Your data orchestration tools should include alerts, retries, and monitoring to keep your data pipelines running smoothly.
- Privacy and compliance: Survey data often contains sensitive information. Make sure your orchestration setup meets privacy standards and legal requirements by using secure tools that support data orchestration process best practices.
- Cost and complexity for small teams: Setting up orchestration can feel overwhelming for smaller teams. Start with user-friendly tools that include visual builders or templates to keep complexity and costs low.
- Balancing automation with oversight: Automation saves time, but not every step should run without review. Keep humans in the loop for quality checks and decisions that need context. Smart data orchestration is both efficient and thoughtful.
Keeping these challenges in mind early on will help you build a more resilient, secure, and scalable orchestration system, one that supports your survey goals without adding friction.
Best Practices for Effective Survey Data Orchestration
To get the most out of your automated data orchestration, it’s essential to build on a strong foundation. These best practices will help ensure your customer data stays clean, manageable, and ready to flow through your systems, no matter how complex your setup becomes.
- Start with a clean and structured survey design: Good data management starts at the source. Use consistent formats, clear question labels, and avoid unnecessary complexity. Well-structured inputs reduce the need for extensive cleaning or transformation later in your data analysis tools.
- Use unique identifiers for syncing responses: Assign unique IDs to responses, users, or sessions. This helps your data teams accurately track and sync customer data across CRMs, dashboards, or databases without confusion or duplication.
- Automate where possible, but review periodically: Implementing data orchestration should include automation for routine tasks, but it’s just as important to conduct regular reviews. This ensures data quality, catches outliers, and keeps your pipelines aligned with evolving needs.
- Align all stakeholders on the data flow: Successful data governance means ensuring that everyone from IT to marketing understands how data moves, who owns what, and what triggers which actions. This clarity keeps your automated data orchestration system running efficiently and avoids silos.
With these practices in place, you’re not just orchestrating data, you’re empowering your entire organization to make smarter decisions, faster, using well-managed and properly governed insights.
Real-world Example of Survey Data Orchestration
In today’s research workflows, collecting survey data is just the first step. The real value comes from how quickly and smoothly that data moves through your systems, gets to the right teams, and turns into something useful. That’s exactly what survey data orchestration is all about.
Let’s walk through an example of an NPS survey in an orchestrated Workflow to see how it works in action.
Here’s a step-by-step look at how an NPS survey can flow through an orchestrated system from collection to action. This example shows how automation, integration, and smart routing help teams react faster and get more value from customer feedback.
1. Collect Feedback via NPS Survey
A company sends out its quarterly Net Promoter Score (NPS) survey to thousands of customers across different regions and touchpoints like email, web, or in-app prompts.
2. Cleanse the Data Automatically
As responses come in, automated rules kick in. They filter out incomplete answers, catch duplicates, and fix formatting issues like standardizing country names or making open-text answers lowercase to prep for processing.
3. Push Cleaned Data to Stakeholder Systems
Once the data is clean and validated, each NPS response is sent exactly where it’s needed:
- To Slack: If a customer leaves a detractor score (0–6), a message is instantly posted in the #cx-alerts channel, along with their comment, giving support or product teams real-time visibility.
- To the CRM: Customer profiles in tools like Salesforce or HubSpot are updated with the latest NPS score and comment, so sales and success teams always have the full context.
- To the Power BI dashboard: Real-time NPS data appears in dashboards, segmented by region, product, or customer tier, helping leadership stay on top of trends.
4. Unify Feedback from Multiple Campaigns
This orchestration doesn’t stop with NPS. Similar workflows are set up for product satisfaction surveys, onboarding feedback, and support follow-ups. All of that data flows into a central reporting system automatically tagged, time-stamped, and aggregated, making cross-survey analysis fast and simple.
5. Tag Responses and Route to Product Teams
With sentiment analysis or keyword detection in place:
- Comments that mention things like “feature request” or “bug” are automatically tagged.
- Those tagged responses are sent straight to the relevant product team via Slack, a shared doc, or even added as a task in a project management tool, closing the feedback loop quickly and efficiently.
This kind of setup doesn’t just save time, it ensures feedback is seen, shared, and acted on by the right people, right when it matters most. That’s the power of smart survey data orchestration
How to Turn Raw Survey Data into Insights Using QuestionPro?
Collecting survey responses is just the beginning. The real value comes when that data is quickly cleaned, routed, and turned into actionable insight. QuestionPro helps you go from raw, unstructured responses to decision-ready intelligence all in one platform.
Here’s how the process works, step by step:
1. Design Smart Surveys to Minimize Data Cleanup
Before any data is collected, QuestionPro helps you build cleaner surveys from the start:
- Use validation rules (like numeric input or required fields).
- Apply skip and branching logic to guide respondents.
- Add pre-filled variables for consistent tagging.
Smart design reduces cleanup and keeps your data ready for analysis.
2. Automatically Clean and Structure Incoming Responses
As responses come in, QuestionPro filters out low-quality data like speeding or straight-lining. It also standardizes answer formats across surveys and merges datasets from different touchpoints. Open-text responses can be auto-tagged using keywords or sentiment analysis, saving you time on manual coding.
3. Use Webhooks and APIs to Orchestrate Data Across Tools
With webhooks and APIs, QuestionPro sends responses wherever they’re needed. Detractor NPS scores can trigger Slack or Teams alerts. CRM records update in real time, and responses can be exported to Google Sheets or cloud storage. The API also supports full automation in BI tools like Power BI or Tableau.
4. Build Real-Time Dashboards and Visual Reports
With QuestionPro’s analytics engine, you can:
- View responses in real time.
- Segment by location, demographics, or channels.
- Track metrics like CSAT, CES, and NPS.
- Export charts and visuals for presentations.
Or connect to your favorite BI tools for advanced reporting.
5. Close the Loop with Automated Workflows
Once insights are detected, QuestionPro can route them automatically:
- Create Jira tickets for feedback related to bugs.
- Add feature requests to Notion or Trello.
- Notify managers when satisfaction scores drop.
These automations help teams take action without delays.
Using QuestionPro, turning raw survey data into insight doesn’t require heavy manual work or third-party tools. Its native automation features, integrations, and analytics capabilities allow you to:
- Clean data at the point of entry.
- Orchestrate response routing in real time.
- Extract and visualize meaningful trends.
- Act on feedback quickly across departments.
Whether you’re running a customer experience program, measuring employee engagement, or conducting academic research, QuestionPro makes it easier to go from collecting feedback to making decisions quickly, accurately, and at scale.
Conclusion
As organizations collect feedback across more channels, touchpoints, and teams, the ability to connect, clean, and route data efficiently becomes critical. Without data orchestration, valuable insights stay stuck in silos or get lost in manual workflows.
By building an orchestration system for your survey operations or by using platforms like QuestionPro that already offer powerful automation, integration, and analytics tools, you ensure that your feedback becomes fuel for smarter, faster decisions.
Whether you’re working in research, customer experience, or employee engagement, the path from data collection to insight doesn’t have to be complicated. With the right tools, workflows, and best practices in place, survey data orchestration seamlessly turns scattered responses into real impact.
Frequently Asked Questions (FAQs)
Answer: Data integration focuses on moving data from one system to another, often in a one-way or batch process. Data orchestration goes further; it manages how, when, and where data flows, adds cleaning and transformation steps, and supports real-time, rules-based routing across multiple tools.
Answer: Survey data orchestration works for both. While large enterprises often have complex pipelines, small teams can also benefit significantly by utilizing lightweight, no-code tools or built-in automation features to save time and reduce manual work.
Answer: Orchestration includes automated cleaning, validation, and enrichment steps. This removes duplicates, fixes formatting issues, and tags responses for easier analysis, ensuring only accurate, consistent, and usable data reaches your dashboards and reports.
Answer: QuestionPro integrates with CRMs like Salesforce and HubSpot, collaboration tools like Slack and Microsoft Teams, cloud storage such as Google Sheets, and BI platforms like Power BI and Tableau. You can also use APIs or middleware like Make to connect with other systems.
Answer: Yes. Orchestration can handle numeric metrics like NPS, CSAT, or CES alongside open-ended feedback. With sentiment analysis and keyword tagging, even qualitative data can be automatically categorized and routed to the right teams.