• Skip to main content
  • Skip to primary sidebar
  • Skip to footer
QuestionPro

QuestionPro

questionpro logo
  • Products
    survey software iconSurvey softwareEasy to use and accessible for everyone. Design, send and analyze online surveys.research edition iconResearch SuiteA suite of enterprise-grade research tools for market research professionals.CX iconCustomer ExperienceExperiences change the world. Deliver the best with our CX management software.WF iconEmployee ExperienceCreate the best employee experience and act on real-time data from end to end.
  • Solutions
    IndustriesGamingAutomotiveSports and eventsEducationGovernment
    Travel & HospitalityFinancial ServicesHealthcareCannabisTechnology
    Use CaseAskWhyCommunitiesAudienceContactless surveysMobile
    LivePollsMember ExperienceGDPRPositive People Science360 Feedback Surveys
  • Resources
    BlogeBooksSurvey TemplatesCase StudiesTrainingHelp center
  • Features
  • Pricing
Language
  • English
  • Español (Spanish)
  • Português (Portuguese (Brazil))
  • Nederlands (Dutch)
  • العربية (Arabic)
  • Français (French)
  • Italiano (Italian)
  • 日本語 (Japanese)
  • Türkçe (Turkish)
  • Svenska (Swedish)
  • Hebrew IL (Hebrew)
  • ไทย (Thai)
  • Deutsch (German)
  • Portuguese de Portugal (Portuguese (Portugal))
Call Us
+1 800 531 0228 +1 (647) 956-1242 +52 999 402 4079 +49 301 663 5782 +44 20 3650 3166 +81-3-6869-1954 +61 2 8074 5080 +971 529 852 540
Log In Log In
SIGN UP FREE

Home Market Research

Interval Scale: Definition, Characteristics & Examples

Interval Scale with Examples

As you create a plan for analyzing quantitative data from your surveys, chances are you’ve come across the phrase “interval scale.” But what is it, and how does it differ from commonly associated terms like “nominal scale” and “ordinal scale”?

We’ll cover the definition, describe key characteristics, and provide interval scale examples that could be especially useful for your survey strategy.

Content Index hide
1. What is the Interval Scale?
2. Characteristics of Interval Scale
3. Importance of Interval Scales in Data Measurement
4. Interval Scale Examples
5. Conclusion

What is the Interval Scale?

The interval scale is a quantitative measurement scale where there is order, the difference between the two variables is meaningful and equal, and the presence of zero is arbitrary. It measures variables that exist along a common scale at equal intervals. The measures used to calculate the distance between the variables are highly reliable.

The interval scale is the third level of measurement after the nominal scale and the ordinal scale. Understanding the first two levels will help you differentiate interval measurements.

A nominal scale is used when variables do not have a natural order or ranking. You can include numbered or unnumbered variables, but common survey examples include gender questions, location, political party, pets, and so on.

In contrast, on an ordinal scale, the rank of variables matters, but the difference or distance between the variables doesn’t. Think about price range filters for online shopping. You can select “less than $25,” “$26 up to $50,” and so forth, but the difference between them is not relevant. Likewise, the ranking of variables such as “Would not recommend” and “Would highly recommend” matters, but the difference between them does not unless that difference is represented by another variable.  

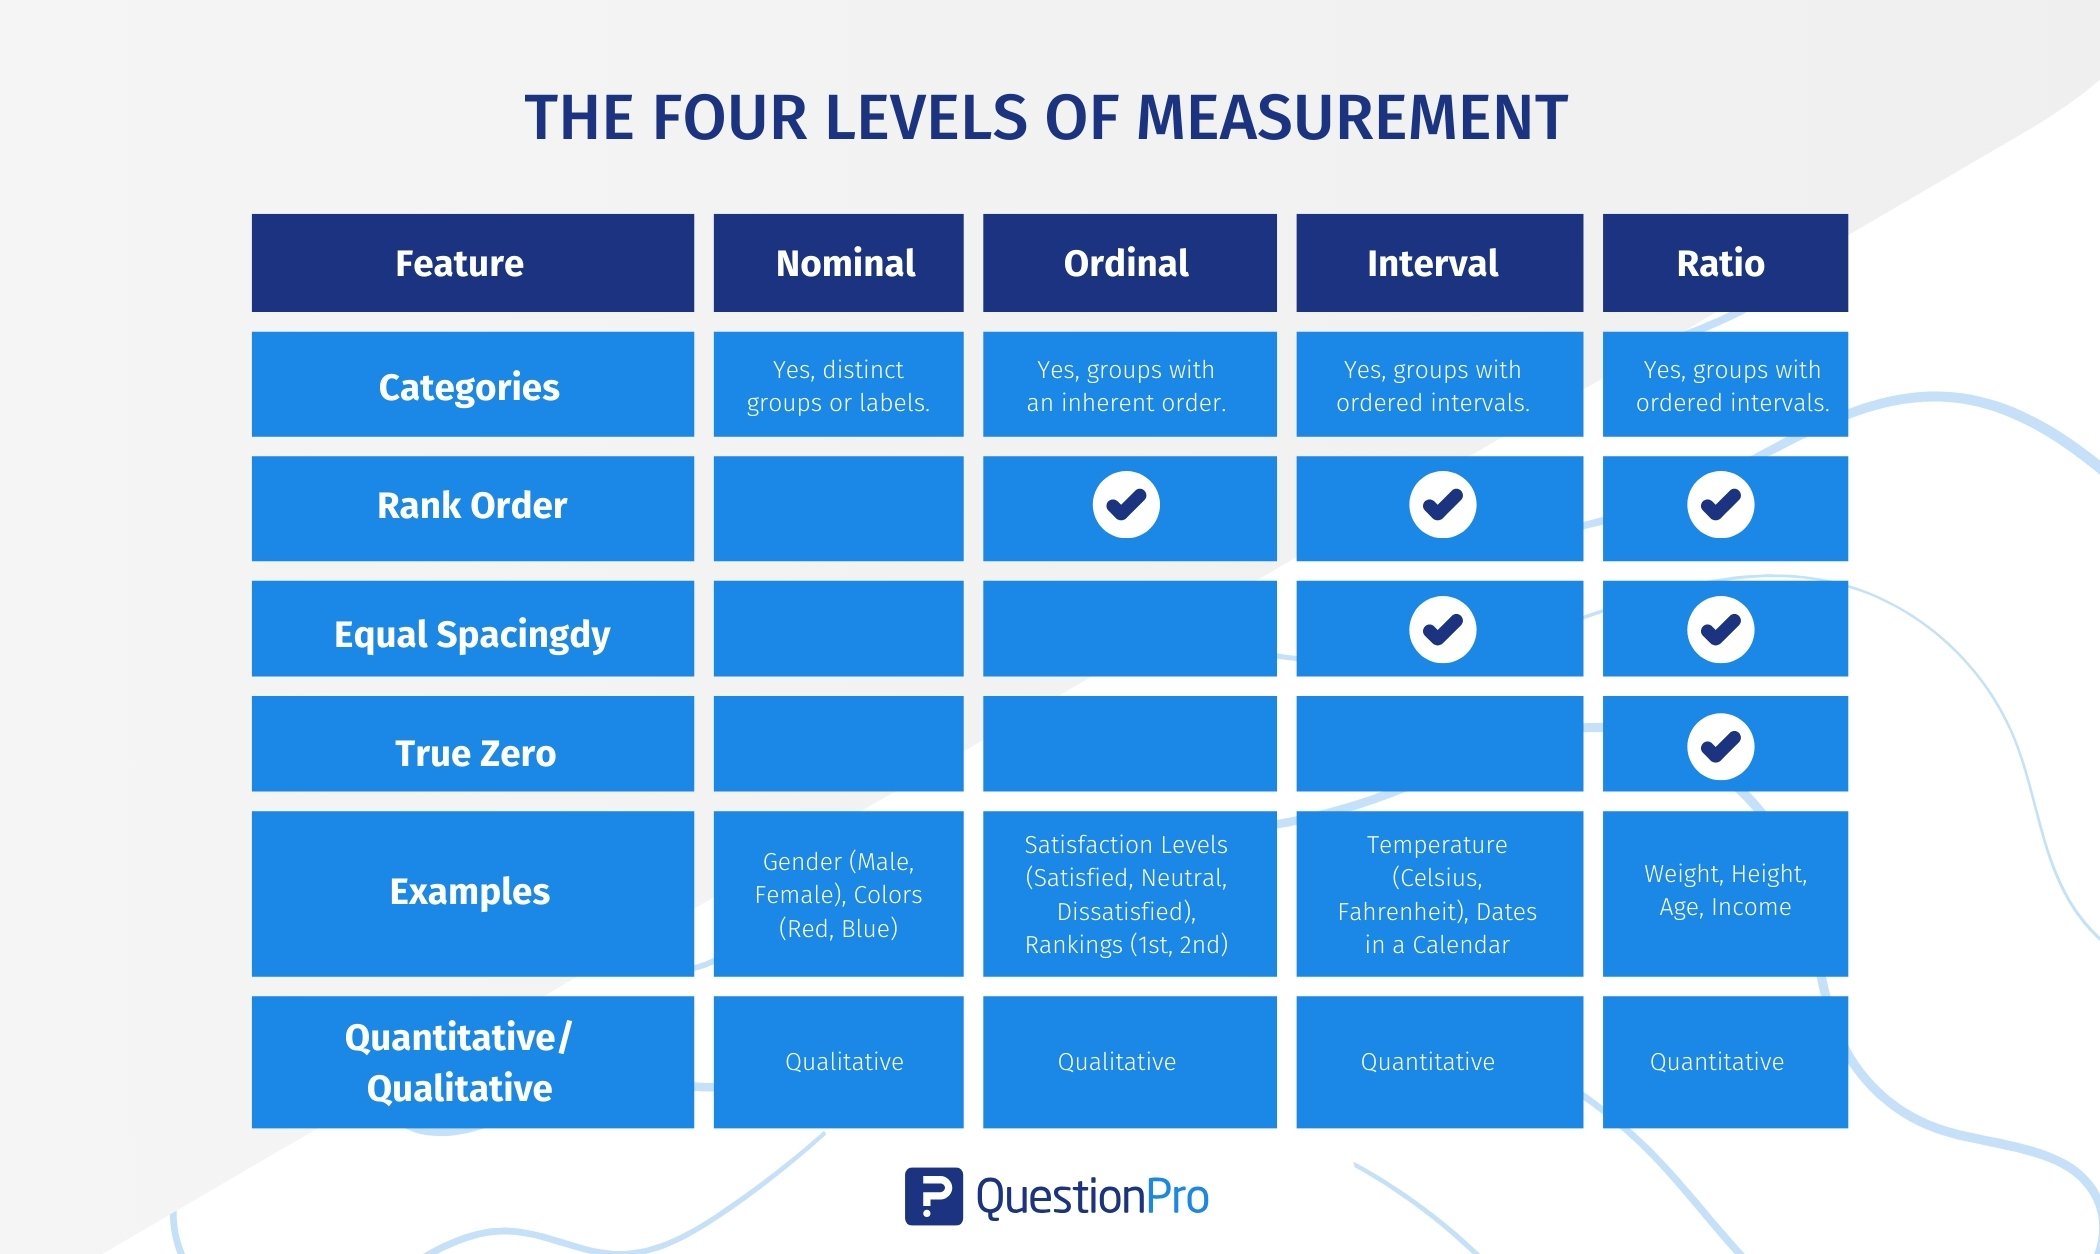
Here is a detailed comparison to help you easily understand the differences between the main measurement scales.

the-four-level-of-measurement

Characteristics of Interval Scale

Now that you’re familiar with the first two scales of measurement, it’s much easier to understand them. In a sense, it’s the combination of the other scales. The trickiest part about the interval scale is probably the fact that there is no true zero. But when you think about it, some variables do not have a universally constant zero.

Consider this interval scale example: temperature in degrees Fahrenheit.

If you’re analyzing temperatures in degrees Fahrenheit, say 20-40 degrees and 40-60 degrees, there is order, and the difference between variables is meaningful, but the presence of zero is arbitrary. How is zero arbitrary? Zero degrees on the Fahrenheit (and Celsius) scale is not a universal constant but instead assigned to represent the temperature at which brine made from equal parts of ice, water, and salt freezes.

Let’s not get too wrapped up in the particulars of temperature, though. Your surveys will likely focus on other variables. It is easy to remember the objective of this scale because “interval” refers to the interval (or distance) between two variables. Another way to remember this scale is that the data between two variables can be added or subtracted but not multiplied or divided. This is unlike the ratio scale, where division is defined between two variables.

Want an easy guide to the interval scale and its data? We’ve listed key characteristics here:

Characteristics of the interval scale
  1. The interval scale is preferred to the nominal scale or ordinal scale because the latter two are qualitative scales. The interval scale is quantitative in the sense that it can quantify the difference between values.
  2. Interval data can be discrete with whole numbers like 8 degrees, 4 years, 2 months, etc., or continuous with fractional numbers like 12.2 degrees, 3.5 weeks or 4.2 miles.
  3. You can subtract values between two variables to help understand the difference between them.
  4. Interval measurement allows you to calculate the mean and median of variables.
  5. Interval data is especially useful in business, social, and scientific analysis and strategy because it is straightforward and quantitative.
  6. This is a preferred scale in statistics because you can assign a numerical value to any arbitrary 360 leadership assessment, such as feelings and sentiments.

Now that you know how to spot the interval scale when you see it, let’s take a look at some useful interval scale examples.

Importance of Interval Scales in Data Measurement

Interval scales are important in data measurement for several reasons, making them a valuable tool in research and analysis. Here’s a simple breakdown of their significance:

1. Equal Distances

Interval scales measure data with equal distances between points. This means that the difference between 10 and 20 is the same as the difference between 30 and 40. This consistency allows us to make meaningful comparisons.

2. Mathematical Operations

Because the intervals are consistent, we can perform a range of mathematical calculations. We can add, subtract, and compute averages.

3. No True Zero

Interval scales do not have a true zero point. For instance, in Celsius, 0°C doesn’t mean “no temperature”—it’s just a point on the scale. This is different from ratio scales (like weight), where zero means none. Even without a true zero, we can still talk about differences, like saying one temperature is warmer than another.

4. Real-World Examples

You can find interval scales in everyday life. Common examples include temperature (Celsius and Fahrenheit) and calendar years. Understanding these scales helps us interpret data in areas like weather forecasting or historical trends.

5. Easy to Understand

The equal intervals make it easy for anyone to grasp the meaning behind the numbers.

6. Supports Advanced Analysis

Many statistical methods rely on interval data. This means researchers can use tools like averages and correlations to analyze their data effectively.

Interval Scale Examples

Questions that can be measured on the interval scale are the most commonly used question types in research studies. To receive answers in the form of interval data, you need to limit feedback options to variables that can be assigned a numerical value where the difference between the two variables is equal.

You have probably seen the following scales used in a research study: agreement, satisfaction levels, or likelihood. The survey needs to be scaled so variables can meet the criteria of interval measurement. Otherwise, the data you receive in feedback will be difficult to quantify.

Consider these questions as you write your next survey. They are all compatible with the interval scale and offer actionable data:

Likert Scale

One of the most commonly used interval scale questions is arranged on a five-point Likert Scale question, where each emotion is denoted with a number, and the variables range from extremely dissatisfied to extremely satisfied.

Likert Scale

Net Promoter Score (NPS)

In a Net Promoter Score (NPS) question, the respondents reply on a scale of 1-10 rating how likely they are to refer a company/product/service to a peer.

Net Promoter Score (NPS)

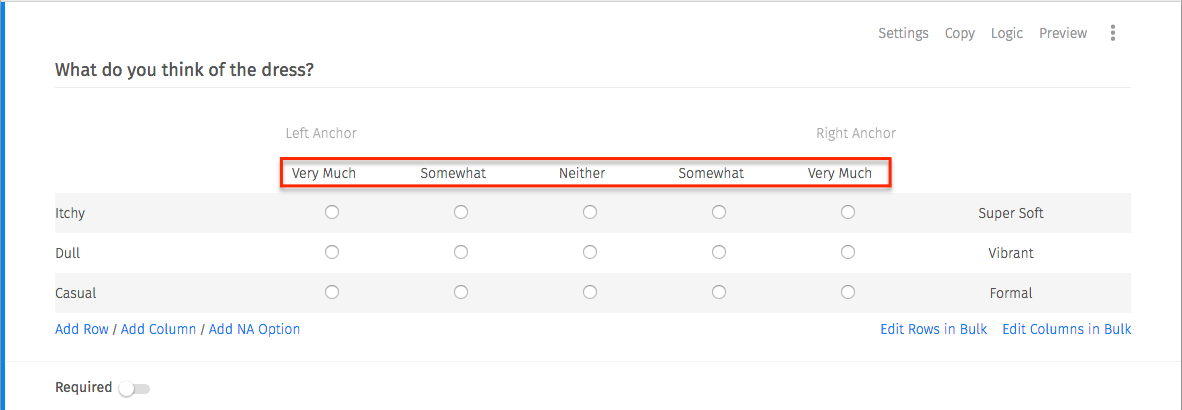
Bipolar Matrix Table

When you include this type of question, participants assess an object on a bipolar matrix table using a five-point rating scale that helps you quantify sentiments by creating a ranking system.

LEARN ABOUT: Bipolar Questionnaire

Bipolar Matrix Scale

 Conclusion

The interval scale gives survey strategists the ability to quantify and differentiate between options so their feedback can contribute to meaningful goals and results. It’s often more effective for most businesses and scientific studies than the nominal scale or ordinal scale, as it can account for quantitative outcomes. 

QuestionPro makes it easy to write, share, and analyze surveys to gather deep insights. Use this article to select the best interval scale question-answer types for your next study.

SHARE THIS ARTICLE:

About the author
Adi Bhat
Aditya Bhat, a.k.a. ‘Adi’, is a thought leader in market strategy and business development. He leads QuestionPro's sales teams to partner with companies, government organizations, and nonprofit institution.
View all posts by Adi Bhat

Primary Sidebar

Research what's on your mind. Find out what's on theirs!

A suite of tools to leverage research and transform insights.

Discover our insight platform

RELATED ARTICLES

HubSpot - QuestionPro Integration

Postal Survey: What it is, Drawbacks + Alternative

Jan 01,2024

HubSpot - QuestionPro Integration

Post-Test Surveys: Definition, Elements & How to Create One

Nov 03,2023

HubSpot - QuestionPro Integration

Top 12 Formstack Alternatives & Competitors in 2025

Jan 31,2023

BROWSE BY CATEGORY

  • Academic
  • Academic Research
  • Artificial Intelligence
  • Assessments
  • Audience
  • Brand Awareness
  • Business
  • Case Studies
  • Communities
  • Consumer Insights
  • Customer effort score
  • Customer Engagement
  • Customer Experience
  • Customer Loyalty
  • Customer Research
  • Customer Satisfaction
  • CX
  • Employee Benefits
  • Employee Engagement
  • Employee Engagement
  • Employee Retention
  • Enterprise
  • Events
  • Forms
  • Friday Five
  • General Data Protection Regulation
  • Guest Post
  • Insights Hub
  • Life@QuestionPro
  • LivePolls
  • Market Research
  • Marketing
  • Mobile
  • Mobile App
  • Mobile diaries
  • Mobile Surveys
  • New Features
  • non-profit
  • NPS
  • Online Communities
  • Polls
  • Question Types
  • Questionnaire
  • QuestionPro
  • QuestionPro Products
  • Release Notes
  • Research Tools and Apps
  • Revenue at Risk
  • Startups
  • Survey Templates
  • Surveys
  • Tech News
  • Tips
  • Training
  • Training Tips
  • Trending
  • Tuesday CX Thoughts (TCXT)
  • Uncategorized
  • VOC
  • Webinar
  • Webinars
  • What’s Coming Up
  • Workforce
  • Workforce Intelligence

Footer

MORE LIKE THIS

wells-fargo-nps-2025

Wells Fargo NPS 2025: What Businesses Can Learn

May 19, 2025

word-cloud

Word Cloud: What it is & How to Use QuestionPro Word Cloud?

May 16, 2025

synthetic data and ai - market research

Redefining Research Strategy with AI and Synthetic Data

May 15, 2025

Kohl's-NPS-2025

Kohl’s NPS & Satisfaction in 2025

May 15, 2025

Other categories

  • Academic
  • Academic Research
  • Artificial Intelligence
  • Assessments
  • Audience
  • Brand Awareness
  • Business
  • Case Studies
  • Communities
  • Consumer Insights
  • Customer effort score
  • Customer Engagement
  • Customer Experience
  • Customer Loyalty
  • Customer Research
  • Customer Satisfaction
  • CX
  • Employee Benefits
  • Employee Engagement
  • Employee Engagement
  • Employee Retention
  • Enterprise
  • Events
  • Forms
  • Friday Five
  • General Data Protection Regulation
  • Guest Post
  • Insights Hub
  • Life@QuestionPro
  • LivePolls
  • Market Research
  • Marketing
  • Mobile
  • Mobile App
  • Mobile diaries
  • Mobile Surveys
  • New Features
  • non-profit
  • NPS
  • Online Communities
  • Polls
  • Question Types
  • Questionnaire
  • QuestionPro
  • QuestionPro Products
  • Release Notes
  • Research Tools and Apps
  • Revenue at Risk
  • Startups
  • Survey Templates
  • Surveys
  • Tech News
  • Tips
  • Training
  • Training Tips
  • Trending
  • Tuesday CX Thoughts (TCXT)
  • Uncategorized
  • VOC
  • Webinar
  • Webinars
  • What’s Coming Up
  • Workforce
  • Workforce Intelligence

questionpro-logo-nw
Help center Live Chat SIGN UP FREE
  • Sample questions
  • Sample reports
  • Survey logic
  • Branding
  • Integrations
  • Professional services
  • Security
  • Survey Software
  • Customer Experience
  • Workforce
  • Communities
  • Audience
  • Polls Explore the QuestionPro Poll Software - The World's leading Online Poll Maker & Creator. Create online polls, distribute them using email and multiple other options and start analyzing poll results.
  • Research Edition
  • LivePolls
  • InsightsHub
  • Blog
  • Articles
  • eBooks
  • Survey Templates
  • Case Studies
  • Training
  • Webinars
  • All Plans
  • Nonprofit
  • Academic
  • Qualtrics Alternative Explore the list of features that QuestionPro has compared to Qualtrics and learn how you can get more, for less.
  • SurveyMonkey Alternative
  • VisionCritical Alternative
  • Medallia Alternative
  • Likert Scale Complete Likert Scale Questions, Examples and Surveys for 5, 7 and 9 point scales. Learn everything about Likert Scale with corresponding example for each question and survey demonstrations.
  • Conjoint Analysis
  • Net Promoter Score (NPS) Learn everything about Net Promoter Score (NPS) and the Net Promoter Question. Get a clear view on the universal Net Promoter Score Formula, how to undertake Net Promoter Score Calculation followed by a simple Net Promoter Score Example.
  • Offline Surveys
  • Customer Satisfaction Surveys
  • Employee Survey Software Employee survey software & tool to create, send and analyze employee surveys. Get real-time analysis for employee satisfaction, engagement, work culture and map your employee experience from onboarding to exit!
  • Market Research Survey Software Real-time, automated and advanced market research survey software & tool to create surveys, collect data and analyze results for actionable market insights.
  • GDPR & EU Compliance
  • Employee Experience
  • Customer Journey
  • Synthetic Data
  • About us
  • Executive Team
  • In the news
  • Testimonials
  • Advisory Board
  • Careers
  • Brand
  • Media Kit
  • Contact Us

QuestionPro in your language

  • English
  • Español (Spanish)
  • Português (Portuguese (Brazil))
  • Nederlands (Dutch)
  • العربية (Arabic)
  • Français (French)
  • Italiano (Italian)
  • 日本語 (Japanese)
  • Türkçe (Turkish)
  • Svenska (Swedish)
  • Hebrew IL (Hebrew)
  • ไทย (Thai)
  • Deutsch (German)
  • Portuguese de Portugal (Portuguese (Portugal))

Awards & certificates

  • survey-leader-asia-leader-2023
  • survey-leader-asiapacific-leader-2023
  • survey-leader-enterprise-leader-2023
  • survey-leader-europe-leader-2023
  • survey-leader-latinamerica-leader-2023
  • survey-leader-leader-2023
  • survey-leader-middleeast-leader-2023
  • survey-leader-mid-market-leader-2023
  • survey-leader-small-business-leader-2023
  • survey-leader-unitedkingdom-leader-2023
  • survey-momentumleader-leader-2023
  • bbb-acredited
The Experience Journal

Find innovative ideas about Experience Management from the experts

  • © 2022 QuestionPro Survey Software | +1 (800) 531 0228
  • Sitemap
  • Privacy Statement
  • Terms of Use