• Skip to main content
  • Skip to primary sidebar
  • Skip to footer
QuestionPro

QuestionPro

questionpro logo
  • Products
    survey software iconSurvey softwareEasy to use and accessible for everyone. Design, send and analyze online surveys.research edition iconResearch SuiteA suite of enterprise-grade research tools for market research professionals.CX iconCustomer ExperienceExperiences change the world. Deliver the best with our CX management software.WF iconEmployee ExperienceCreate the best employee experience and act on real-time data from end to end.
  • Solutions
    IndustriesGamingAutomotiveSports and eventsEducationGovernment
    Travel & HospitalityFinancial ServicesHealthcareCannabisTechnology
    Use CaseAskWhyCommunitiesAudienceContactless surveysMobile
    LivePollsMember ExperienceGDPRPositive People Science360 Feedback Surveys
  • Resources
    BlogeBooksSurvey TemplatesCase StudiesTrainingHelp center
  • Features
  • Pricing
Language
  • English
  • Español (Spanish)
  • Português (Portuguese (Brazil))
  • Nederlands (Dutch)
  • العربية (Arabic)
  • Français (French)
  • Italiano (Italian)
  • 日本語 (Japanese)
  • Türkçe (Turkish)
  • Svenska (Swedish)
  • Hebrew IL (Hebrew)
  • ไทย (Thai)
  • Deutsch (German)
  • Portuguese de Portugal (Portuguese (Portugal))
Call Us
+1 800 531 0228 +1 (647) 956-1242 +52 999 402 4079 +49 301 663 5782 +44 20 3650 3166 +81-3-6869-1954 +61 2 8074 5080 +971 529 852 540
Log In Log In
SIGN UP FREE

Home Workforce

Spearman correlation coefficient: Formula + Calculation

The Spearman correlation coefficient is for ranking correlation between two ranked variables or a ranked variable and a measurement variable.

Spearman correlation coefficient: Definition

The Spearman’s rank coefficient of correlation or Spearman correlation coefficient is a nonparametric measure of rank correlation (statistical dependence of ranking between two variables).

Named after Charles Spearman, it is often denoted by the Greek letter ‘ρ’ (rho) and is primarily used for data analysis.

It measures the strength and direction of the association between two ranked variables. But before we talk about the Spearman correlation coefficient, it is important to understand Pearson’s correlation first. A Pearson correlation is a statistical measure of the strength of a linear relationship between paired data.

For the calculation and significance testing of the ranking variable, it requires the following data assumption to hold true:

  • Interval or ratio level
  • Linearly related
  • Bivariant distributed

If your data doesn’t meet the above assumptions, then you would need Spearman’s Coefficient. It is necessary to know what monotonic function is to understand Spearman correlation coefficient. A monotonic function is one that either never decreases or never increases as it is an independent variable increase. A monotonic function can be explained using the image below:

Spearman's Ran coefficient of Correlation

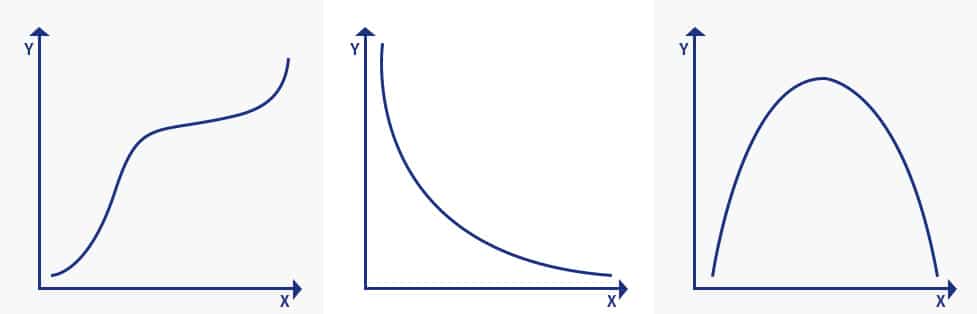
The image explains three concepts in monotonic function:

  1. Monotonically increasing: When the ‘x’ variable increases and the ‘y’ variable never decreases.
  2. Monotonically decreasing: When the ‘x’ variable increases but the ‘y’ variable never increases
  3. Not monotonic: When the ‘x’ variable increases and the ‘y’ variable sometimes increases and sometimes decreases.

Monotonic relation is less restrictive when compared to a linear relationship that is used in Pearson’s coefficient. Although monotonicity is not the ultimate requirement for Spearman correlation coefficient, it will not be meaningful to pursue Spearman’s correlation without actually determining the strength and direction of a monotonic relationship if it was already known that the relationship between the variable is non-monotonic.

Learn more: Correlational Research

Spearman correlation coefficient: Formula and Calculation with Example

Spearman's Rank Coefficient of Correlation

Here,

n= number of data points of the two variables

di= difference in ranks of the “ith” element

The Spearman Coefficient,⍴, can take a value between +1 to -1 where,

  • A ⍴ value of +1 means a perfect association of rank
  • A ⍴ value of 0 means no association of ranks
  • A ⍴ value of -1 means a perfect negative association between ranks.

Closer the ⍴ value to 0, weaker is the association between the two ranks.

We must be able to rank the data before proceeding with the Spearman’s Rank Coefficient of Correlation. It is important to observe if increasing one variable, the other variable follows a monotonic relation.

At every level, you will need to compare the values of the two variables. Here is how the calculations work:

The scores of 9 students in History and Geography are mentioned in the table below.

Step 1- Create a table of the data obtained.

Step 2- Start by ranking the two data sets. Data ranking can be achieved by assigning the ranking “1”  to the biggest number in the column, “2” to the second biggest number and so forth. The smallest value will usually get the lowest ranking. This should be done for both sets of measurements.

Step 3- Add a third column d to your data set, d here denotes the difference between ranks. For example, if the first student’s physics rank is 3 and the math rank is 5 then the difference in the rank is 3. In the fourth column, square your d values.

History RankGeographyRankdd square
35330524
23533324
47145211
17623600
1078811
43249111
9812711
694900
28431400
     12

Step 4- Add up all your d square values, which is 12 (∑d square)

Step 5- Insert these values in the formula

Spearman's Rank Coefficient of Correlation

=1-(6*12)/(9(81-1))

=1-72/720

=1-01

=0.9

The Spearman’s Rank Correlation for this data is 0.9 and as mentioned above if the ⍴ value is nearing +1 then they have a perfect association of rank.

Transform your organization with our Employee Experience Survey and Analytics Platform. Request Demo

How to Conduct a correlation coefficient with QuestionPro

In this section, you will learn how you can run Spearman’s Rank Coefficient of Correlation for your survey.

Step 1: Go to My Surveys →Select Survey→Analytics

Step 2: Click on Correlational Analysis under Analysis

Spearman's Rank Coefficient of Correlation


Step 3: Click on Generate Spearman Coefficient button to get a detailed report

Spearman's Rank Coefficient of Correlation


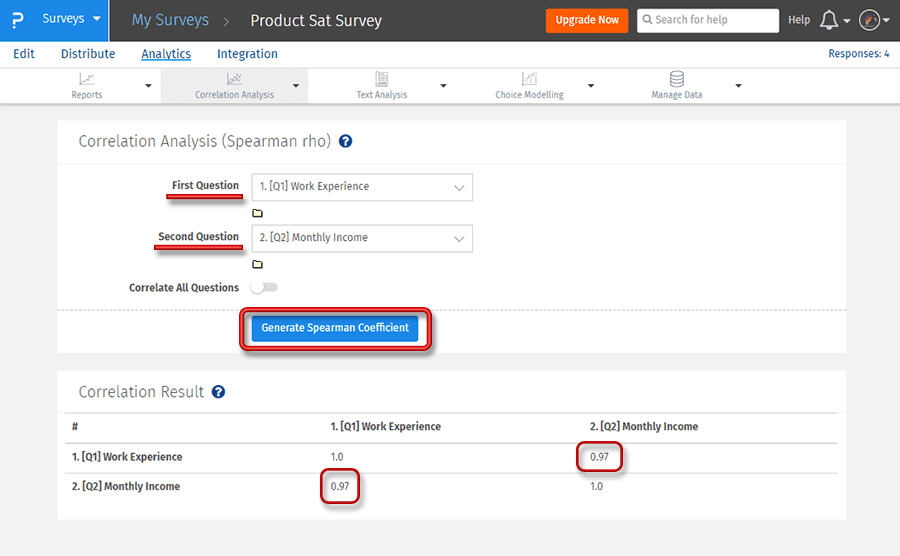
In the above example, the Spearman coefficient of correlation is used to find out the relationship between the two variables, Work experience and Monthly income. A general notion is monthly income should increase with work experience, which means there should be a positive association between the two variables which is proved by the rs value which is 0.97

Learn more: GAP Analysis- Definition, Method and Template with Example  

Create a free account

SHARE THIS ARTICLE:

About the author
Adi Bhat
Aditya Bhat, a.k.a. ‘Adi’, is a thought leader in market strategy and business development. He leads QuestionPro's sales teams to partner with companies, government organizations, and nonprofit institution.
View all posts by Adi Bhat

Primary Sidebar

Take your people experience to the next level!

Try our Employee Experience Survey and Analytics platform

Learn more

RELATED ARTICLES

HubSpot - QuestionPro Integration

In-app Microsurveys: What They Are, Benefits & Uses

Jul 31,2022

HubSpot - QuestionPro Integration

6 Steps to Building an Effective Customer Success Plan

Oct 17,2022

HubSpot - QuestionPro Integration

First Party Data: What is it, Importance & How is it Used

Jan 15,2023

BROWSE BY CATEGORY

  • Academic
  • Academic Research
  • Artificial Intelligence
  • Assessments
  • Audience
  • Brand Awareness
  • Business
  • Case Studies
  • Communities
  • Consumer Insights
  • Customer effort score
  • Customer Engagement
  • Customer Experience
  • Customer Loyalty
  • Customer Research
  • Customer Satisfaction
  • CX
  • Employee Benefits
  • Employee Engagement
  • Employee Engagement
  • Employee Retention
  • Enterprise
  • Events
  • Forms
  • Friday Five
  • General Data Protection Regulation
  • Guest Post
  • Insights Hub
  • Life@QuestionPro
  • LivePolls
  • Market Research
  • Marketing
  • Mobile
  • Mobile App
  • Mobile diaries
  • Mobile Surveys
  • New Features
  • non-profit
  • NPS
  • Online Communities
  • Polls
  • Question Types
  • Questionnaire
  • QuestionPro
  • QuestionPro Products
  • Release Notes
  • Research Tools and Apps
  • Revenue at Risk
  • Startups
  • Survey Templates
  • Surveys
  • Tech News
  • Tips
  • Training
  • Training Tips
  • Trending
  • Tuesday CX Thoughts (TCXT)
  • Uncategorized
  • VOC
  • Webinar
  • Webinars
  • What’s Coming Up
  • Workforce
  • Workforce Intelligence

Footer

MORE LIKE THIS

artificial-data

What is Artificial Data & How It’s Shaping Research

May 20, 2025

wells-fargo-nps-2025

Wells Fargo NPS 2025: What Businesses Can Learn

May 19, 2025

word-cloud

Word Cloud: What it is & How to Use QuestionPro Word Cloud?

May 16, 2025

synthetic data and ai - market research

Redefining Research Strategy with AI and Synthetic Data

May 15, 2025

Other categories

  • Academic
  • Academic Research
  • Artificial Intelligence
  • Assessments
  • Audience
  • Brand Awareness
  • Business
  • Case Studies
  • Communities
  • Consumer Insights
  • Customer effort score
  • Customer Engagement
  • Customer Experience
  • Customer Loyalty
  • Customer Research
  • Customer Satisfaction
  • CX
  • Employee Benefits
  • Employee Engagement
  • Employee Engagement
  • Employee Retention
  • Enterprise
  • Events
  • Forms
  • Friday Five
  • General Data Protection Regulation
  • Guest Post
  • Insights Hub
  • Life@QuestionPro
  • LivePolls
  • Market Research
  • Marketing
  • Mobile
  • Mobile App
  • Mobile diaries
  • Mobile Surveys
  • New Features
  • non-profit
  • NPS
  • Online Communities
  • Polls
  • Question Types
  • Questionnaire
  • QuestionPro
  • QuestionPro Products
  • Release Notes
  • Research Tools and Apps
  • Revenue at Risk
  • Startups
  • Survey Templates
  • Surveys
  • Tech News
  • Tips
  • Training
  • Training Tips
  • Trending
  • Tuesday CX Thoughts (TCXT)
  • Uncategorized
  • VOC
  • Webinar
  • Webinars
  • What’s Coming Up
  • Workforce
  • Workforce Intelligence

questionpro-logo-nw
Help center Live Chat SIGN UP FREE
  • Sample questions
  • Sample reports
  • Survey logic
  • Branding
  • Integrations
  • Professional services
  • Security
  • Survey Software
  • Customer Experience
  • Workforce
  • Communities
  • Audience
  • Polls Explore the QuestionPro Poll Software - The World's leading Online Poll Maker & Creator. Create online polls, distribute them using email and multiple other options and start analyzing poll results.
  • Research Edition
  • LivePolls
  • InsightsHub
  • Blog
  • Articles
  • eBooks
  • Survey Templates
  • Case Studies
  • Training
  • Webinars
  • All Plans
  • Nonprofit
  • Academic
  • Qualtrics Alternative Explore the list of features that QuestionPro has compared to Qualtrics and learn how you can get more, for less.
  • SurveyMonkey Alternative
  • VisionCritical Alternative
  • Medallia Alternative
  • Likert Scale Complete Likert Scale Questions, Examples and Surveys for 5, 7 and 9 point scales. Learn everything about Likert Scale with corresponding example for each question and survey demonstrations.
  • Conjoint Analysis
  • Net Promoter Score (NPS) Learn everything about Net Promoter Score (NPS) and the Net Promoter Question. Get a clear view on the universal Net Promoter Score Formula, how to undertake Net Promoter Score Calculation followed by a simple Net Promoter Score Example.
  • Offline Surveys
  • Customer Satisfaction Surveys
  • Employee Survey Software Employee survey software & tool to create, send and analyze employee surveys. Get real-time analysis for employee satisfaction, engagement, work culture and map your employee experience from onboarding to exit!
  • Market Research Survey Software Real-time, automated and advanced market research survey software & tool to create surveys, collect data and analyze results for actionable market insights.
  • GDPR & EU Compliance
  • Employee Experience
  • Customer Journey
  • Synthetic Data
  • About us
  • Executive Team
  • In the news
  • Testimonials
  • Advisory Board
  • Careers
  • Brand
  • Media Kit
  • Contact Us

QuestionPro in your language

  • English
  • Español (Spanish)
  • Português (Portuguese (Brazil))
  • Nederlands (Dutch)
  • العربية (Arabic)
  • Français (French)
  • Italiano (Italian)
  • 日本語 (Japanese)
  • Türkçe (Turkish)
  • Svenska (Swedish)
  • Hebrew IL (Hebrew)
  • ไทย (Thai)
  • Deutsch (German)
  • Portuguese de Portugal (Portuguese (Portugal))

Awards & certificates

  • survey-leader-asia-leader-2023
  • survey-leader-asiapacific-leader-2023
  • survey-leader-enterprise-leader-2023
  • survey-leader-europe-leader-2023
  • survey-leader-latinamerica-leader-2023
  • survey-leader-leader-2023
  • survey-leader-middleeast-leader-2023
  • survey-leader-mid-market-leader-2023
  • survey-leader-small-business-leader-2023
  • survey-leader-unitedkingdom-leader-2023
  • survey-momentumleader-leader-2023
  • bbb-acredited
The Experience Journal

Find innovative ideas about Experience Management from the experts

  • © 2022 QuestionPro Survey Software | +1 (800) 531 0228
  • Sitemap
  • Privacy Statement
  • Terms of Use