
When researchers study a concept, they need to gather data about it. This data can take many forms and represent different values, such as height, weight, hair color, and opinions. Collecting data is just the beginning of a journey to generate actionable insights. The next step is to classify and understand the data type you’re working with to interpret it better.
When you collect data, it can be classified into two major categories:
- Categorical data
- Numerical data
In this article, we’ve gathered all the necessary information to fully understand categorical data and how it can benefit your research projects. Let’s get started!
What is Categorical Data?
Categorical data refers to a type of information that can be stored and identified based on their names or labels. It is a form of qualitative data that can be grouped into categories rather than being measured numerically. This data type consists of categorical variables that indicate things like a person’s gender, hometown, and so on. Categorical measurements are not provided as numbers but rather as natural language descriptions.
Sometimes, numbers can represent this data, but these numbers don’t hold any mathematical significance. Here are some examples of categorical data:
- Birthdate
- Favorite sport
- Postcode
- Hair Color
- Height
In the examples above, both birthdate and postcode are numbers. However, even though they include numbers, the data is categorical because it cannot be manipulated quantitatively, like figures and amounts.
Pro tip: Calculating the average is a simple way to determine whether the provided data is categorical or numerical. If you can calculate an average, it's numerical data. If you cannot, it's considered categorical data.
Categorical data is commonly used in fields such as marketing research and social sciences to classify and analyze groups based on qualitative attributes.
Before continuing, we invite you to explore the diverse examples of qualitative data in education through our most recent article, where we delve into various examples that reveal a deeper understanding of learning environments and student experiences.
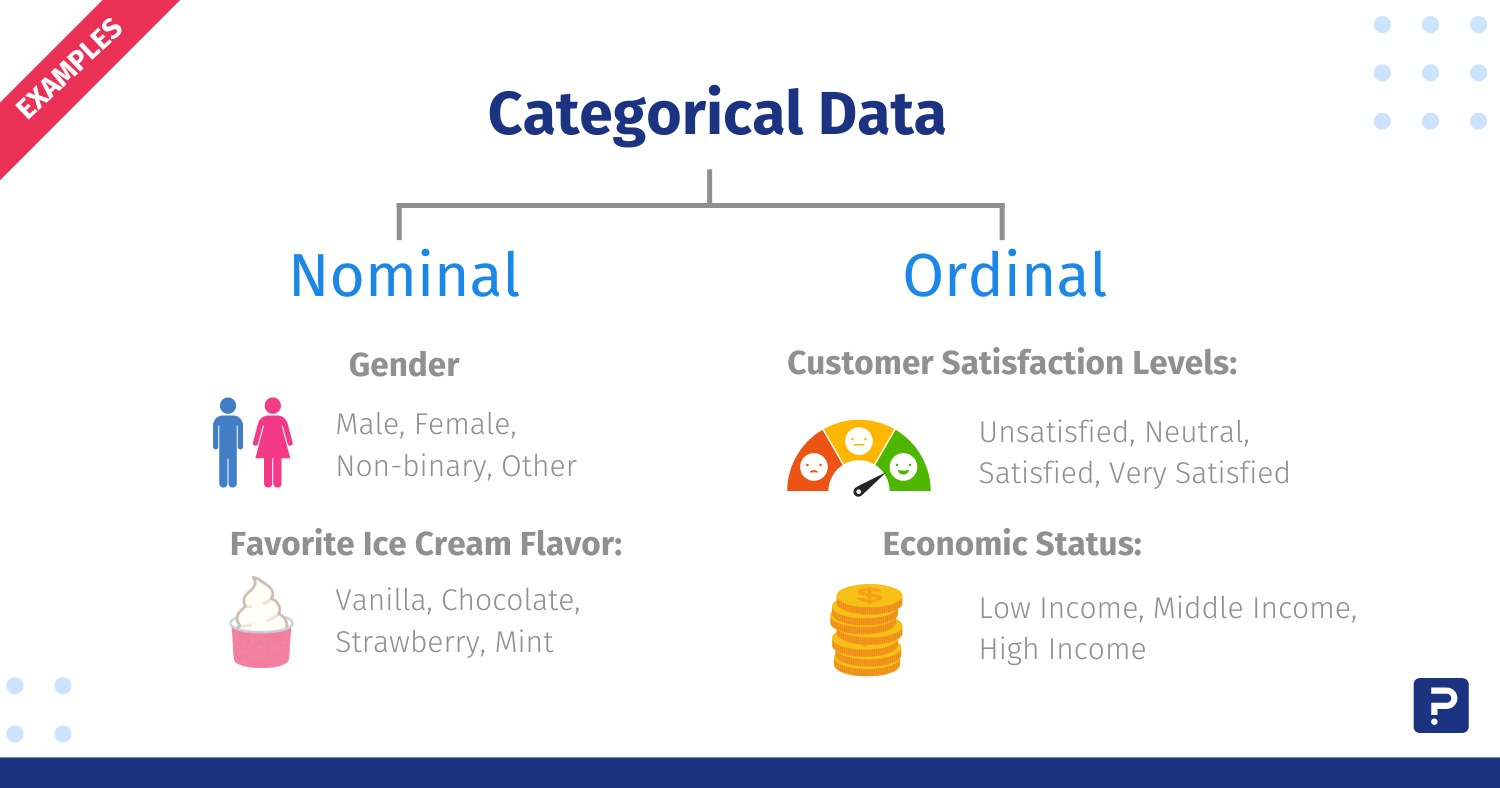
Types of Categorical Data
Categorical data often includes values and observations that can be categorized or grouped. Specifically, there are two types of categorical data:
Let’s explore them in detail.
Nominal Data
Nominal data is a type of data consisting of categories that cannot be ordered or ranked. It’s also called a nominal scale. Nominal data cannot be ranked or measured in any way, but it can sometimes be both qualitative and quantitative. Examples of nominal data include symbols, words, letters, and a person’s gender.
Ordinal Data
Ordinal data is a category of data that has a natural order. It is often used in surveys, questionnaires, and fields such as finance and economics. What sets ordinal data apart is that it is impossible to determine the difference between data values. Clothing sizes are one example (small, medium, and large are not measurable differences, but they are clearly ordered to show size comparisons).
Did you know: Bar graphs and pie charts are usually the best ways to represent this kind of data?
Keep that in mind when creating a report or dashboard with this type of data!
Features of Categorical Data
Categorical data has certain characteristics that allow it to be classified and better understood. Below are some common features with brief explanations to help you manage it more effectively:
- Type/Category: As previously mentioned, the most common way to organize it is by the two main types of categorical data: nominal data and ordinal data. Nominal data, also called named data, is used to name variables, while ordinal data follows a scale or order.
- Qualitativeness: It is qualitative. In other words, it describes an event using words rather than numbers.
- Nature: Depending on its nature, categorical data can be divided into binary and non-binary categories. A binary question has two possible answers, such as yes or no, while a non-binary question offers more than two answers, such as maybe.
- Numeric Values: Although it is qualitative, it often includes numerical values. However, these values don’t carry any quantitative data characteristics, so they cannot be used in arithmetic functions.
- Graphical Analysis: To analyze it visually, a pie chart and bar chart can be used. A bar chart determines how often something happens, while a pie chart displays percentages. Both methods are applied after grouping the data into a table.
We hope this clarifies the main characteristics of categorical data. However, if you want a clearer understanding, we’ve provided some examples to further illustrate the concept.
Examples of Categorical Data
Let’s say you’re throwing a party and want to ensure everyone has coffee. You send out a survey asking people what their favorite type of coffee is and organize the results into a table, as shown below:
| Favorite Coffee | Frequency |
| Latte | 4 |
| Espresso | 15 |
| Cappuccino | 2 |
| Black Coffee | 10 |
Question: Is the data in the table categorical?
Answer: Yes! It is categorical data because it is broken into groups, like favorite coffee.
Another example could be:
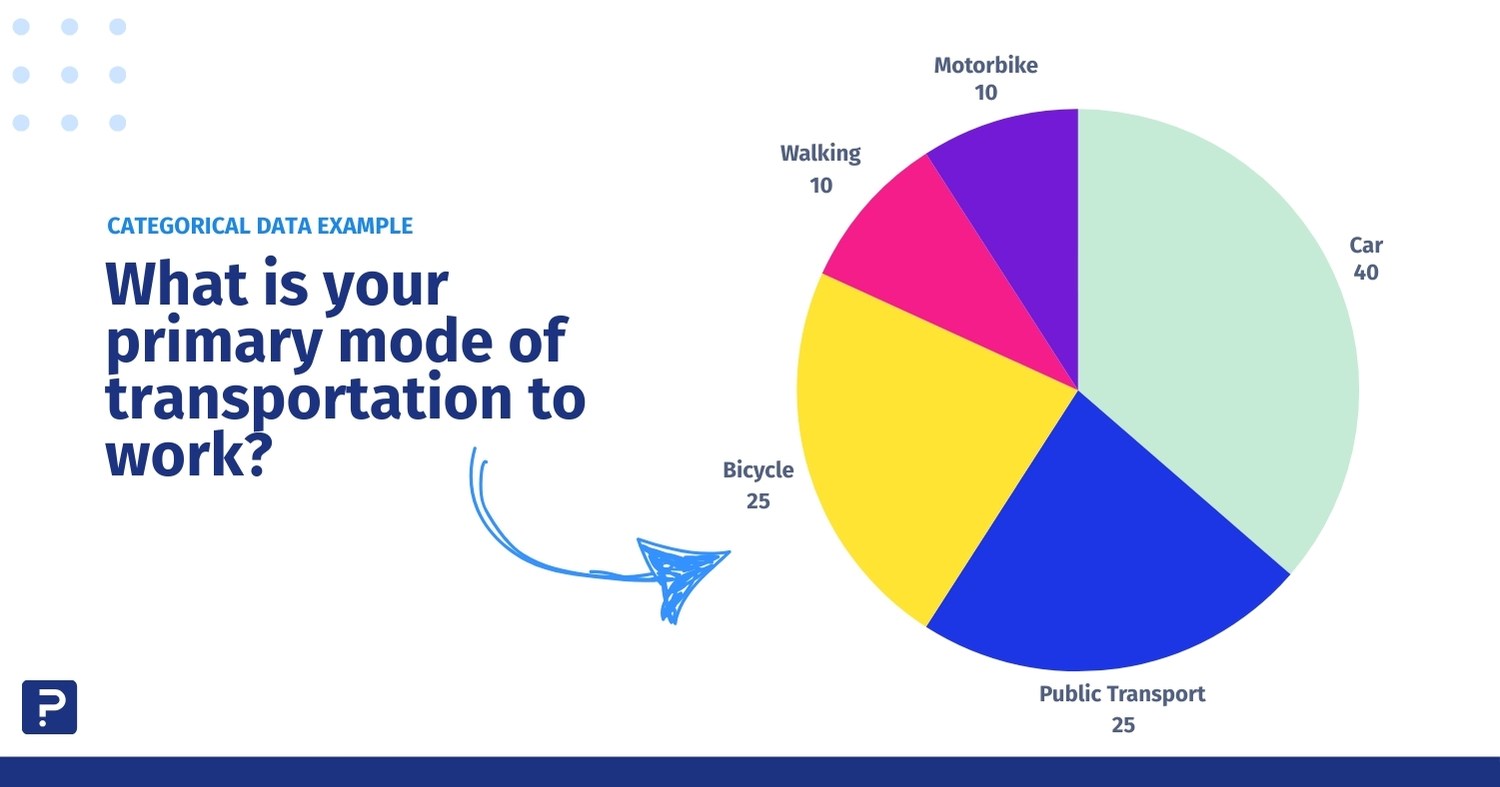
Imagine you’re conducting a survey to understand people’s preferred modes of transportation for commuting to work in a city. The question might be:
“What is your primary mode of transportation to work?”
The possible responses (categorical data) are:
- Car
- Bicycle
- Public Transport
- Walking
- Motorbike
If 100 people respond to your survey, you might categorize the data like this:
| Car | 40 |
| Bicycle | 15 |
| Public Transport | 25 |
| Walking | 10 |
| Motorbike | 10 |
In this case, “mode of transportation” is the categorical variable, and the responses represent different categories.
If we want to put this data in a report, it would look like this:
Categorical Data Analysis
Analyzing this data type involves specific tools and resources that allow researchers to leverage the information collected fully. We can break down the analysis of categorical data into three key points:
- Summarization
- Visualization
- Statistical Tests
Summarize the Data
The most common manipulation of categorical data is grouping. There are two main ways to summarize it:
- Frequency Distribution: Count how often each category appears in the dataset.
- Proportions/Percentages: Convert the counts into percentages for easier comparison.
Visualization
To visually represent categorical data and spot trends, differences, and distributions of categories, the following charts are commonly used:
- Bar Charts: Often used for both nominal and ordinal data, bar charts display the frequency of categories with rectangular bars.
- Pie Charts: Useful for nominal data to show the proportion of categories as slices of a pie (though less favored in complex analyses). You can see a clear example of this type of analysis in the “Examples of categorical data” segment.
- Stacked Bar Charts: Compare the frequency of categories across different groups.
Statistical Tests for Categorical Data
Although categorical data is typically non-numeric, specific statistical tests can analyze this data from a statistical perspective and reveal relationships between categorical variables. The most popular tests for categorical variables are:
- Chi-Square Test of Independence: Chi-Square Test determines if there’s a significant association between two categorical variables.
- Fisher’s Exact Test: Used when the sample size is small. Like the Chi-square test, it checks for association between categorical variables.
- Chi-Square Goodness of Fit: Tests whether the observed distribution of a categorical variable matches an expected distribution.
- Logistic Regression: Analyzes relationships between one or more categorical variables (independent variables) and a binary categorical outcome (dependent variable). It can also be extended to multinomial outcomes (multinomial logistic regression).
Other Methods of Analysis
- Cramér’s V: Used to assess the strength of association between two nominal variables.
- Kendall’s Tau: A measure of association for ordinal variables.
- Mann-Whitney U Test: Can be used to compare two groups when the data is ordinal.
- Kruskal-Wallis Test: For comparing more than two groups with ordinal data.
- Spearman’s Rank Correlation: Used to determine the strength and direction of the association between two ordinal variables.
For more advanced analysis, researchers often examine relationships between categorical variables using log-linear models or decision trees, depending on the complexity of the data.
Conclusion for Categorical Data
Categorical data is often used in non-parametric statistical tests. In statistical analysis, distinguishing between categorical data and numerical data is essential, as categorical data involves distinct categories or labels, while numerical data consists of measurable quantities. Anyone who works with data or conducts research must understand and use it. This blog has explained what categorical data is, described its different types and features, and provided examples.
QuestionPro is survey software that allows you to collect all kinds of data, including categorical data. But it goes further, enabling the collection of both qualitative and quantitative data thanks to its diverse question types.
On top of that, with QuestionPro, not only can you collect data, but you can also conduct in-depth analysis thanks to its data analysis suite, where you can easily manage both qualitative and quantitative data through customizable dashboards.
If you’re specifically interested in working with categorical data, our software allows you to create surveys and collect data from respondents. This data can then be analyzed and grouped into different categories.
QuestionPro also offers tools and features for analyzing and displaying categorical data, such as cross-tabulation, frequency tables, and bar charts. These tools help users understand and interpret their data, enabling them to make informed decisions based on their survey results.Now it’s your turn. Contact QuestionPro to learn more about our survey software and products, or request a free demo!