For a market researcher, collecting qualitative data helps answer questions like who their customers are, what issues or problems they are facing, and where they need to focus their attention so that problems or issues are resolved. Let’s talk about it.
What is qualitative data?
Qualitative data is defined as data that approximates and characterizes. Qualitative data can be observed and recorded.
This data type is non-numerical. This type of data is collected through methods of observations, one-to-one interviews, conducting focus groups, and similar methods. Qualitative data in statistics is also known as categorical data – data that can be arranged categorically based on the attributes and properties of a thing or a phenomenon.
Importance of qualitative data
Qualitative data is important in determining the particular frequency of traits or characteristics. It allows the statistician or the researchers to form parameters through which larger data sets can be observed.
It provides how observers can quantify the world around them. Qualitative data is about the emotions or perceptions of people and what they feel. Qualitative analysis is key to getting useful qualitative insights from textual data, figuring out its rich context, and finding subtle patterns and themes.
In qualitative data, these perceptions and emotions are documented. It helps market researchers understand their consumers’ language and solve the research problem effectively and efficiently.
Advantages of qualitative data
Some advantages of qualitative data are given below:
It helps in-depth analysis
The data collected provide the qualitative researchers with a detailed analysis, like a thematic analysis of subject matters. While collecting it, the researchers tend to probe the participants and can gather ample information by asking the right kind of questions. The data collected is used to conclude a series of questions and answers.
Understand what customers think
The data helps market researchers understand their customers’ mindsets. Using qualitative data gives businesses an insight into why a customer purchased a product. Understanding customer language helps market research infer the data collected more systematically.
Rich data
Collected data can also be used to conduct future research. Since the questions asked to collect qualitative data are open-ended questions, respondents are free to express their opinions, leading to more information.
Disadvantages of qualitative data
Some disadvantages of qualitative data are given below:
Time-consuming
As collecting this data is more time-consuming, fewer people study than collecting quantitative data. Unless time and budget allow, a smaller sample size is included.
Not easy to generalize
Since fewer people are studied, it is difficult to generalize the results of that population.
Dependent on the researcher’s skills
This type of data is collected through one-to-one interviews, observations, focus groups, etc. It relies on the researcher’s skills and experience to collect information from the sample.
It is typically descriptive analysis data and is more difficult to analyze than quantitative data. Now, you have to decide which is the best option for your research project; remember that to obtain and analyze this data, we need a little more time, so you should consider it in your planning.
Qualitative data collection methods
Qualitative data collection is exploratory; it involves in-depth analysis and research. Its collection methods mainly focus on gaining insights, reasoning, and motivations; hence, they go deeper into research. Since this data cannot be measured, researchers prefer methods or data collection tools that are structured to a limited extent.
Here are the qualitative data collection methods:
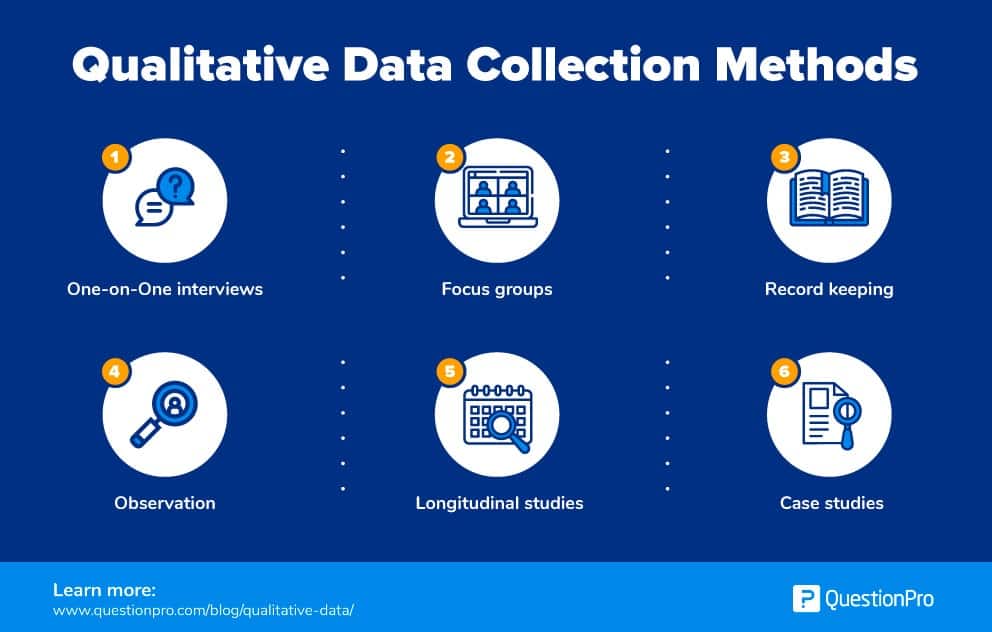
One-to-one interviews
It is one of the most commonly used data collection instruments for qualitative research questions, mainly because of its approach. The interviewer or the researcher collects data directly from the interviewee one-to-one. The interview method may be informal and unstructured – conversational. The open-ended questions are mostly asked spontaneously, with the interviewer letting the interview flow dictate the questions to be asked.
Focus groups
This is done in a group discussion setting. The group is limited to 6-10 people, and a moderator is assigned to moderate the ongoing discussion.
Depending on the data which is sorted, the group members may have something in common. For example, a researcher conducting a study on track runners will choose athletes who are track runners or were track runners and have sufficient knowledge of the subject matter.
Record keeping
This method uses existing reliable documents and similar sources of information as the data source. This data can be used in the new research. It is similar to going to a library. There, one can go over books and other reference material to collect relevant data that can be used in the research.
Process of observation
In this data collection method, the researcher immerses himself/ herself in the setting where his respondents are, keeps a keen eye on the participants, and takes notes. This is known as the process of observation.
Besides taking notes, other documentation methods, such as video and audio recording, photography, and similar methods, can be used.
Longitudinal studies
This data collection method is repeatedly performed on the same data source over an extended period. It is an observational research method that goes on for a few years and sometimes can go on for even decades. Such data collection methods aim to find correlations through empirical studies of subjects with common traits.
Case studies
This method gathers data from an in-depth analysis of case studies. The versatility of this method is demonstrated in how this method can be used to analyze both simple and complex subjects. The strength of this method is how judiciously it uses a combination of one or more qualitative methods to draw inferences.
Qualitative data analysis approaches
Analyzing qualitative data is vital, as you have spent time and money collecting it. It is essential because you don’t want to find yourself in the dark even after putting in so much effort. However, there are no set ground rules for analyzing data; it all begins with understanding its two main approaches.
Qualitative data analysis allows researchers to dig deep into research findings and reveal the complex meanings of qualitative data. Two main approaches to qualitative analysis:
Deductive approach
The deductive approach involves analyzing qualitative data based on a structure that the researcher predetermines. A researcher can use the questions as a guide for analyzing the data. This approach is quick and easy and can be used when a researcher has a fair idea about the likely responses that he/she is going to receive from the sample population.
Inductive approach
On the contrary, the inductive approach is not based on a predetermined structure or set ground rules/framework. It is a more time-consuming and thorough approach to the qualitative analysis process. An inductive approach is often used when a researcher has very little or no idea of the research phenomenon.
5 Steps to qualitative data analysis
Whether you want to analyze qualitative data collected through a one-to-one interview or a survey, these simple steps will ensure a robust data analysis.
Step 1: Arrange your data
Once you have collected all the data, it is largely unstructured and sometimes makes no sense when viewed at a glance. Therefore, it is essential that as a researcher, you first need to transcribe the data collected.
The first step in analyzing your data is arranging it systematically. Arranging data means converting all the data into a text format. You can either export the data into a spreadsheet or manually type in the data, or choose from any of the computer-assisted qualitative data analysis tools.
Step 2: Organize all your data
After transforming and arranging your data, the immediate next step is to organize your data. You may have a large amount of information that still needs to be arranged in an orderly manner. One of the best ways to organize the data is by going back to your research objectives and then organizing the data based on the questions asked.
Arrange your research objective in a table so it appears visually clear. At all costs, avoid the temptations of working with unorganized data. You will waste time, and no conclusive results will be obtained.
Step 3: Set a code to the data collected
Setting up proper codes for the collected data takes you a step ahead. The coding process is one of the best ways to compress a tremendous amount of information collected. Data coding means categorizing and assigning properties and patterns to the collected data.
Coding is important in this data analysis, as you can derive theories from relevant research findings. After assigning codes to your data, you can build on the patterns to gain in-depth insight into the data that will help make informed decisions.
Step 4: Validate your qualitative data
Validating data is one of the crucial steps of qualitative data analysis for successful research. Since data is quintessential for research, ensuring that the data is not flawed is imperative. Please note that data validation is not just one step in this analysis; this is a recurring step that needs to be followed throughout the research process. There are two sides to validating data:
- Accuracy of your research design or methods.
- Reliability is the extent to which the methods consistently produce accurate data.
Step 5: Concluding the analysis process
It is important to finally conclude your data, which means systematically presenting your data, a report that can be readily used. The report should state the method you used as a researcher to conduct the research studies, the positives and negatives, and the study limitations. In the report, you should also state the suggestions/inferences of your findings and any related areas for future research. Practical market intelligence relies on the synergy between analytics and reporting, where analytics uncovers valuable insights, and reporting communicates these findings to stakeholders.
Choosing the right software can be tough. Whether you’re a researcher, business leader, or marketer, check out the top 10 qualitative data analysis software for analyzing qualitative data.
Qualitative data examples
Qualitative data is also called categorical data since this data can be grouped according to categories.
For example, think of a student reading a paragraph from a book during class sessions. A teacher listening to the reading gives feedback on how the child reads that paragraph.
Suppose the teacher gives feedback based on fluency, intonation, word throwing, and pronunciation clarity without giving the child a grade. In that case, this is considered an example of qualitative data.
It’s pretty easy to understand the difference between qualitative and quantitative data. It does not include numbers in its traits definition, whereas quantitative data is all about numbers.
- The cake is orange, blue, and black in color (qualitative).
- Females have brown, black, blonde, and red hair (qualitative).
Quantitative data is any quantifiable information that can be used for mathematical calculation or statistical analysis. This form of data helps in making real-life decisions based on mathematical derivations. Quantitative data is used to answer questions like How many? How often? How much? This data can be validated and verified. In statistical analysis, distinguishing between categorical data and numerical data is essential, as categorical data involves distinct categories or labels, while numerical data consists of measurable quantities.
To better understand the concept of qualitative and quantitative data, it’s best to observe examples of particular datasets and how they can be defined. The following are examples of quantitative data.
- There are four cakes and three muffins kept in the basket (quantitative).
- One glass of fizzy drink has 97.5 calories (quantitative).
Do you want to create your own survey?
QuestionPro is an online survey software that will help you develop your research projects with advanced tools and reports. It is perfect for obtaining qualitative data thanks to its different types of questions and logic.
Solve your research challenges with easy-to-create surveys that provide complex, real-time insights. Leverage custom point-and-click logic, advanced question types, and integrations and create mature, complex research models for choice-based, consumer, and more.
Pass on the heavy lifting to QuestionPro and focus on what’s important. Our experienced teams deliver intuitive analysis to improve critical takeaways and help turn insight into action. From research design to complex scripting, from analytics management to reporting, work with a team of professionals that will be an extension of your brand.
Frequently Asking Questions (FAQ)
The ability to identify issues and opportunities from respondents is one of the main characteristics of an effective qualitative research question. of an open-ended nature. Simple to comprehend and absorb, with little need for more explanation.
Validity is the quality of research that relates to how effectively the conclusions acquired from examining the study participants’ data reflect genuine findings among similar individuals outside the study’s population.