Each business relies on two fundamentals – the nature of their business, the value-added or the problem solved, and the ability for customers to pay. Pricing data and pricing analytics play a crucial role in businesses’ topline and bottom line. However, it is looked at without actual data, and prices are decided on perceived value rather than actuality.
Getting a handle on structured and unstructured data and converting that into insights in the research process can allow brands to reduce acquisition costs, cultivate referenceable customers, and co-create with promoters. Pricing analytics helps with this revenue and value maximization. Guessing about customers’ needs and their paying capability results in brands and organizations losing out on customers, cannot create sticky customers, and constantly dealing with heightened churn.
Let’s dive deeply into pricing analytics and why researchers, brands, organizations, and stakeholders must pay more attention to it.
What is pricing analytics?
Pricing analytics is defined as the tools and metrics used to gauge how pricing metrics affect business, determine revenue and profitability at specific price points, and optimize a business’s pricing strategy for optimal revenue management.
Predicting consumer behavior and trends is an integral part of pricing analytics. Understanding the following forms a significant portion of the analytics in pricing research:
- Purchase behavior.
- Reducing customer churn.
- Cultivating brand promoters.
This analytical research method in market research also helps optimize supply chain management, make pricing changes basis on demographic and geographical segmentation, and determine price elasticity. All the above ultimately impacts profitability and market share!
There have been instances where even a 1% increase in price increases the profitability of an organization by over 10%, and hence, pricing analytics is a critical component of market research.
Why is Pricing Analytics Important And What are Its Benefits?
Pricing analytics is a vital aspect of an organization’s business strategy and has multiple benefits. Data, along with reasoning, helps understand future performance and aids in learning from past data to draw parallels, prove or disprove theories, and manage product and feature pricing. Let’s look at the following top six reasons to understand the importance of pricing analytics and its benefits.
1. Decide on the pricing strategy to be used
Without research data, pricing strategies could be highly skewed and biased basis a few people defining the pricing model. Using data, you can determine the pricing strategy that works for a business to create the most sticky customers and increase profitability. Some of the most commonly used pricing models are:
- Cream pricing: First movers in the market use this pricing model to drive profitability with premium pricing.
- Penetration pricing: Pricing into an existing market to break a monopoly or duopoly by sacrificing profitability and pricing low.
- Low pricing: Everyday low pricing operates on scale and volume rather than per-unit pricing. This helps with everything from sourcing at scale to undercutting the competition, even on non-event-based pricing days.
- Cost-plus pricing: This pricing model adds a percentage profit as a line item to the cost. This model causes prices to fluctuate based on input costs.
- Demand-based pricing: Lastly, this pricing analytics model looks at market sentiments and other external demand-based factors to determine the price.
2. Identify pricing opportunities
Another critical benefit of pricing analytics is that it allows brands and organizations to identify models of trickle-down economics or even plug holes where there is high cost but low profitability. It also helps to identify wins in the short term with the ability to make rapid product or service tweaks and aids in profitability, thereby reducing customer churn.
3. Planning pricing strategies and spending
Pricing analytics looks at past data to identify consumer spending trends and pricing elasticity. All of these factors combine to aid in defining the best possible pricing strategy, including:
- Identifying consumer spending trends.
- Analyzing pricing elasticity.
- Defining the optimal pricing strategy.
- Determining the appropriate marketing spend to drive profitability.
4. Improve operational efficiency
Understanding financials enables greater operational efficiency in the supply chain, facilitating more accurate forecasting of demand and supply. The optimum usage of resources helps keep the operating expenses (OPEX) in check.
5. Increase customer loyalty and reduce customer churn
With a handle on price sensitivity and other essential pricing components accounted for, customers are less likely to purchase from competing brands. It also increases customer loyalty and reference ability and turns passive customers into loyal customers.
6. Identify pricing tiers and channels that are most profitable
Another vital component of pricing analytics is that it helps identify pricing tiers and pricing strategies for various
- Market segments.
- Demographics.
- And more.
It also identifies the more effective channels for your business models and helps to fortify your distribution channels.
The above benefits of pricing analytics aid in increasing profitability and positively impacting the bottom line.
Pricing Analytics Types with Examples
There are multiple types of pricing analytics and models that brands and researchers can look at. But some of the most commonly used pricing analytics types are listed below with examples.
1. Pricing sensitivity or willingness to pay (WTP)
One of the most common pricing analytics types is the price sensitivity meter or the willingness to pay (WTP) quotient of customers. In this type, you can very quickly gauge what a customer is willing to pay and the features they are willing to pay for, tradeoffs on features, etc.
Without this pricing analytics type, it is nearly impossible to understand your product’s or service’s perceived value, competitive benchmarking, and more. Data analytics and data analysis are closely related processes that involve extracting insights from data to make informed decisions.
For Example, a retail customer looking to enter a new geographic segmentation for a clothing range runs survey research to understand how much customers would pay for a certain clothing line, the value that they perceive, and how competitors currently price clothing in a similar bracket.
2. Feature value analysis
Feature value analysis or tradeoff analysis is another critical component of pricing analytics. Research shows what features customers are willing to pay for and the price they are willing to pay. This model also monitors the weightage importance of features to customers based on what is a must-have, sound, and features they could do without.
An example of feature value analysis is when an appliance manufacturer is launching a new product; there is always a feature value analysis to look at what features manage most to customers, what features set them apart from competitors, and still fit within the brand ethos, and what features are gimmicks.
3. Average revenue per user (ARPU)
The average revenue per user (ARPU) is the net value of the revenue for a pre-defined period divided by the number of users. This metric is essential to understand if there is an uptick in each user’s revenue. ARPU allows organizations to calculate if their pricing model suits their market, competitive benchmarking, value analysis, and more.
Suppose a phone manufacturer that launches multiple phone variants a year across different features and price points. The higher the ARPU, the higher the profitability of the brand.
4. Customer lifetime value (CLV) and customer acquisition cost (CAC)
Customer lifetime value (CLV) and customer acquisition cost (CAC) are important metrics in pricing analytics research. When CLV outweighs CAC, that is a win for your brand.
You want to spend the least amount of money to bring in a customer, and then what’s required to keep them as customers for your brand for the long term, so they continue to spend with your brand.
An example of this pricing analytics to be measured is a brand spending “x” on acquiring a new customer. Still, the customer’s lifetime value is “10x,” making it a profitable and successful business proposition for the brand.
Tools to Conduct Pricing Analytics
We have looked at the benefits of pricing analytics and the different types, with examples and their nuances. Let’s now dive deeper into how to conduct pricing analytics. While data is at the heart of any pricing strategy, how you collect and analyze that data is imperative.
Research data can be in the form of qualitative research or quantitative research. Using the right mix of both offers the maximum value for pricing analytics.

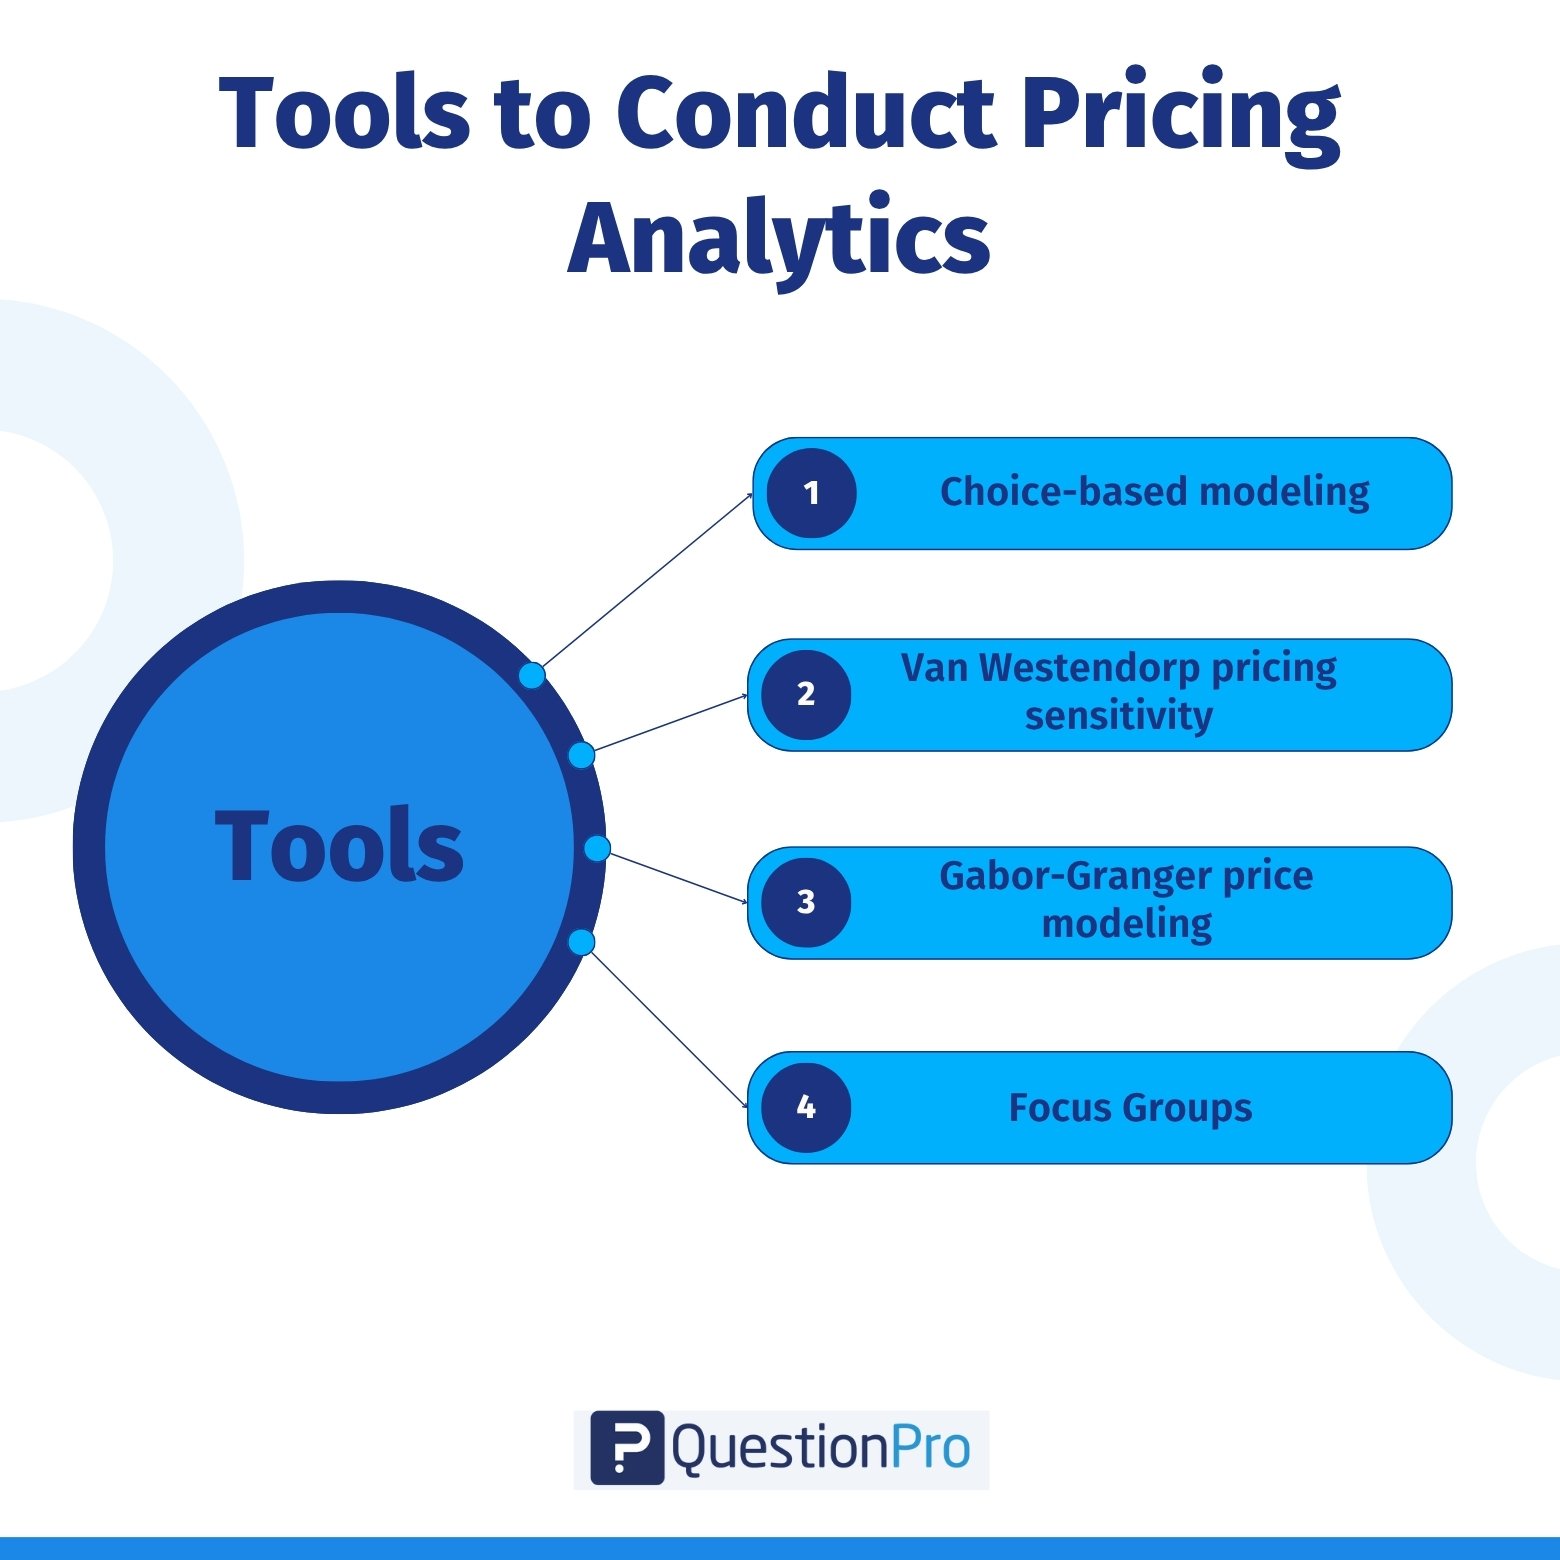
Some of the most commonly used tools to conduct pricing analytics are:
01. Choice-based modeling
The choice-based modeling technique calculates willingness to pay for specific products or services, tradeoffs on features, and more using the conjoint analysis and maxdiff analysis modeling techniques.
These quantitative research methods are the most widely used by researchers to understand customers’ choices and the price that customers are willing to pay.
02. Van Westendorp pricing sensitivity
The Van Westendorp pricing sensitivity allows researchers to understand the value of fundamental psychological price points and how much consumers are willing to pay or spend on a product or service. This method will enable researchers to look at a range of prices that users are willing to pay and the dropoff in consumers based on perceived value or lack of it.
03. Gabor-Granger price modeling
Gabor-Granger is a pricing research technique for determining a revenue and demand curve for a specific product or service. This survey research model helps determine a product’s or service’s price elasticity.
04. Focus Groups
Focus groups are a qualitative research method to gather in-depth information about a product or service. Using this model for pricing analytics allows brands to leverage the continuous discovery model and keep evolving or tweaking prices based on various macro and micro factors in the market and demographic segmentation.
You can co-create with your target audience and customers in focus groups.
A mix or combination of the above research techniques can be used to conduct pricing analytics appropriately. Using a mature enterprise-grade market research platform like QuestionPro, you can conduct your research to stay above the competition and be profitable.
Best Practices for Conducting Pricing Analytics
To optimize pricing strategies and stay competitive in today’s market, businesses should follow best practices that combine various data sources and methods. Here are key steps to help you make the most of your pricing analytics:
- Use historical sales data: Use history to find demand patterns and guide your pricing and forecast future trends.
- Monitor competitor pricing: Monitor competitor prices to see how you stack up in the market and adjust to stay competitive.
- Gather customer data: Collect and analyze customer data to understand buying behavior and preferences and determine the right price points.
- Price optimization: Use price optimization to adjust prices based on demand, market conditions, and competitor behavior, and maximize margins.
- Use dynamic pricing: Use dynamic pricing to adjust prices in real-time based on shifts in demand, competition, and market conditions.
- Work with pricing teams: Work with your pricing teams to align pricing with business objectives and ensure strategies are applied across all channels.
By following these best practices, you can refine your pricing and make smarter decisions that will increase profitability and customer happiness.
Conclusion
Know your customer segments and adjust your approach to meet their needs. Optimise your pricing with data and you’ll stay ahead of the competition and be profitable.
Using pricing tools, you can get to know customer behaviour, price sensitivity, and market demand, and adjust your pricing models accordingly.
Using pricing effectively will help you find the optimal price that will bring you more revenue, customer loyalty, and long-term growth. As the market evolves, pricing will be a key asset for businesses that want to stay profitable and competitive.
Frequently Asked Questions(FAQs)
Answer: By understanding customer behavior and price sensitivity, businesses can adjust pricing strategies to align with customer expectations, making them less likely to switch to competing brands.
Answer: Common pricing strategies include cream pricing, penetration pricing, low pricing, cost-plus pricing, and demand-based pricing. Each strategy is chosen based on market conditions and business goals.
Answer: Customer segmentation allows businesses to tailor pricing strategies based on different customer behaviors, demographics, and purchasing power, ensuring that the pricing model suits each segment’s needs.
Answer: CLV helps businesses understand the long-term profitability of a customer, guiding pricing strategies to ensure that customer acquisition costs (CAC) are outweighed by the revenue generated over time.
Answer: Pricing analytics helps businesses optimize resource usage, forecast demand, and control operating expenses (OPEX) by making pricing decisions based on financial data and market trends.


