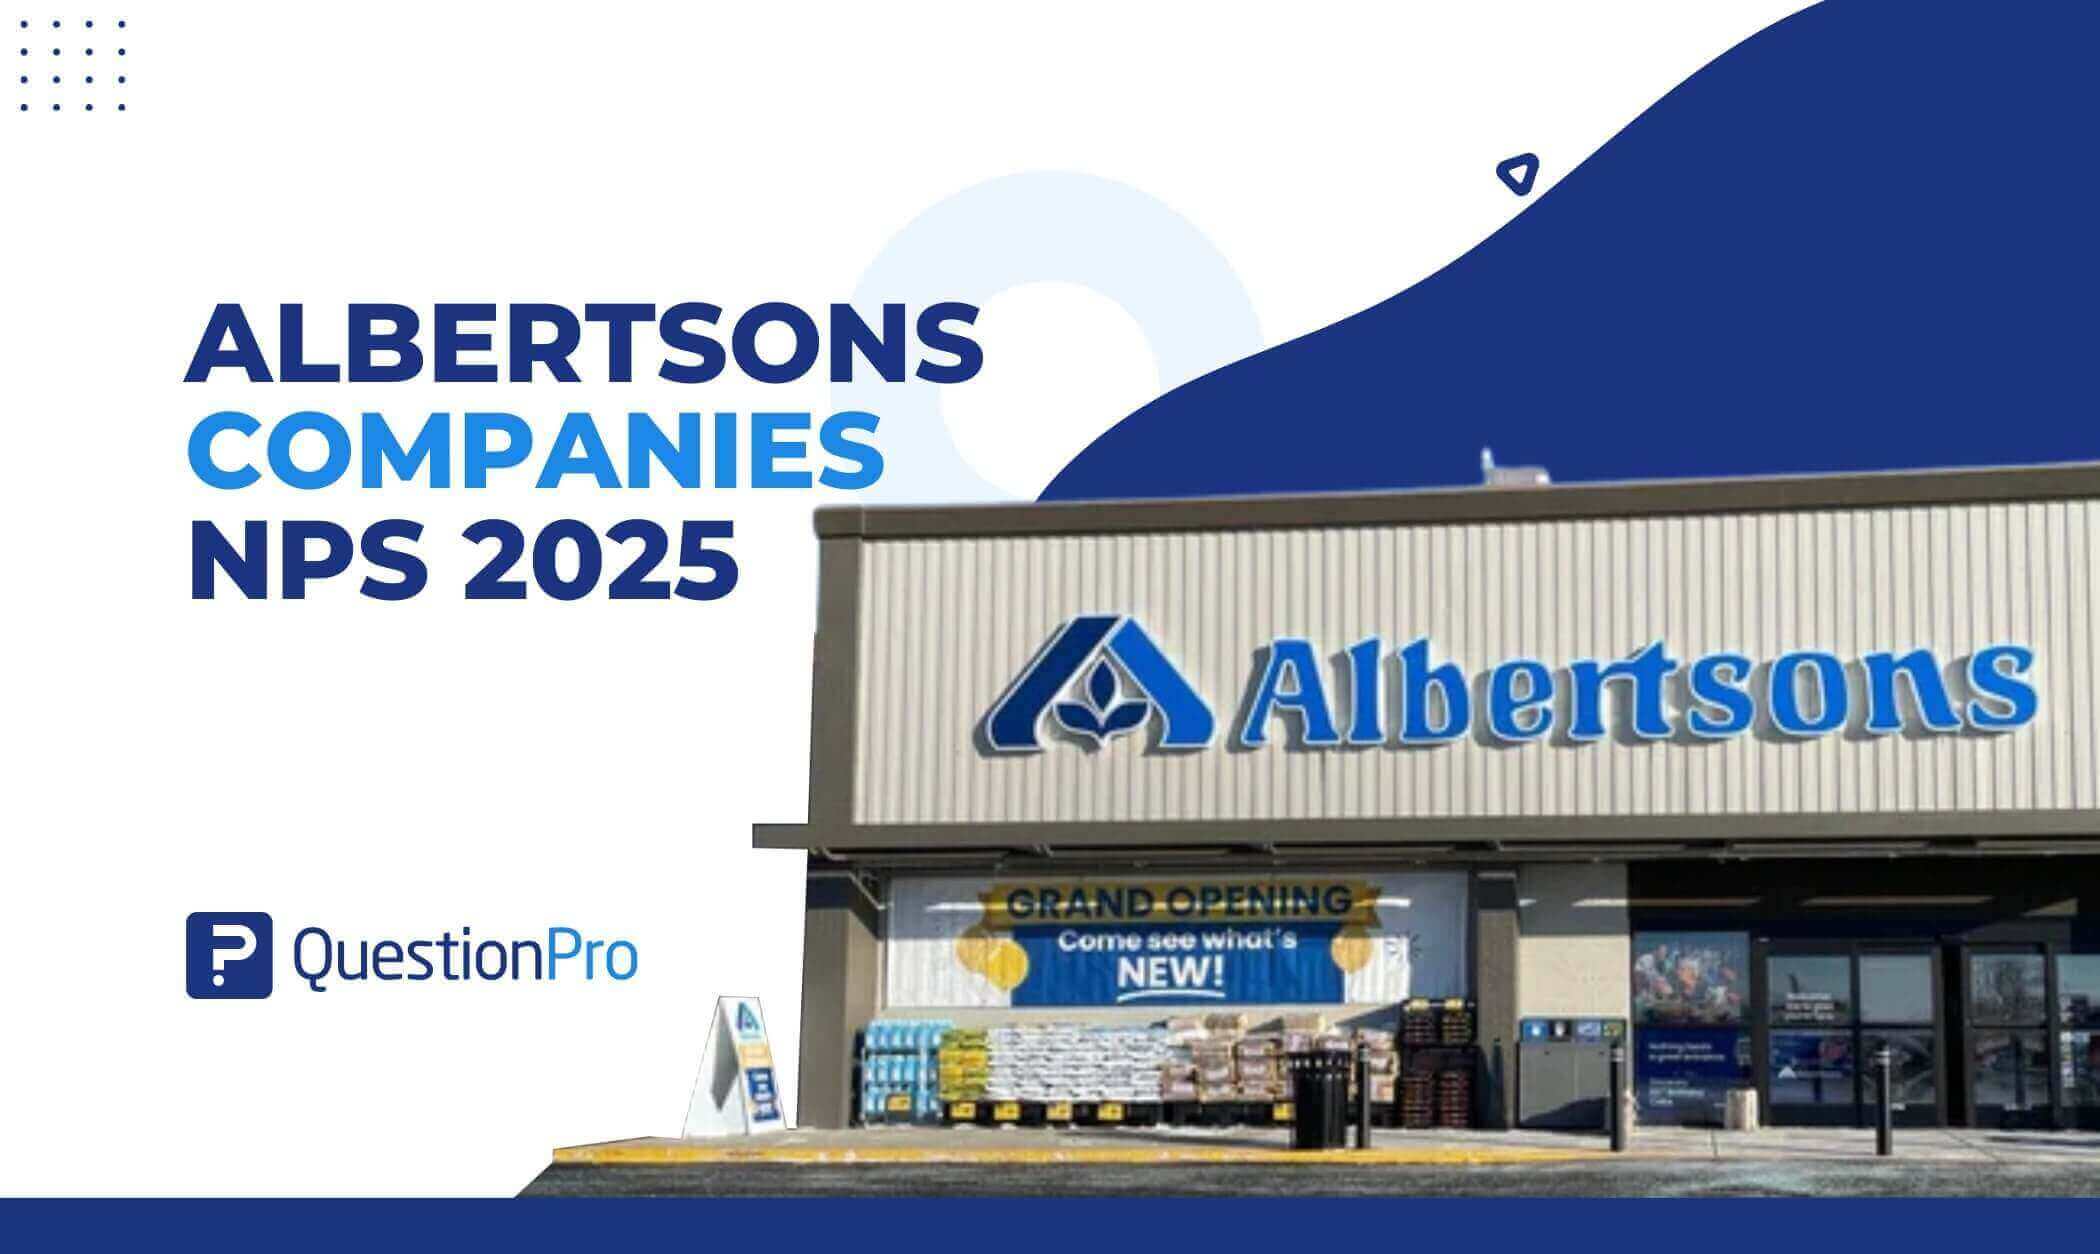
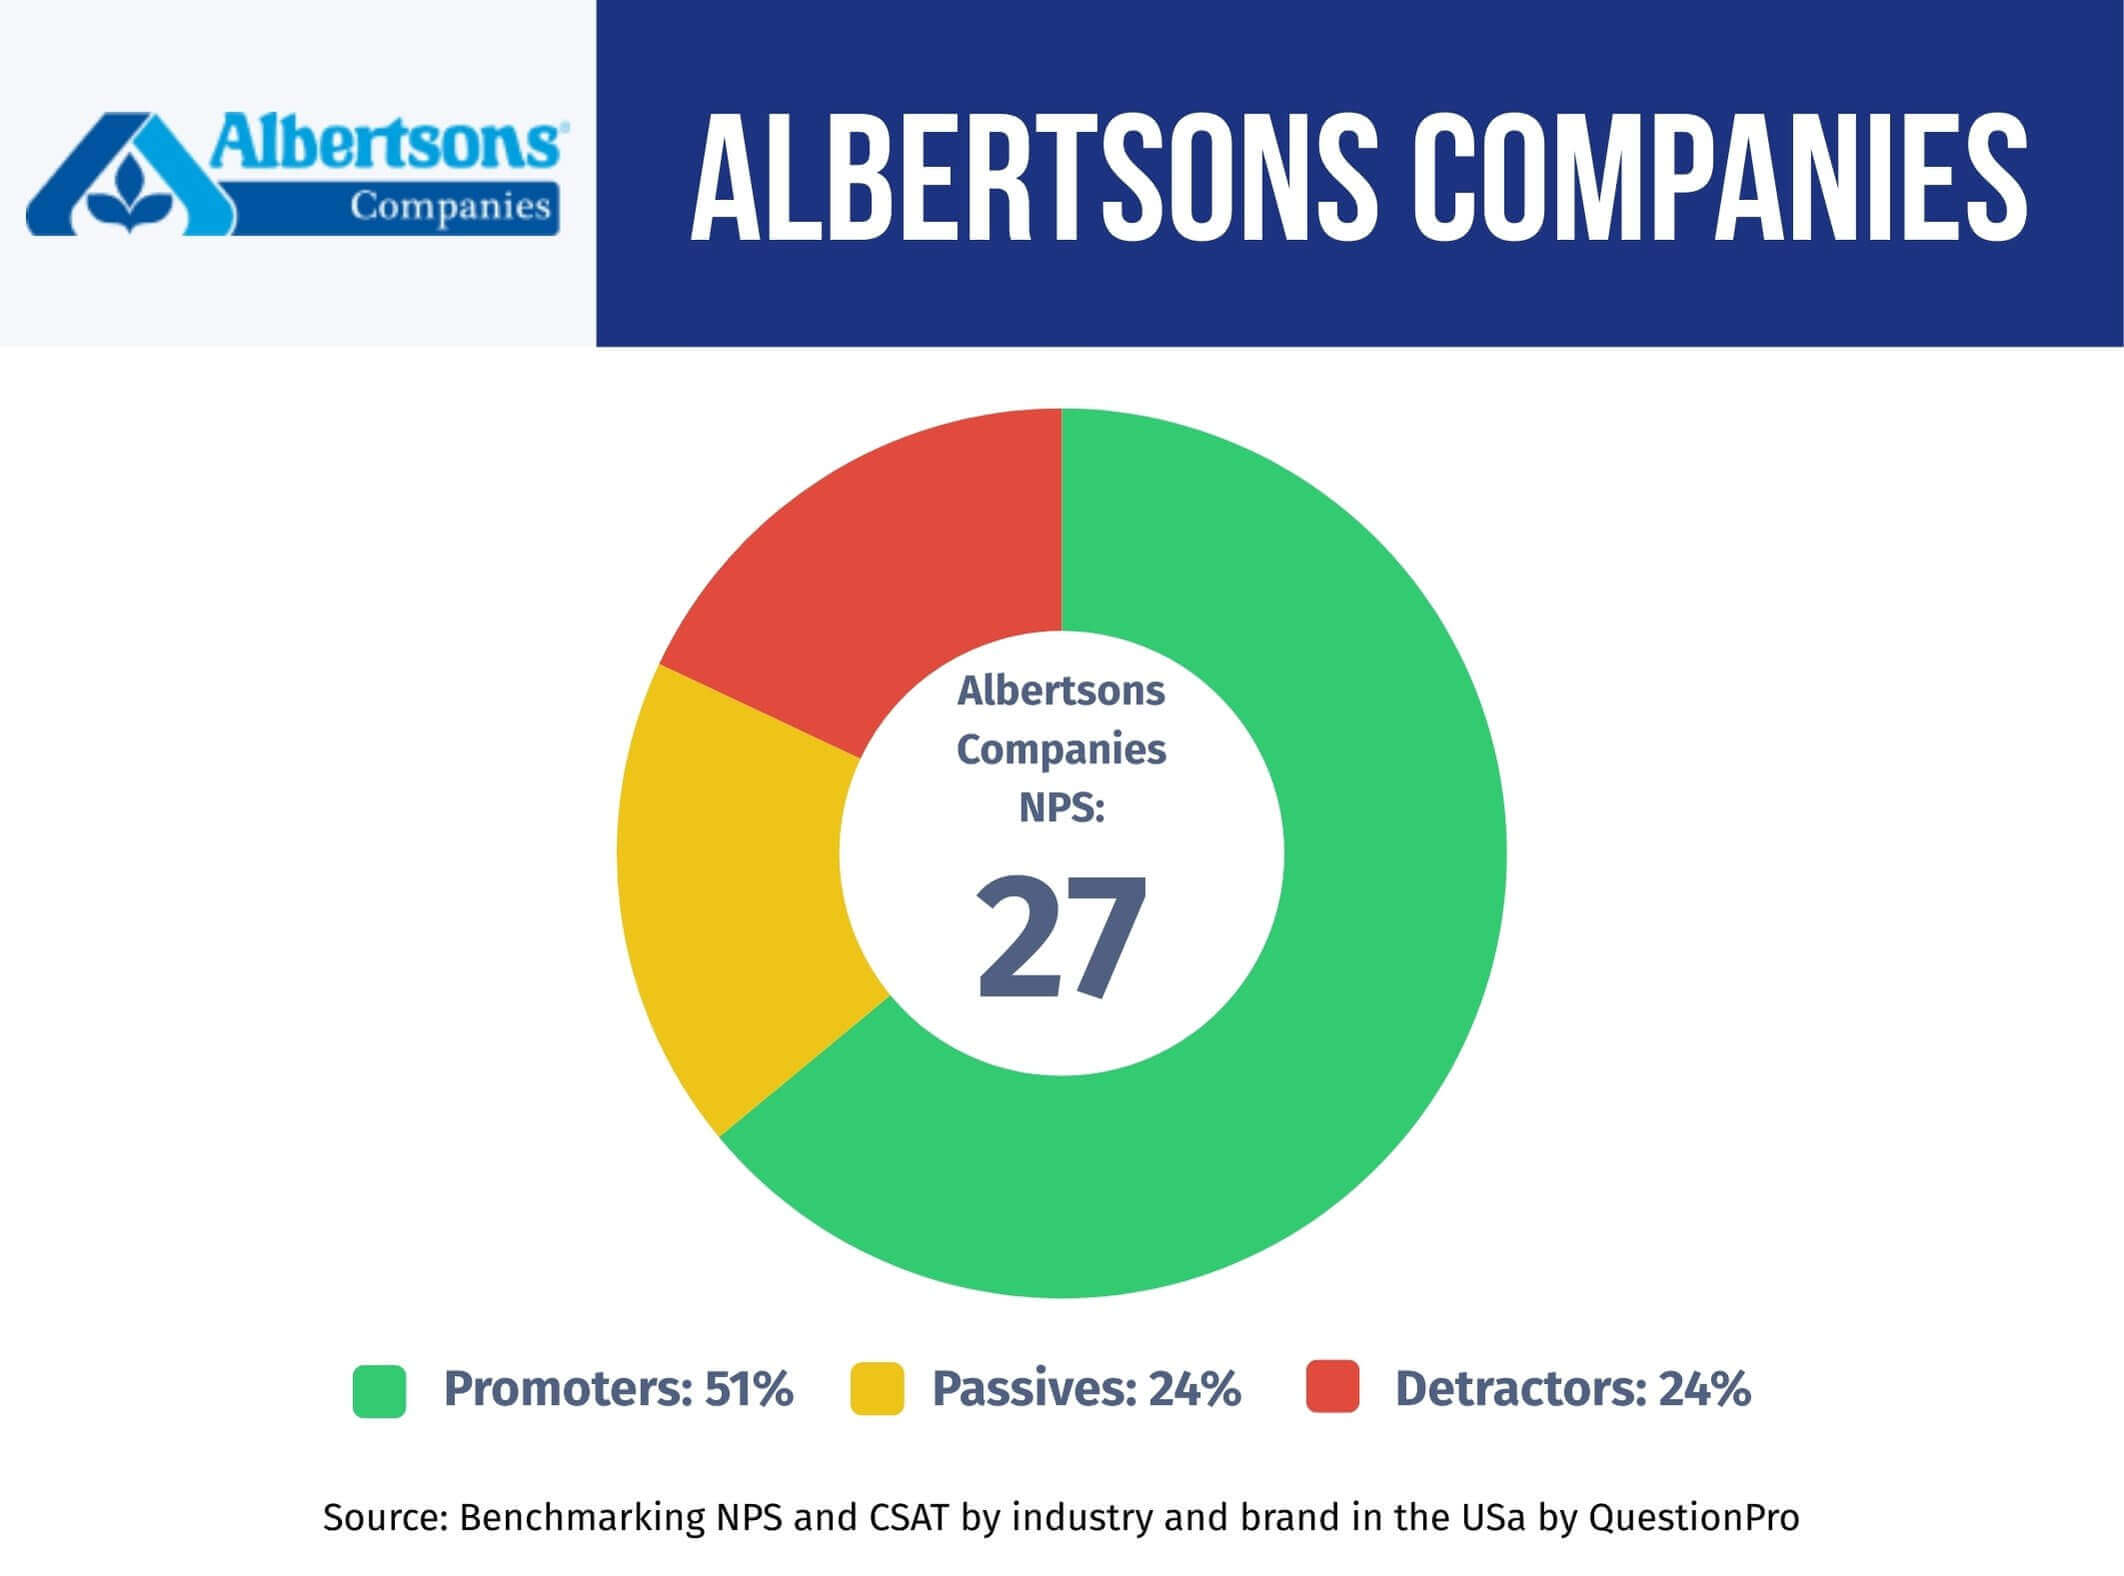
Albertsons Companies NPS sits at 27, well below the grocery industry average of 37, according to QuestionPro’s latest CX benchmarking data. Net Promoter Score (NPS) measures how likely customers are to recommend a brand, using a single question on a 0 to 10 scale. For a grocery chain built on repeat trips, that ten-point gap says a lot about where the shopping experience is falling short.
Albertsons operates under several banners, including Safeway, Vons, and Jewel-Osco, so its score reflects millions of weekly shopping visits nationwide. That scale makes the number both harder to move and more telling when it does shift.
In this article, we’ll break down Albertsons’ current NPS, compare it against grocery competitors, and cover the steps any retailer can take to close its own loyalty gap.
What is Net Promoter Score?
Net Promoter Score (NPS) is a customer loyalty metric that predicts whether someone will recommend a company, based on a single question.
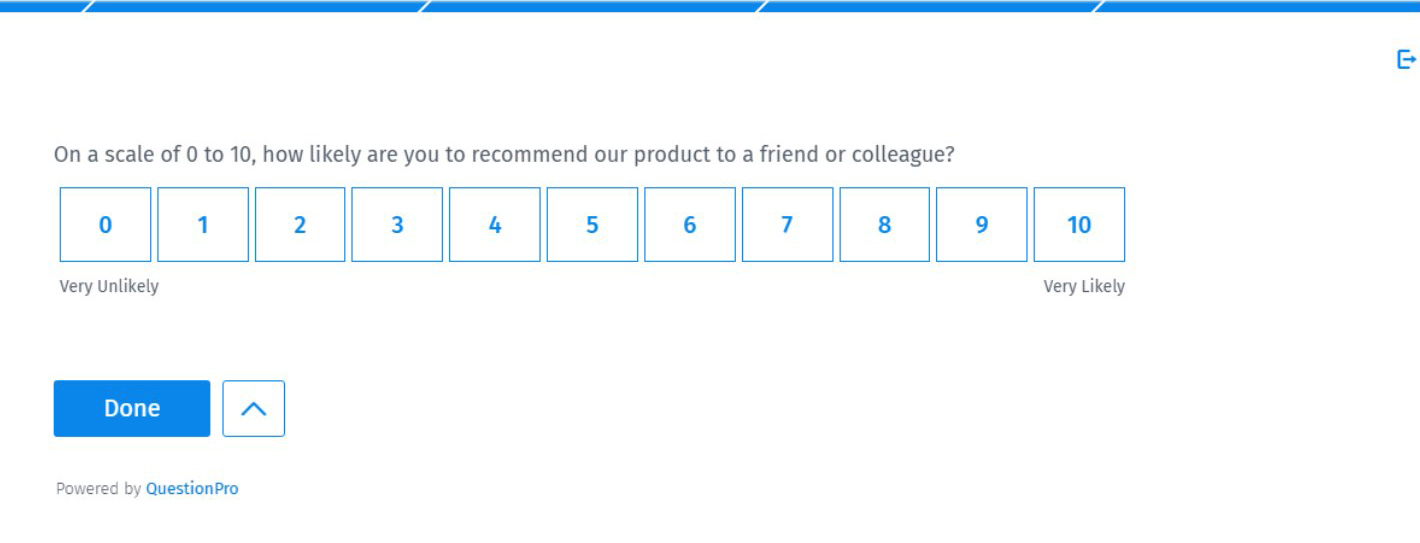
Net Promoter Score asks customers: “On a scale of 0 to 10, how likely are you to recommend us to a friend or colleague?” Fred Reichheld introduced the metric in 2003, and retailers, banks, and hotels now use it to track loyalty over time.
Responses sort customers into three groups:
- Promoters (9-10): Loyal customers who actively recommend the brand.
- Passives (7-8): Satisfied but unenthusiastic, and open to switching.
- Detractors (0-6): Unhappy customers who can damage word of mouth.
The formula is simple. NPS equals the percentage of Promoters minus the percentage of Detractors, producing a score between negative 100 and positive 100.
NPS vs. CSAT vs. CES: what’s the difference?
NPS measures long-term loyalty, not satisfaction with one visit. Customer Satisfaction Score (CSAT) captures how someone felt about a single interaction, like a checkout or a return. Customer Effort Score (CES) measures how much friction a customer faced completing a task, such as finding a product or reaching a cashier.
QuestionPro’s own benchmarking research added CES alongside NPS and CSAT starting in Q1 2025, since retailers wanted a clearer read on friction, not just sentiment.
What is Albertsons Companies’ NPS score in 2025?
Albertsons Companies posts an NPS of 27, compared with a grocery industry average of 37, according to QuestionPro’s CX Benchmarking Report, which surveyed more than 1,000 US shoppers.
Here is the breakdown behind that score:
| Segment | Share of respondents |
|---|---|
| Promoters (score 9-10) | 51% |
| Passives (score 7-8) | 24% |
| Detractors (score 0-6) | 24% |
More than half of Albertsons shoppers are Promoters, which is a solid base. But a 24% Detractor rate is high enough to cancel out much of that goodwill, since the NPS formula directly subtracts Detractors from Promoters.
Because Albertsons Companies runs several banners, including Safeway, Vons, Jewel-Osco, and Shaw’s, the reported score is a company-wide average. Individual banners and regions can score higher or lower than the parent figure.
Independent research firm Comparably tracks a separate NPS for Albertsons Companies, landing at 3 using its own survey panel. That gap between Comparably’s number and QuestionPro’s 27 is a reminder that NPS depends on sample size and survey design, so the trend over time matters more than any single figure.
How does Albertsons compare to other grocery brands?
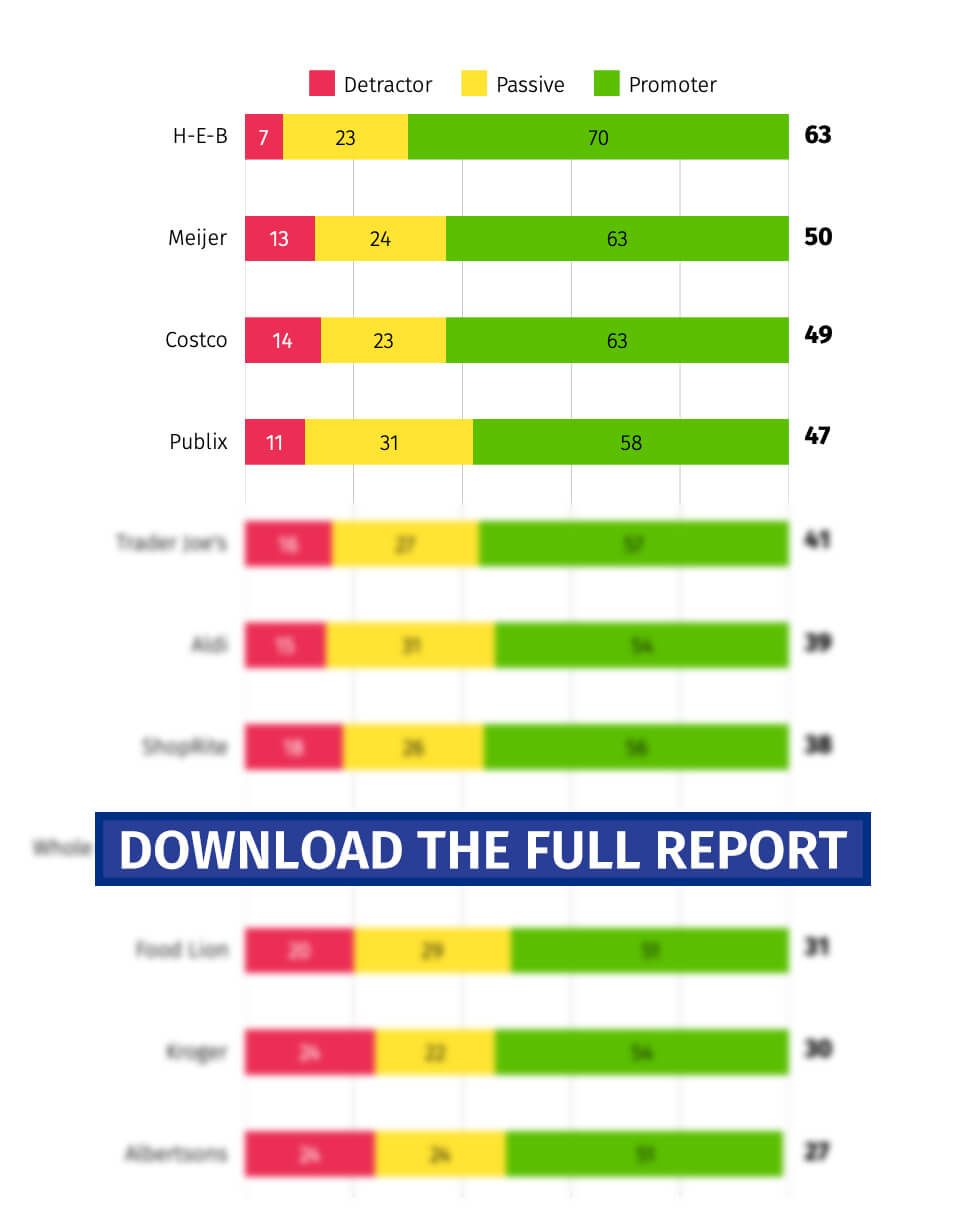
Albertsons trails the strongest performer among the grocery chains QuestionPro tracks each quarter.
- H-E-B: an NPS of 63, well above the grocery average, driven by consistent regional service.
- Grocery industry average: an NPS of 37, the baseline QuestionPro considers solid performance.
- Albertsons Companies: an NPS of 27, trailing the benchmark by ten points.
Brands like Kroger, Safeway, and Food Lion sit in a similar range to Albertsons. Warehouse and specialty grocers rank higher in separate industry research from Bain & Company, which tracks loyalty across dozens of US grocers. Costco leads the warehouse club segment, Aldi tops discount grocers, and Amazon ranks first among online grocery sellers, according to that research.
Bain’s research on grocery shoppers also found that an unfriendly staff interaction costs a retailer far more in loyalty than a slow one, with an unfriendly encounter carrying roughly double the point penalty of simply not finding help quickly. That pattern shows up in Albertsons’ own feedback too. Staff friendliness helps the score, but a single bad service moment can outweigh several good ones.
Shoppers weighing where to spend their grocery budget increasingly check these scores before committing loyalty to one chain. A ten-point gap between Albertsons and the industry average is the kind of difference that shows up in repeat visit rates, not just survey responses.
What’s driving Albertsons’ NPS score?
Several factors show up again and again in Albertsons shopper feedback, some helping the score and some working against it.
What’s helping:
- Customer service. Staff are frequently praised by name for friendly, helpful service.
- Product quality. Fresh produce, bakery, and deli items are a consistent strength.
- Convenience. Store locations make quick weekly trips easy for busy shoppers.
What’s hurting:
- Checkout wait times. Long lines and too few open lanes are a recurring complaint.
- Inconsistent service. Some departments, particularly meat and deli counters, get mixed reviews.
- Digital experience. The app and online ordering flow feel clunky to some shoppers.
- Limited specialty options. Shoppers want more gluten-free and dietary-specific products.
The now-abandoned Kroger-Albertsons merger, which courts blocked in December 2024, still lingers in some shoppers’ minds. It’s no longer an active business risk, but brand perception can outlast the news cycle that created it.
Common mistakes grocery brands make with NPS
A low score isn’t usually the real problem. Ignoring the reasons behind it is.
Many retailers treat NPS as a report card instead of a diagnostic tool. They track the number quarter to quarter but never follow up with the Detractors who explain what went wrong. A score change without that context tells a team almost nothing about what to fix.
Another common mistake is ignoring Passives. They aren’t complaining, so it’s tempting to file them under “fine.” But Passives are the group most likely to switch grocers the moment a competitor makes shopping easier, so they deserve just as much attention as Detractors do.
Treating a company-wide NPS as a single number also hides where the real problems live. A chain with dozens of banners and hundreds of stores needs store-level and department-level detail, not just one average, to actually act on the data.
How to measure and improve your grocery NPS score
Improving an NPS score, grocery or otherwise, follows a repeatable process. Here’s how retailers typically approach it with QuestionPro.
Step 1: Launch a targeted NPS survey
Start with the standard recommendation question, then add a short open-ended follow-up. QuestionPro’s AskWhy question lets shoppers explain their score in their own words right after they give the number. Most retailers build the questionnaire in QuestionPro’s Survey Software so the same logic runs across every store banner.
Step 2: Reach the right shoppers
Distribute the survey through email, SMS, QR codes at checkout, or a receipt link. Retailers that want to reach a specific region or demographic can use QuestionPro Audience to fill gaps in their own customer list.
Step 3: Track results as they arrive
Responses should sort automatically into Promoters, Passives, and Detractors as they come in. Teams collecting responses manually can drop the numbers into QuestionPro’s free NPS calculator for an instant score.
Step 4: Close the loop on feedback
A score only matters if someone acts on it. Route Detractor responses to store or department managers within days, not months, and follow up directly whenever a shopper leaves contact details. Retailers using QuestionPro Customer Experience software can automate that routing so complaints don’t sit untouched.
Turning shopper feedback into loyalty that lasts
Albertsons Companies has real strengths, from praised staff to well-located stores. But a 24% Detractor rate means real friction is pushing shoppers toward competitors, and that friction won’t close on its own.
Narrowing the gap takes more than watching a quarterly number. It means following up on Detractor feedback quickly, paying attention to Passives before they leave, and treating each store banner as its own dataset instead of one company-wide average. Grocery loyalty gets won one checkout line, one produce aisle, and one helpful associate at a time, and the score reflects it eventually.
The Q1 2025 NPS Benchmark Report reveals the strategies top brands use to earn loyal customers and keep them coming back.
Need help improving your NPS to boost your customer satisfaction?
Reach out to QuestionPro for customized support in measuring and improving your Net Promoter Score (NPS).
Frequently Asked Questions (FAQs)
Grocery NPS scores in QuestionPro’s benchmark average around 37, so scores above the mid-30s are competitive. Anything above 50 is considered excellent for the industry, while scores below 20 usually signal real friction in the shopping experience.
Warehouse and specialty grocers like Costco benefit from membership loyalty and curated selection, which naturally boosts advocacy. Albertsons runs traditional full-service stores across many regions and banners, which creates more variability in checkout speed, staffing, and department consistency store to store.
Yes. QuestionPro’s reported score of 27 is a company-wide average across Albertsons Companies’ banners. Individual regional chains can score higher or lower depending on local management, staffing levels, and store condition, so one number doesn’t capture banner-level differences.
QuestionPro’s CX Benchmarking Report refreshes quarterly, resurveying more than 1,000 US shoppers each cycle. That cadence lets retailers like Albertsons track whether specific changes, such as adding checkout lanes, actually move the score over time.
NPS predicts long-term loyalty from one relationship question, while CSAT measures satisfaction with a single visit. A shopper can rate one checkout poorly on CSAT while still remaining an NPS Promoter, since loyalty and single-visit satisfaction don’t always move together.
Albertsons Companies isn’t the only company in the grocery industry with valuable lessons for those looking to improve their customer service and experience. Below, we recommend a few articles where you can learn how other major brands manage to maintain a high NPS and a loyal customer base — you’ll surely find some useful insights along the way.