Standing out in crowded markets is more complex than ever. Products look similar, pricing is easy to copy, and customer expectations change quickly. This is why many organizations are turning to competitive advantage with survey data to understand what truly matters to their customers and act on it faster than others.
Survey data gives businesses direct insight into customer needs, preferences, and pain points. When used correctly, it replaces assumptions with clarity and helps teams make smarter choices across products, marketing, and customer experience.
In this blog, we’ll explore how survey data creates a competitive advantage and how organizations can turn feedback into lasting results.
What Competitive Advantage Means in Today’s Market
Competitive advantage today is less about having more features or lower prices and more about understanding customers better than anyone else. When products and services start to look similar, the real difference comes from insight.
Customers expect brands to listen, adapt, and respond quickly. Companies that rely on assumptions or outdated research often react too late. Those that consistently collect and use feedback can spot changes in expectations early and adjust before competitors do.
These insights drive data-driven decisions and inform competitive intelligence efforts. It gives organizations a clearer view of what matters most. Utilizing competitive intelligence and actionable insights helps teams make smarter choices across marketing, product development, and service.
Understanding market research allows organizations to make informed decisions that drive success and maintain customer loyalty, and these insights are essential for shaping effective business strategies.
Why Survey Data is a Strong Source of Competitive Advantage
Survey data gives businesses a broader and more reliable understanding of their market. It reflects not just what customers do, but why they behave the way they do. This depth of insight helps organizations see beyond surface-level trends and make more informed choices.
Here is why survey data creates a competitive advantage:
- It captures customer needs, expectations, and perceptions directly from the source
- It provides context behind customer behavior, not just outcomes
- It helps identify emerging trends and shifts in sentiment early
- It highlights strengths to protect and weaknesses to address
- It supports alignment across marketing, product, and service teams
- It helps identify patterns in consumer behavior and market trends
By analyzing individual data points collected from surveys, businesses can uncover valuable insights and achieve a comprehensive understanding of the market.
When used consistently, survey data becomes a strategic asset. It enables organizations to anticipate change, adapt faster, and stay relevant in competitive markets.
Learn More About: A Step-by-step Guide to Competitive Analysis
Types of Survey Data That Create Competitive Advantage
Different types of survey data help organizations answer different strategic questions. When used together, they provide clarity on what to improve, where to invest, and how to stand out in competitive markets.
Leveraging multiple data sources, including existing data, enables organizations to collect the necessary data for effective market research and informed decision-making.
Integrating primary and secondary research sources can help mitigate the limitations inherent in each type of research.
01. Customer Satisfaction Data
Customer satisfaction data measures how well experiences meet expectations. For example, post-purchase or post-support surveys can reveal slow response times or confusing processes that lead to frustration.

The data collected from satisfaction surveys can reveal critical moments that impact customer loyalty. Addressing these issues early helps prevent churn and strengthens trust.
In fact, 52% of consumers stop buying after just one bad experience, highlighting the importance of monitoring customer loyalty.
02. Loyalty and Advocacy Data
Loyalty and advocacy data explain long-term customer behavior. Metrics like recommendation intent or likelihood to return help identify what keeps customers engaged. For instance, a subscription business may learn that ease of use matters more than pricing for retention.
- Identifies drivers of repeat purchases
- Highlights reasons customers recommend a brand
- Signals future growth or risk areas
Additionally, predictive analytics can be applied to loyalty and advocacy data to forecast customer behavior, identify at-risk customers, and predict future purchase intent.
03. Product Feedback Data
Product feedback data focuses on how customers interact with features and functionality. It is often used during product launches or redesigns to understand what works and what does not.

Teams can use this data to prioritize feature improvements, remove friction, or validate new ideas before full rollout. Gap analysis can also be applied to product feedback data to identify unmet needs by asking respondents what competitors currently do not provide.
04. Market Research Data
Market research data provides insight beyond existing customers. It helps organizations understand broader market needs, preferences, and trends.
- Identifies unmet needs in the market
- Supports pricing and positioning decisions
- Helps compare offerings against competitors
- Provides market intelligence by analyzing industry trends, market trends, and the target market

Understanding key market players is essential for developing effective strategies. Market research helps businesses identify optimal opportunities for innovation and growth.
05. Brand Perception Data
Brand perception data shows how customers view a brand over time. For example, brand tracking surveys can reveal whether marketing efforts are improving awareness or trust compared to competitors.
Brand perception surveys also help organizations understand how customers perceive their brand compared to competitors, providing valuable insights into market positioning and competitive advantage.
When these different survey data types are combined, they create a stronger foundation for decision-making. This mix of feedback helps organizations act with confidence and build advantages that are harder for competitors to replicate. Additionally, analyzing competitors’ offerings and marketing materials can provide valuable insights for refining branding and messaging strategies.
Also Learn About: How to Analyze Survey Data to Interpret Results Effectively
How to Build Competitive Advantage with Survey Data
Survey data becomes a competitive advantage when it is used like a system, not a one-off project. The goal is to spot what customers want next, fix what holds them back, and move faster than others.
Data-driven decision making and operational efficiency are key to building a sustainable competitive advantage, as they enable organizations to improve business processes such as production, marketing, and regulatory compliance for faster market expansion and better resource utilization.
Analyzing competitive dynamics helps organizations stay ahead of market changes by understanding how market forces and competitor actions influence industry trends and strategic decisions.
Organizations can respond to market shifts 26% faster by integrating AI-powered analytics and continuous monitoring, and data-driven enterprises excel in performance and adapt swiftly to changes.
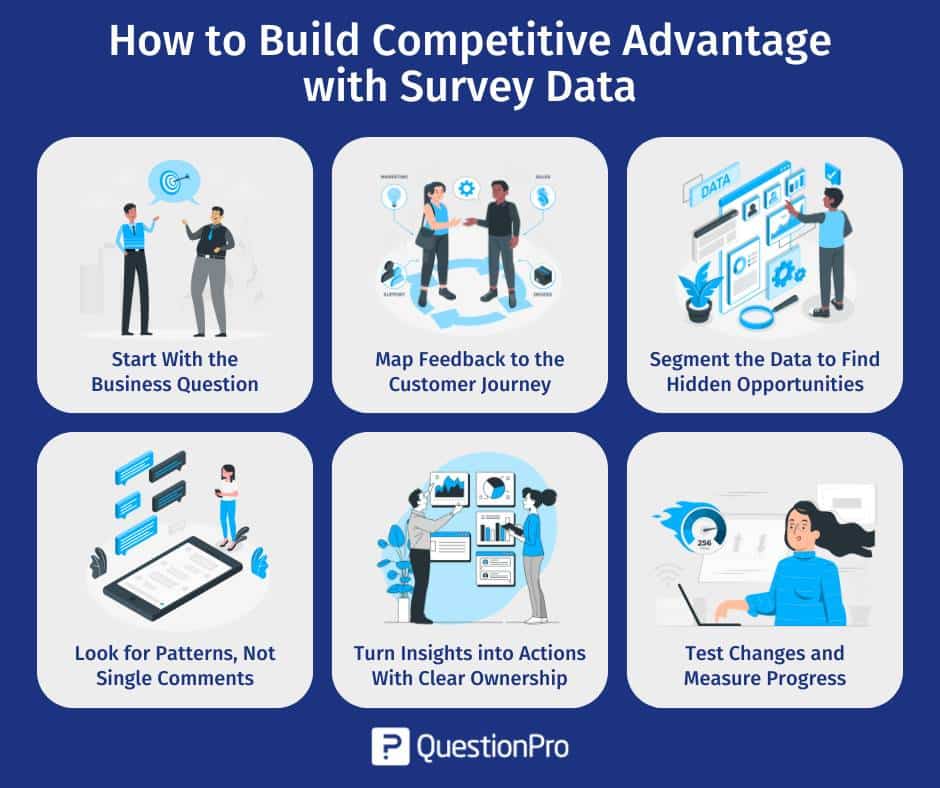
1. Start With the Business Question
Before reviewing results, define what you are trying to improve. This keeps the analysis focused and useful. Defining the business question also ensures that the necessary data collection is in place to inform strategic decisions.
Examples include:
- Reduce churn in the first 90 days
- Improve trial-to-paid conversion
- Increase feature adoption
- Strengthen brand trust after support interactions
A clear goal helps you focus on the insights that matter instead of getting lost in charts.
2. Map Feedback to the Customer Journey
Organize insights by key moments like onboarding, first success, renewals, and support. This helps you identify the exact points where customers get stuck or lose confidence.
A quick win here is spotting “high effort” moments where customers feel things are harder than expected.
3. Segment the Data to Find Hidden Opportunities
Averages can hide important differences. Break results down by customer type, plan level, region, acquisition channel, or tenure. Segmenting data helps organizations better understand their target customers and identify behavioral patterns that reveal new opportunities.
For example, your overall satisfaction might look fine, but new customers may report confusion during setup, while long-term customers are happy. That is where your competitive gap might be.
Data-driven strategies enable organizations to customize product offerings and marketing strategies to serve niches with significant growth potential.
4. Look for Patterns, Not Single Comments
Focus on repeated themes and trends. Combine quantitative scores with open-ended responses to understand both the “what” and the “why.”
- What issues show up most often?
- Which moments drive the biggest satisfaction drop?
- What do promoters mention that detractors do not?
Effective market research involves creating a comprehensive view of target markets through qualitative and quantitative methodologies.
5. Turn Insights into Actions With Clear Ownership
Insights need a next step and an owner. Turn findings into a short list of actions tied to teams. Teams should develop strategies based on actionable insights and regularly conduct competitive analysis to inform next steps. Here are some examples:
- Product team improves a confusing feature or workflow
- Support team updates scripts or response processes
- Marketing team adjusts messaging based on perception gaps
Regularly performing competitive analysis is necessary to track the impact of business initiatives.
6. Test Changes and Measure Progress
After you implement changes, run follow-up surveys to see if the experience improved. Tracking results over time shows whether actions are working and helps you stay ahead as expectations change.
When this loop becomes consistent, survey data stops being feedback and becomes a practical way to outperform competitors.
Common Mistakes When Using Survey Data
Survey data can create a real competitive advantage, but only when it is used thoughtfully. Many organizations collect valuable feedback but still miss the mark because of how they handle the data.
- Running surveys without a clear business objective
- Asking too many questions and lowering response quality
- Focusing only on scores and ignoring open-text feedback
- Looking at overall averages instead of key segments
- Sharing reports without defining next steps
- Collecting feedback but failing to act on it
Avoiding these mistakes helps ensure survey data leads to real insight, smarter decisions, and stronger customer relationships.
Examples of Competitive Advantage with Survey Data
Survey data creates a competitive advantage when it is tied to real decisions and visible improvements. Below are practical examples of how organizations use feedback to outperform competitors across different areas of the business.
Startups use survey insights to target niche markets and offer unique value propositions, allowing them to differentiate from larger competitors.
Additionally, pulse surveys provide a continuous stream of fresh data, enabling immediate strategic adjustments.
Reducing Churn by Fixing Early Friction
A SaaS company noticed that overall satisfaction scores looked healthy, yet customer churn in the first 60 to 90 days kept rising. Instead of running another broad survey, the team segmented onboarding feedback by customer tenure.
The pattern became clear. New customers felt overwhelmed during setup and were unsure which features to use first. This issue barely appeared in overall averages because long-term users were already comfortable with the product.
The team responded by:
- Simplifying the onboarding flow
- Adding guided walkthroughs for key actions
- Updating help content based on common questions
AI tools can also analyze survey responses alongside purchase history to predict future customer needs and further reduce churn.
Follow-up surveys showed a clear improvement in early experience scores, and churn dropped soon after. Competitors continued adding features, while this company focused on removing friction, creating a stronger early advantage.
Improving Product Adoption Through Feature Feedback
After launching several new features, a product team saw low adoption despite strong internal expectations. Usage data showed what was happening, but not why.
Understanding consumer preferences is essential for improving product adoption and ensuring new features meet customer needs.
Post-release surveys provided the missing context. Customers did not see the value of the new features and struggled to find them in the interface. Many described the product as “powerful but hard to navigate.”
Instead of building more functionality, the team focused on clarity:
- Simplified navigation and labels
- Improved in-product explanations
- Updated release communication based on customer language
Within weeks, adoption increased without adding new features. The team delivered more value by listening closely, while competitors continued to invest in development without clear validation.
These examples highlight a simple truth. Competitive advantage comes from using survey data to focus on the right improvements, not just more improvements.
Also Read: What Post-Purchase Survey is + Best Practices
How QuestionPro Helps You Create Competitive Advantage with Survey Data
Building a competitive advantage with survey data is much easier when you have one place to design surveys, reach the right people, and turn results into decisions. QuestionPro brings those steps together so feedback does not get stuck in spreadsheets or scattered tools.
- Create surveys that match your goal
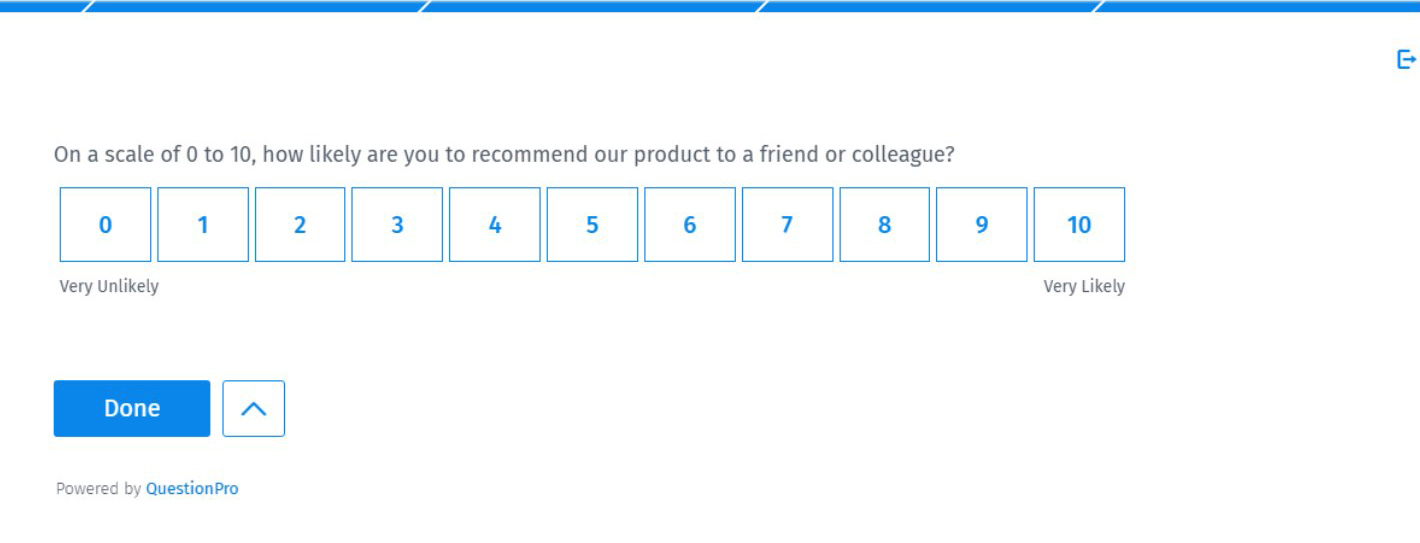
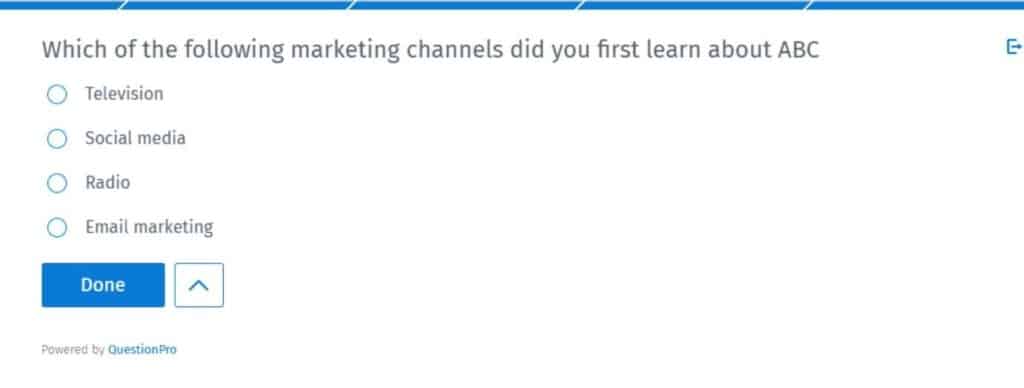
Use the right question types for the job, from open-ended and multiple choice to smiley ratings and NPS. Templates help you stay focused on collecting consistent, meaningful feedback.
- Reach people wherever they are
Distribute surveys through email, QR codes, social media, or website embeds. This makes it easier to meet respondents in the channels they already use.
- Collect responses efficiently
Choose the best collection method for your target audience, whether that is customers, employees, or targeted research participants. This helps improve relevance and response quality.
- Turn results into clear insights
Integrated dashboards make it simple to spot patterns and differences across segments. Tools like cross-tabs and trend views help teams see what is changing and what needs attention.
- Test scenarios with synthetic data modeling
Run “what-if” scenarios using existing datasets to estimate potential behavior shifts or campaign outcomes. This can give teams a head start when planning changes.
- Keep teams aligned
Share dashboards, export findings, and collaborate so product, marketing, and service teams can review insights together and agree on next steps.
A data-driven approach supports the overall business strategy by ensuring survey data is used to inform long-term planning. Integrating survey data with CRM records enables adaptive customer journeys based on individual preferences, making your strategy more responsive and effective.
By making it easier to collect, analyze, and act on feedback, QuestionPro helps organizations turn survey data into a consistent source of competitive advantage.
You can also create a survey for your competitive advantage with QuestionPro AI
Conclusion
Competitive advantage today comes from how well organizations understand and respond to their customers. Survey data provides that understanding by revealing what people expect, where they struggle, and what influences their decisions.
When feedback is collected with a clear purpose and used consistently, it helps teams prioritize the right improvements, reduce risk, and adapt faster than competitors. The real value is not in the volume of data, but in turning insights into action and measuring progress over time.
A strong competitive strategy and data-driven market entry are essential for long-term success, as they enable organizations to analyze industry trends, competitor responses, and consumer behavior for smarter market expansion.
With the right approach and tools, survey data becomes a reliable foundation for smarter decisions and long-term success in competitive markets. Organizations must invest time and energy into market research to gain a competitive edge in today’s digital environment.
Frequently Asked Questions (FAQs)
Answer: Customer satisfaction, loyalty, product feedback, market research, and brand perception surveys are all valuable. Each type supports different decisions and, together, they provide a complete view of the customer experience.
Answer: Survey frequency depends on the use case, but regular feedback is key. Ongoing or periodic surveys help track trends, measure improvements, and respond to changing expectations.
Answer: Data quality improves when organizations screen participants, validate responses, and remove incomplete or inconsistent entries before analysis.
Answer: Yes. Even simple surveys can uncover insights that help small teams prioritize improvements, reduce risk, and compete more effectively without large budgets.
Answer: QuestionPro helps teams design focused surveys, collect responses across channels, analyze results with built-in dashboards, and share insights easily. This makes it easier to turn feedback into action and stay ahead in competitive markets.