Correlation analysis – definition
Definition: Correlation analysis is defined as a statistical approach used to determine the relationship between the quantitative variables or categorical variables. With the help of correlation analysis, we can prove the relationship between two continuous variables; in short, it is a study conducted to understand how two variables are correlated.
Example: two variables like your body weight and daily calorie intake have a higher correlation. On the contrary, dog names and the brand of dog biscuits preferred by dogs will have a very low correlation.
Is data the new oil?
Once upon a time, the oil used to rule the global economy. It was an immensely precious asset of the 18th century. Without oil, economies used to shrink, governments used to tumble, and progress used to halt. Welcome to the future – a particular innovative wonder is fantastic the world; the advent of technology and the flow of data marked the beginning of the new global dominator. Around a decade ago, we heard what Clive Humby said – “Data is the new oil.”
According to Clive, data is a commodity, and if treated just like oil, data is also a resource of no value if it remains unrefined. Similar to oil, data also needs a proper drilling technique so that value can be retrieved from it. Remember, correlation analysis is a data drilling technique, and in no way, you can use it for drilling oil.
Correlation analysis – Innovative approach to drill data
When you want to determine correlation through data analysis, there are two types of data you need to work with
Univariate Data: When you want to work with a single variable, you need to measure the central tendency for inquiring about the representative data. Additionally, understand the deviation around the central tendency via dispersion. Measure the shape and size of the distribution through skewness. Apart from that, measure the concentration of data at the central position through kurtosis. Thus, data relating to a single variable is called Univariate data.
Bivariate Data: Correlation analysis is more about studying the relationship between two variables at the same time. Example, the price of a product versus average sales of the product or age versus blood pressure of a person. Thus, two characters of the same entity, when measured simultaneously with the help of statistical analysis then we term it as a bivariate data. In statistical analysis, distinguishing between categorical data and numerical data is essential, as categorical data involves distinct categories or labels, while numerical data consists of measurable quantities.
If there is any correlation between two variables, then whenever there is a systemic change is one variable, the other variable also changes. Thus, the variables alter together over a while. The correlation, therefore, found can be either positive or negative, depending on the measured numerical values.
- A positive correlation exists when, due to an increase in any one of the variables, the other variable also starts increasing, ensuring a positive correlation between them. Example: body weight of male and female are positively correlated
- A negative correlation exists when, due to the increase in any one of the variables, the other variable starts decreasing, ensuring a negative correlation between them. Example: An increase in price, leading to a decrease in sales.
How to use correlation analysis?
- Login into your QuestionPro account
- Go to ‘Surveys’
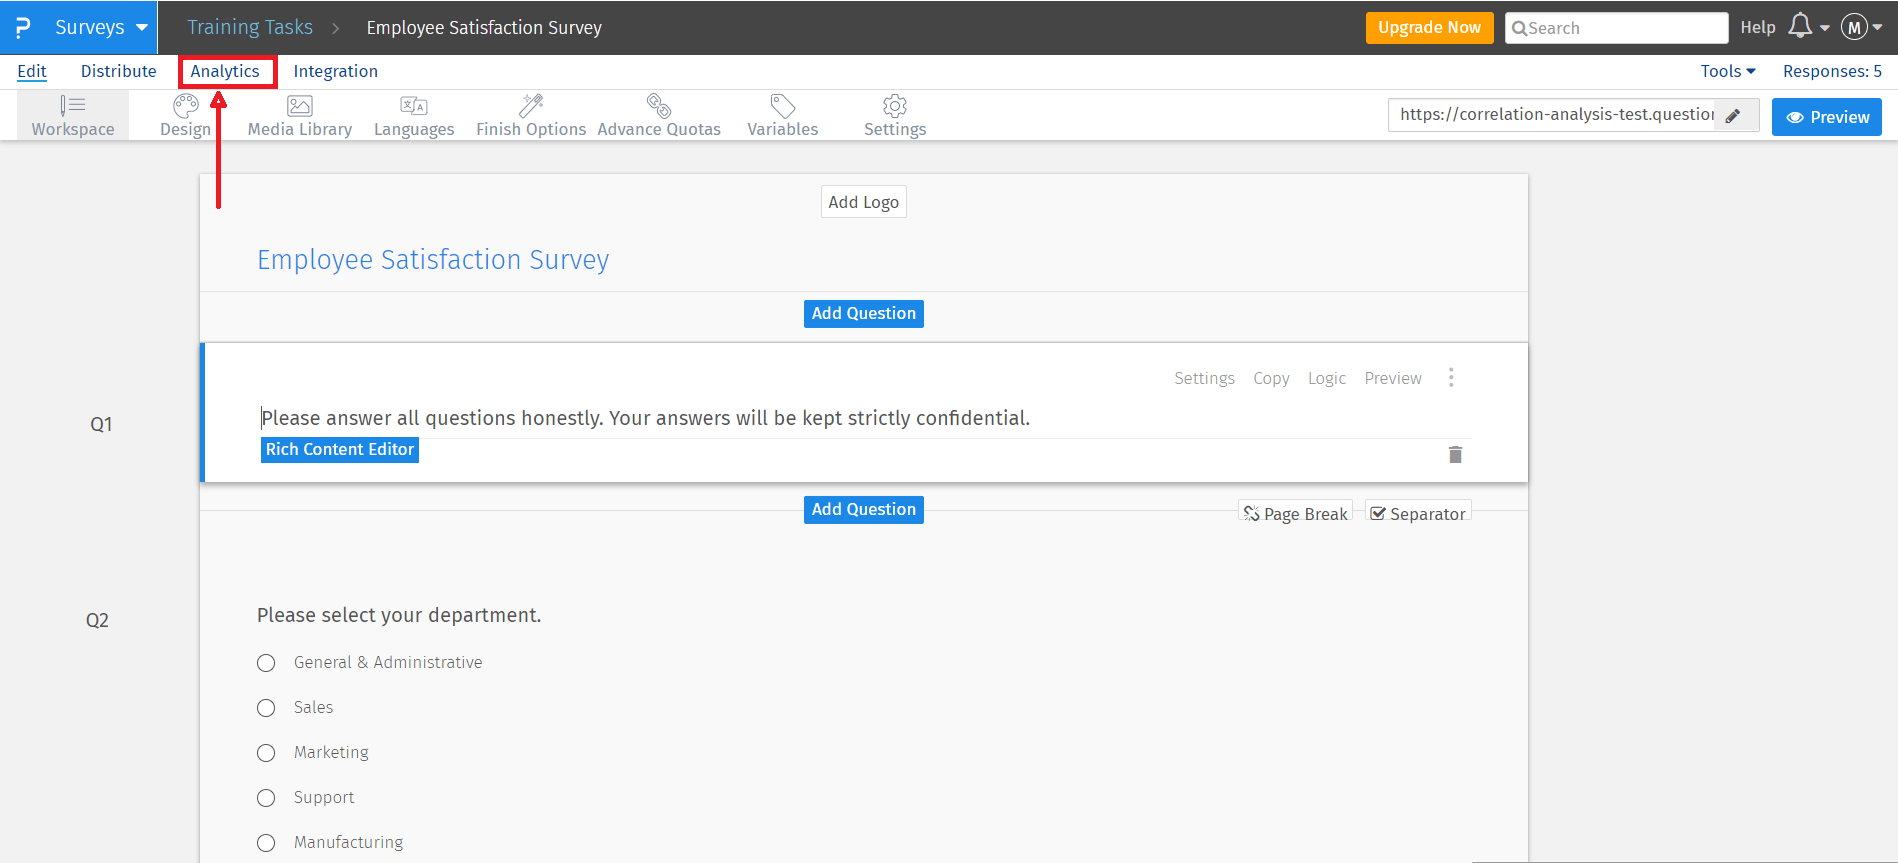
- Find the survey you want to analyze and open it
- Go to ‘Analytics’ press the button
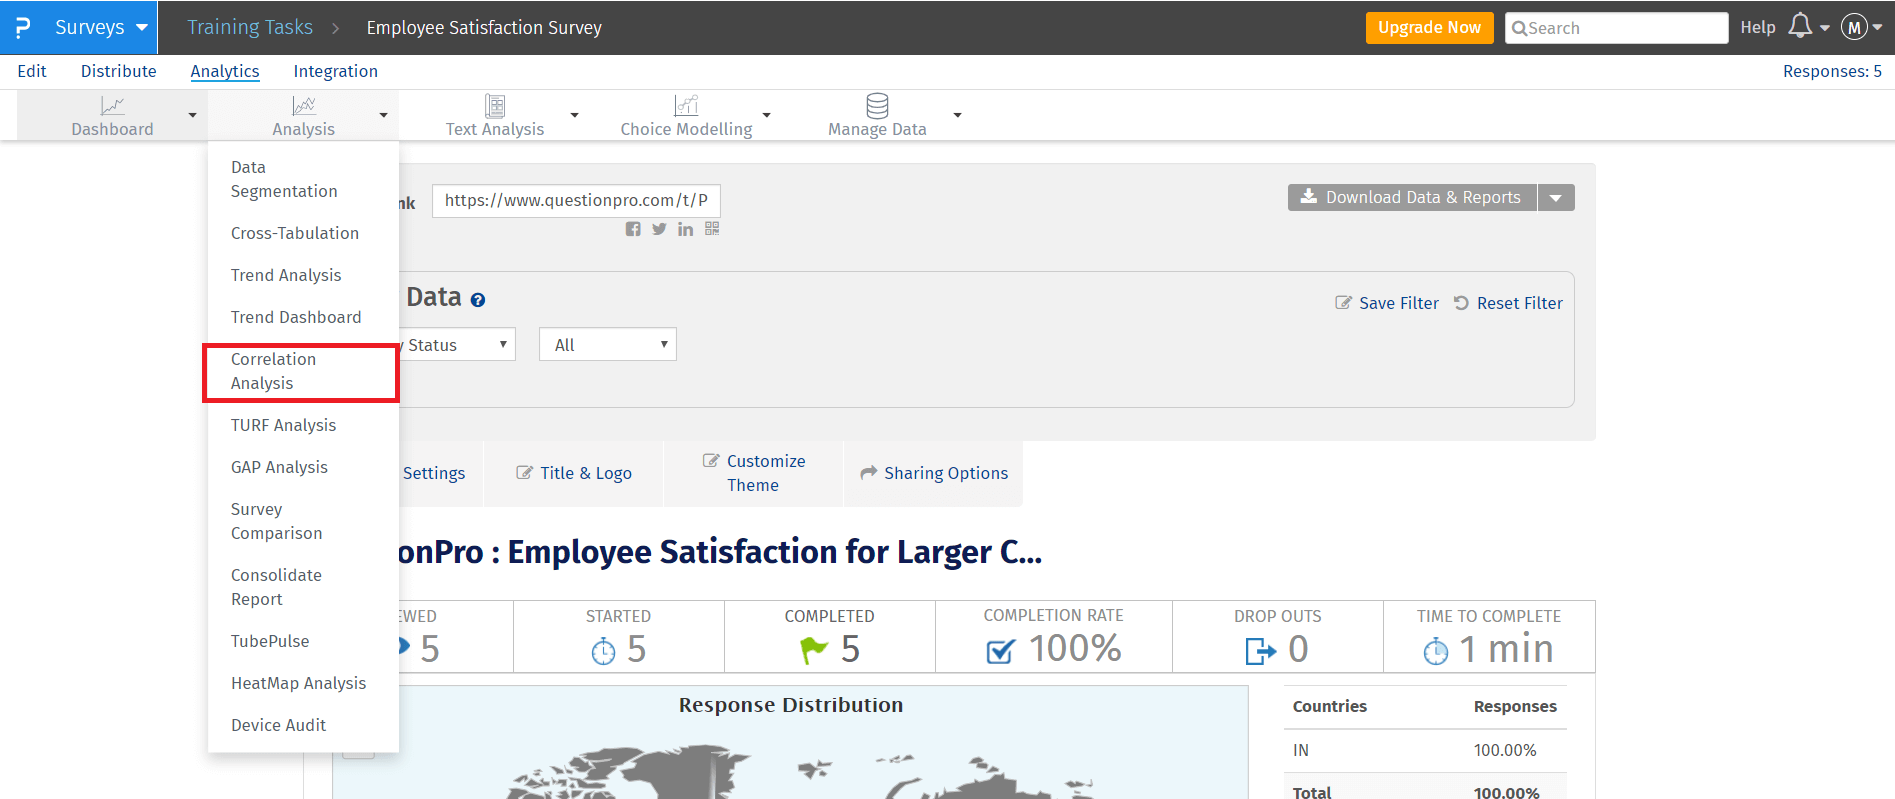
- Go to Analytics > ‘Correlation Analysis.’
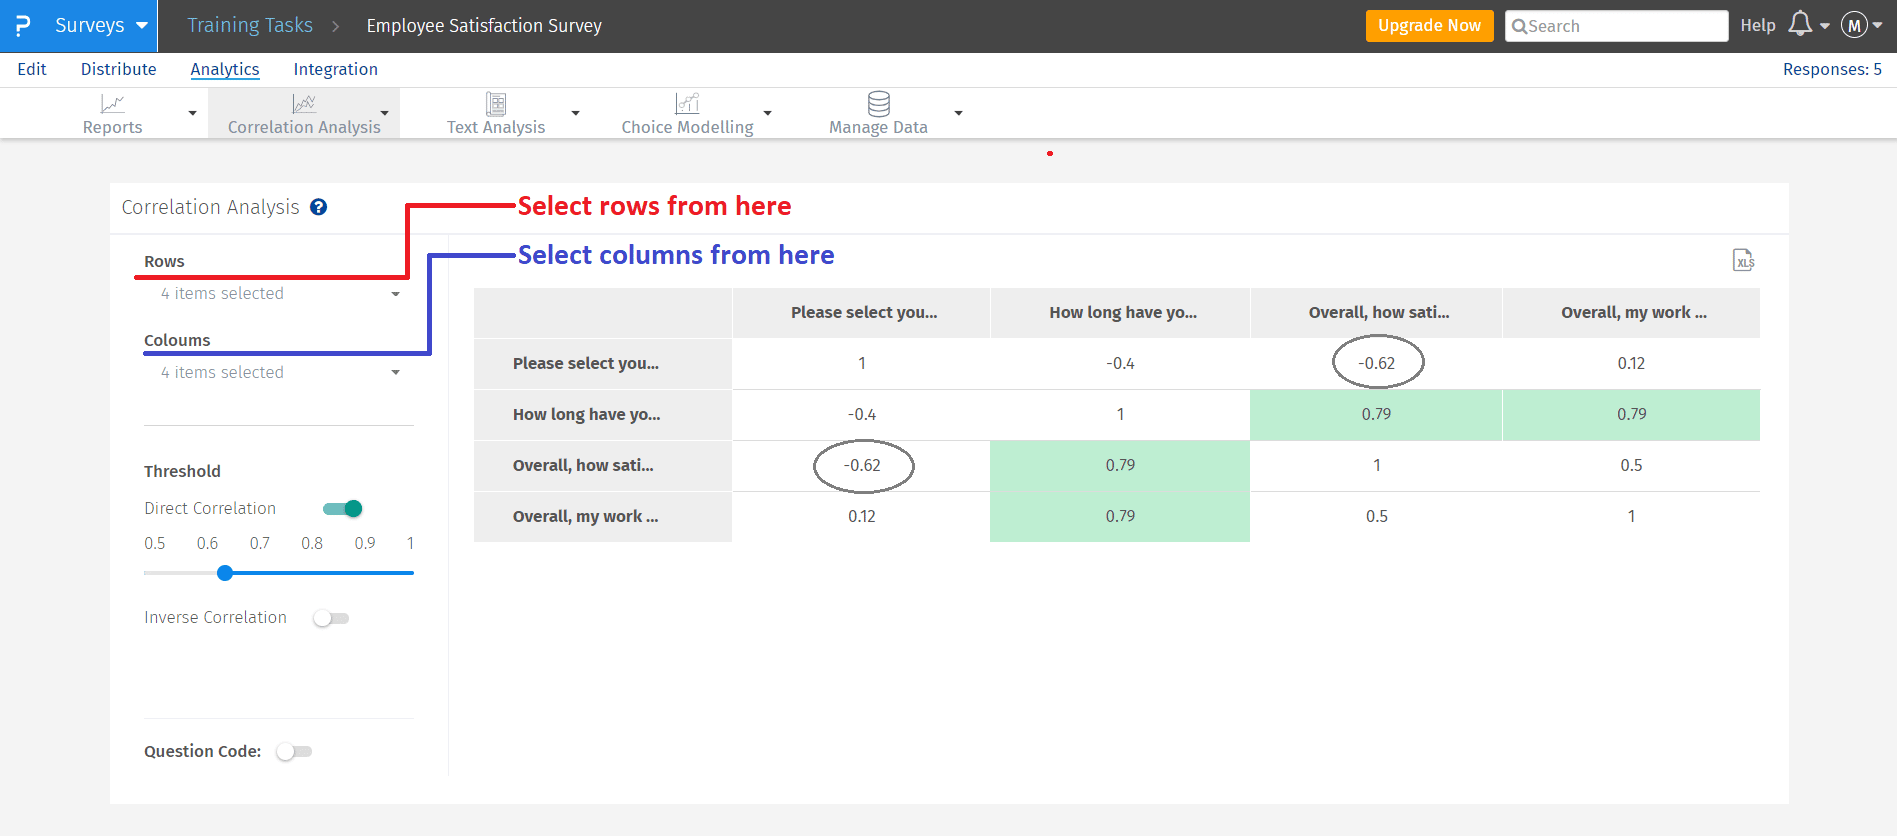
- The Highest positive correlation between employees and the time they are working with the company (+0.79)
- The Lowest negative correlation is between employees and their level of satisfaction with the company (-0.62)
Correlation analysis to drill down and drill through data
Be it any data, the primary methods used for data analysis are statistical analysis. Majority of quality management methods as if Six Sigma happen to be statistic intensive applying a variety of statistical techniques for data analysis and confirm the extent of deviation from the standard mean. These analytical techniques are very much useful in the long run for uncovering the precise information that will lead to decisions making and effective results.
Drill down and drill through are two significant and compelling data analysis techniques. Drill down is a method that is used to get a more specific view of the data. On the contrary, drill through technology is helpful to retrieve insights relevant to the purpose of analyzing data.
LEARN ABOUT: Correlational Research
Similar to oil, data needs refinement too
Do you think economies having plenty of oil resources are the wealthiest? Sadly, NO! But the countries having advanced potential to refine the oil are undoubtedly amongst the most prosperous economies. Just like oil, the value of data increases in many folds when it is improved. A refined data gives us information; this information is then converted to knowledge, and the experience thus gained is utilized to make decisions for getting expected results.
Data drilling is not something related to excel analytics, but it is beyond that; it covers 5 V’s – Volume, Velocity, Variety, Veracity, and Value. In addition to that, data drilling adds 3 A’s value to the raw data. A refined data in the form of ‘Analytics’ is smartly transformed into sequences of instructions resembling ‘Algorithm,’ these sequences of instructions are further developed into a consistent platform for running multiple programs like ‘Applications.’
Top four methods of correlation analysis
In statistical purposes, the correlation coefficient “r” measures the strength, direction, and extent of the relationship between two variables, where the value of “r” will always hinge between +1 and -1. Remember, it’s futile to calculate the correlation if there is no relation between the two variables as correlation only applies to linear relationships. Conversely, if there is a strong relationship between the two variables, but it is not linear, then the correlation received may be misleading. Therefore, it is advisable that before conducting correlation research by using any of the correlation coefficient methods always examines the scatter plot first. Here are some of the commonly used coefficient correlation methods.
-
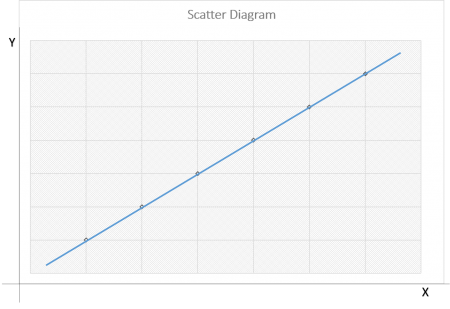
Scatter Diagram Method
The scatter diagram method is a naive approach in correlation unit of analysis used to find the correlation between two variables. The relationship between the two variables is diagrammatically presented to understand how closely they are related to each other.
- Also, called a scatter plot, scatter graph, or correlation chart
-
- The diagram or the chart has two variables along its ‘x’ and ‘y’ axis out of which one is independent and the other is the dependent variable
- It’s easy to predict the behavior of the de independent variable depending on the measure of the independent variable,
- According to the type of correlation, scatter diagrams are divided into a Scatter diagram with no correlation, scatter chart with moderate correlation and scatter diagram with a strong correlation.
-
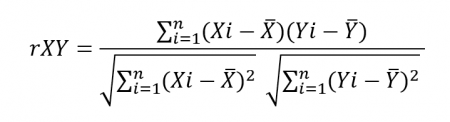
Pearson Correlation Coefficient
Also called the ‘product-moment correlation coefficient (PMCC) or simply ‘correlation.’ It is defined as a number between -1 and 1, indicating the extent to which the two variables are linearly related.
-
- Pearson correlation method is suitable for metric variables, which also includes dichotomous variables.
- The correlation is always denoted as ‘“r.”
- ‘r’ is independent of the unit of measurement. An example is one variable is in inches, and the other is in quintal. Then also, the value of Pearson’s coefficient correlation does not change.
- Pearson correlation formula
-
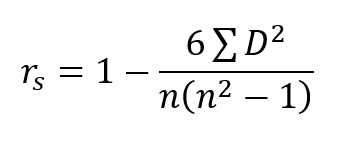
Spearman Rho Coefficient
It is a non-parametric version of the Perasnos’s coefficient correlation. This method is utilized to measure the strength and direction of relationship or association existing between the two variables.
-
- Greek letter rho (ρ) is used to denote the Spearman’s Correlation Coefficient
- The symbol rs also indicate it
- Spearman Rho is used either for ordinal variables or for continuous data that has failed the assumptions necessary for conducting the Pearson’s correlation coefficient.
- Spearman Rho Formula
-
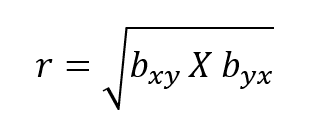
Least Squares Method
It is a mathematical problem used to find the degree of correlation between the two variables by using the square root of the product of two regression coefficient that of ‘x’ on ‘y’ and ‘y’ on ‘x.’
-
- The least-square method ensures to make the total of the square of the errors as low as possible
- Also called the Line of Best Fit
- It is used to calculate the mean of ‘x’ and ‘y’ values.
- The Least Squares Method formula
If data is the new oil, then data analysis is the combustion engine that generates mechanical power to derive insights and gain knowledge. Gone are the days when descriptive analysis and diagnostic analysis used to rule the data analysis regime. It’s time we move on to predictive, customer perspective, and cognitive analysis.
LEARN MORE: Descriptive Research vs Correlational Research
Similar to oil, people are finding new ways and sources to generate data. With evolving technology, we are finding new and better ways to collect data efficiently and options to refine this considerable amount of data with specialized techniques.
Do you know a barrel of crude oil costs less compared to a barrel of jet fuel? It is because refining crude oil yields jet fuel, which further increases in value by 33% to 35%. Similarly – you need to process data to gain maximum benefit. We, at QuestionPro, make it easier for you to drill and refine your survey data.