• Skip to main content
  • Skip to primary sidebar
  • Skip to footer
QuestionPro

QuestionPro

questionpro logo
  • Products
    survey software iconSurvey softwareEasy to use and accessible for everyone. Design, send and analyze online surveys.research edition iconResearch SuiteA suite of enterprise-grade research tools for market research professionals.CX iconCustomer ExperienceExperiences change the world. Deliver the best with our CX management software.WF iconEmployee ExperienceCreate the best employee experience and act on real-time data from end to end.
  • Solutions
    IndustriesGamingAutomotiveSports and eventsEducationGovernment
    Travel & HospitalityFinancial ServicesHealthcareCannabisTechnology
    Use CaseAskWhyCommunitiesAudienceContactless surveysMobile
    LivePollsMember ExperienceGDPRPositive People Science360 Feedback Surveys
  • Resources
    BlogeBooksSurvey TemplatesCase StudiesTrainingHelp center
  • Features
  • Pricing
Language
  • English
  • Español (Spanish)
  • Português (Portuguese (Brazil))
  • Nederlands (Dutch)
  • العربية (Arabic)
  • Français (French)
  • Italiano (Italian)
  • 日本語 (Japanese)
  • Türkçe (Turkish)
  • Svenska (Swedish)
  • Hebrew IL (Hebrew)
  • ไทย (Thai)
  • Deutsch (German)
  • Portuguese de Portugal (Portuguese (Portugal))
Call Us
+1 800 531 0228 +1 (647) 956-1242 +52 999 402 4079 +49 301 663 5782 +44 20 3650 3166 +81-3-6869-1954 +61 2 8074 5080 +971 529 852 540
Log In Log In
SIGN UP FREE

Home Market Research

Representative Sample: Definition, importance, & how to obtain a representative sample with examples

Representative Sample

What is a representative sample?

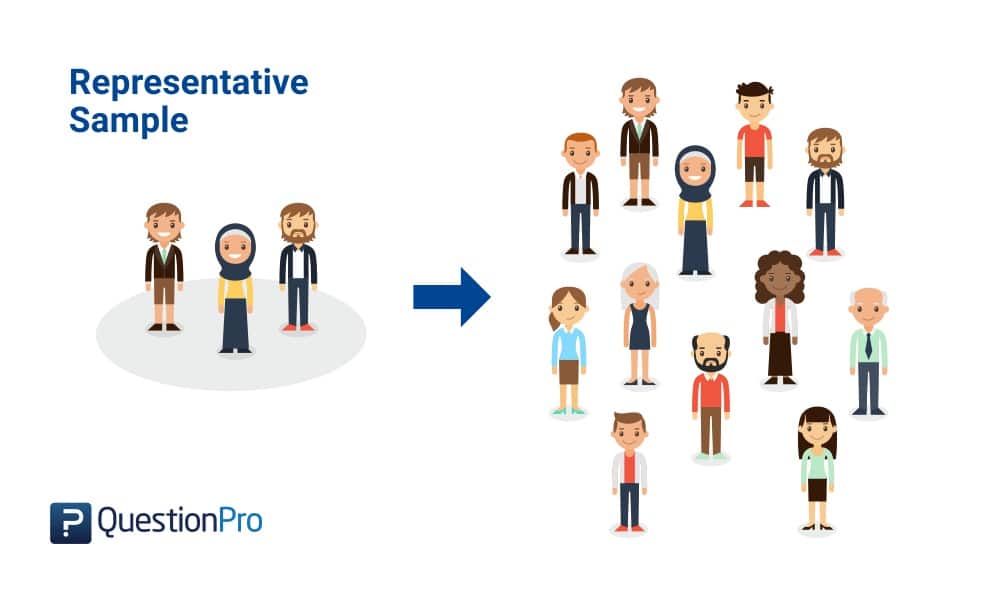
Representative sample definition: A representative sample is defined as a small quantity or a subset of something larger. It represents the same properties and proportions like that of a larger population.

For example, consider a brand that is about to launch a new product in a US city. It will be practically impossible to send a survey to collect insights into the product’s features from every person in the city. Therefore, researchers collect a small sample of people who will represent the city’s population, and a survey can be deployed to them to manage their feedback on the product. This sample is called a representative sample.

Select your respondents

A representative sample could be people or even chemical substances in scientific studies that can be tested in a laboratory to analyze the result of any particular chemical reaction. However, in this blog, we will concentrate on people and understand the importance of a representative population sample in market research and other helpful aspects is.

Why must you use a representative sample in research?

A representative sample allows researchers to abstract the collected information to a larger population. Most market research and psychological studies are unsuitable in terms of time, money, and resources to collect data on everyone. It is practically impossible to collect data from each person, especially for a large population such as an entire country.  

The good news is, “you don’t need to do it!”. What is more important here is to get a good representative sample, so that the vast majority of your time and energy will go into getting responses from a small group of people who will represent a larger population.

Time and again, research studies have employed a smaller group of people to conduct studies, collect data, and analyze the results. Let us understand the importance of a representative sample for significant research studies.

LEARN ABOUT: Survey Sampling

Importance of a representative sample for practical research studies

  • A representative sample will work in your favor to carry out successful market research. Can you imagine having to interview all the people in a country or even a city? It would sound the most impractical plan, be too complicated, and take a long time.
  • A representative sample is a small number of people who reflect a more extensive group as accurately as possible. Then we can apply, for example, an online survey to a sample of the population looking for it to be the most representative of our target population.
  • We will not have better results if, for example, we send a survey without taking representativeness into account, and we do not know who answers it and if the results represent the opinion of our target audience.
  • If we do not have representativeness, indeed, we will have data that will not serve us at all. We must guarantee that the sample carries the characteristics that matter to us for investigation.
  • Take into consideration that we will always have a bias in the sample because there will always be people who will not answer the survey because of various reasons or answer it incompletely. In this case, we cannot fully obtain the data that we require. Now regarding the sample size, the larger the sample size determination, it is more likely to represent the broader population closely.
  • A large representative sample gives us greater certainty that the people included are the ones we need, and we also reduce any possible bias. Therefore, if we want to avoid inaccuracy in our surveys, we must have representative and balanced samples.

If you want, you can also learn about Selection Bias through our blog.

How to build a representative sample

Researchers use two methods to build representative samples – Probability sampling and non-probability sampling

1. Probability sampling: Probability sampling is a technique in which a researcher chooses a sample from a larger population using a method based on the probability theory. For a participant to be considered a probability sample, he/she must be selected using a random selection.

If we will use probability sampling to obtain a representative sample, then simple random sampling is the best choice. The sample choice is made at random, which guarantees that each member of the population will have the same probability of selection and inclusion in the sample group.

2. Non-probability sampling: Non-probability sampling is a sampling technique in which the researcher selects samples based on the researcher’s subjective judgment rather than random selection. In non-probability sampling, not all population members have a chance of participating in the study, unlike probability sampling, where each member of the population has a known chance of being selected.

LEARN ABOUT: Sampling Frame

Knowing the selected sample’s demographic characteristics will undoubtedly help limit the profile of the desired sample and define the variables that interest us, such as gender, age, place of residence, etc. By knowing these criteria, before obtaining the information, we can have the control to create a representative sample that is efficient. We must avoid having a sample that does not reflect the target population. The idea is to have the most accurate data possible for our project’s success.

LEARN MORE: Population vs Sample

Avoid sampling errors for better representation

When a sample is not representative, we will have a sampling error known as the margin of error. If we want to have a representative sample of 100 employees, we must choose a similar number of men and women. For example, if we have a sample inclined to a specific genre, then we will have an error in the sample.

The sample size determination is essential, but it does not guarantee that it accurately represents the population that we need. More than size, representativeness is related to the sampling bias frame, that is, to the list from which people are selected, for example, part of a survey. Therefore, we must take care that people from our target audience are included in that list to say that it is a representative sample.

Example of a representative sample

A group of citizens representing the whole country is designated as a nationally representative sample. Researchers use it to reflect and project the national reality. It can be preferences of any kind, behavior, or socio-demographic profiles.

At its best, the representative sample will give the impression of being the total population, regardless of its looks. The numbers of men vs. women must match the national proportions, the percentage in each age group or each region will exactly match the population, etc. In non-demographic measures (such as product ownership or psychographic segmentation), the sample must match the population.

Select your respondents

Let’s take the example of age: if the researcher sets quotas at 16 to 34, 35 to 54, or greater than 55, the sample will be represented within these proportions. But if he/she analyzes age ranges 16 to 20, 21 a 30, 31 to 40, etc., there is no guarantee that the sample will remain correct.

The extent to which quota control in a sample is possible depends on the sample’s size and the reference data available in a survey. Six periods of age, two genera, and 15 regions create a grid of 180 cells. If the sample size is only 100, it is not possible to fill all the cells. Even with a larger sample size, a section may require only half a person, and therefore it will not have the data in it.

Weighting can be used to make a sample more representative. As an alternative to interlaced cells, the quota cells can be structured independently. The disadvantage here is that there may be considerable “gaps” in the sample. If all the youth are men, for example, it will not be possible to use the weighting to correct the gaps.

SHARE THIS ARTICLE:

About the author
Dan Fleetwood
President of Research and Insights at QuestionPro, a leader in web-based research technologies, with over 15 years of market research experience.
View all posts by Dan Fleetwood

Primary Sidebar

Unlock the Power of Research with QuestionPro Audience

Gain insights from more than 22 million high-quality respondents around the globe

Get a Free Quote Now!

RELATED ARTICLES

HubSpot - QuestionPro Integration

How To Accelerate Your Customer Experience Strategy — Tuesday CX Thoughts

Jun 21,2022

HubSpot - QuestionPro Integration

Random Iterative Method: What it is, Importance & Examples

Dec 08,2023

HubSpot - QuestionPro Integration

Ethnographic Research: What is it, Types, Methods + Pros & Cons

Mar 09,2023

BROWSE BY CATEGORY

  • Academic
  • Academic Research
  • Artificial Intelligence
  • Assessments
  • Audience
  • Brand Awareness
  • Business
  • Case Studies
  • Communities
  • Consumer Insights
  • Customer effort score
  • Customer Engagement
  • Customer Experience
  • Customer Loyalty
  • Customer Research
  • Customer Satisfaction
  • CX
  • Employee Benefits
  • Employee Engagement
  • Employee Engagement
  • Employee Retention
  • Enterprise
  • Events
  • Forms
  • Friday Five
  • General Data Protection Regulation
  • Guest Post
  • Insights Hub
  • Life@QuestionPro
  • LivePolls
  • Market Research
  • Marketing
  • Mobile
  • Mobile App
  • Mobile diaries
  • Mobile Surveys
  • New Features
  • non-profit
  • NPS
  • Online Communities
  • Polls
  • Question Types
  • Questionnaire
  • QuestionPro
  • QuestionPro Products
  • Release Notes
  • Research Tools and Apps
  • Revenue at Risk
  • Startups
  • Survey Templates
  • Surveys
  • Tech News
  • Tips
  • Training
  • Training Tips
  • Trending
  • Tuesday CX Thoughts (TCXT)
  • Uncategorized
  • VOC
  • Webinar
  • Webinars
  • What’s Coming Up
  • Workforce
  • Workforce Intelligence

Footer

MORE LIKE THIS

artificial-data

What is Artificial Data & How It’s Shaping Research

May 20, 2025

wells-fargo-nps-2025

Wells Fargo NPS 2025: What Businesses Can Learn

May 19, 2025

word-cloud

Word Cloud: What it is & How to Use QuestionPro Word Cloud?

May 16, 2025

synthetic data and ai - market research

Redefining Research Strategy with AI and Synthetic Data

May 15, 2025

Other categories

  • Academic
  • Academic Research
  • Artificial Intelligence
  • Assessments
  • Audience
  • Brand Awareness
  • Business
  • Case Studies
  • Communities
  • Consumer Insights
  • Customer effort score
  • Customer Engagement
  • Customer Experience
  • Customer Loyalty
  • Customer Research
  • Customer Satisfaction
  • CX
  • Employee Benefits
  • Employee Engagement
  • Employee Engagement
  • Employee Retention
  • Enterprise
  • Events
  • Forms
  • Friday Five
  • General Data Protection Regulation
  • Guest Post
  • Insights Hub
  • Life@QuestionPro
  • LivePolls
  • Market Research
  • Marketing
  • Mobile
  • Mobile App
  • Mobile diaries
  • Mobile Surveys
  • New Features
  • non-profit
  • NPS
  • Online Communities
  • Polls
  • Question Types
  • Questionnaire
  • QuestionPro
  • QuestionPro Products
  • Release Notes
  • Research Tools and Apps
  • Revenue at Risk
  • Startups
  • Survey Templates
  • Surveys
  • Tech News
  • Tips
  • Training
  • Training Tips
  • Trending
  • Tuesday CX Thoughts (TCXT)
  • Uncategorized
  • VOC
  • Webinar
  • Webinars
  • What’s Coming Up
  • Workforce
  • Workforce Intelligence

questionpro-logo-nw
Help center Live Chat SIGN UP FREE
  • Sample questions
  • Sample reports
  • Survey logic
  • Branding
  • Integrations
  • Professional services
  • Security
  • Survey Software
  • Customer Experience
  • Workforce
  • Communities
  • Audience
  • Polls Explore the QuestionPro Poll Software - The World's leading Online Poll Maker & Creator. Create online polls, distribute them using email and multiple other options and start analyzing poll results.
  • Research Edition
  • LivePolls
  • InsightsHub
  • Blog
  • Articles
  • eBooks
  • Survey Templates
  • Case Studies
  • Training
  • Webinars
  • All Plans
  • Nonprofit
  • Academic
  • Qualtrics Alternative Explore the list of features that QuestionPro has compared to Qualtrics and learn how you can get more, for less.
  • SurveyMonkey Alternative
  • VisionCritical Alternative
  • Medallia Alternative
  • Likert Scale Complete Likert Scale Questions, Examples and Surveys for 5, 7 and 9 point scales. Learn everything about Likert Scale with corresponding example for each question and survey demonstrations.
  • Conjoint Analysis
  • Net Promoter Score (NPS) Learn everything about Net Promoter Score (NPS) and the Net Promoter Question. Get a clear view on the universal Net Promoter Score Formula, how to undertake Net Promoter Score Calculation followed by a simple Net Promoter Score Example.
  • Offline Surveys
  • Customer Satisfaction Surveys
  • Employee Survey Software Employee survey software & tool to create, send and analyze employee surveys. Get real-time analysis for employee satisfaction, engagement, work culture and map your employee experience from onboarding to exit!
  • Market Research Survey Software Real-time, automated and advanced market research survey software & tool to create surveys, collect data and analyze results for actionable market insights.
  • GDPR & EU Compliance
  • Employee Experience
  • Customer Journey
  • Synthetic Data
  • About us
  • Executive Team
  • In the news
  • Testimonials
  • Advisory Board
  • Careers
  • Brand
  • Media Kit
  • Contact Us

QuestionPro in your language

  • English
  • Español (Spanish)
  • Português (Portuguese (Brazil))
  • Nederlands (Dutch)
  • العربية (Arabic)
  • Français (French)
  • Italiano (Italian)
  • 日本語 (Japanese)
  • Türkçe (Turkish)
  • Svenska (Swedish)
  • Hebrew IL (Hebrew)
  • ไทย (Thai)
  • Deutsch (German)
  • Portuguese de Portugal (Portuguese (Portugal))

Awards & certificates

  • survey-leader-asia-leader-2023
  • survey-leader-asiapacific-leader-2023
  • survey-leader-enterprise-leader-2023
  • survey-leader-europe-leader-2023
  • survey-leader-latinamerica-leader-2023
  • survey-leader-leader-2023
  • survey-leader-middleeast-leader-2023
  • survey-leader-mid-market-leader-2023
  • survey-leader-small-business-leader-2023
  • survey-leader-unitedkingdom-leader-2023
  • survey-momentumleader-leader-2023
  • bbb-acredited
The Experience Journal

Find innovative ideas about Experience Management from the experts

  • © 2022 QuestionPro Survey Software | +1 (800) 531 0228
  • Sitemap
  • Privacy Statement
  • Terms of Use