
User retention measures how many people keep using a product, app, or service after their first interaction. It tells product and customer experience teams whether people find enough value to come back, rather than just whether they signed up in the first place.
For SaaS companies, mobile apps, and subscription platforms in the United States, this number is often a clearer signal of product health than signups or downloads ever are. Acquiring a user costs money. Keeping that user proves the product actually delivers on what it promised during marketing.
In this guide, we’ll break down what user retention means, how it differs from customer retention and churn, the benchmarks that count as good, and the specific steps teams use to raise it.
What is user retention?
User retention is the percentage of users who continue using a product during a set period after their first interaction.
For example, if 1,000 users sign up for a product in January and 300 of them are still active in February, the product retained 300 users from that starting group.
User retention is commonly tracked by:
- SaaS companies
- Mobile app teams
- Online communities
- Subscription platforms
- Product teams
- Customer experience teams
A retained user is not automatically a paying customer. Some retained users stay on a free plan, a trial, or a freemium tier without ever converting. Over time, though, retained users become the pool a business draws its customer lifetime value from, since a longer relationship gives more chances to upgrade or renew.
User retention vs customer retention vs churn: What is the difference?
User retention, customer retention, and churn get used interchangeably, but each one answers a different question. Mixing them up leads teams to compare product usage data against billing data, which rarely lines up.
| Term | What it measures | Example |
|---|---|---|
| User retention | Continued product usage, paid or unpaid | A free user logs in every week |
| Customer retention | Continued paying relationship | A customer renews a subscription |
| Customer churn | Users who stop using the product in a period | 30 out of 100 users go inactive in a month |
Customer churn is the mirror image of retention. When retention rate is high, churn is usually low, and the two figures should add up to 100 percent for the same period. A product with 70 percent retention in a month has a 30 percent churn rate for that same group.
What is a good user retention rate?
There is no single “good” number that applies to every product. The right benchmark depends on the category, the business model, and how often people are actually expected to open the product.
Retention differences matter more than they look on paper. Bain & Company research found that retaining just 5 percent more customers can boost profits by almost 100 percent, because customer relationships tend to become more profitable the longer they last.
For mobile apps specifically, Braze reports Day 30 retention running from roughly 1 to 15 percent across categories, with news and finance apps holding on the longest and casual categories like photo and video apps sitting at the low end.
Apps people rely on for recurring work or money tend to hold users far longer than casual consumer apps, where the next competing download is one tap away. B2B SaaS products, which are judged over weeks or months rather than days, are usually benchmarked on monthly or quarterly retention instead of Day 1 or Day 30 figures.
How do you calculate user retention rate?
You calculate user retention rate by comparing how many users are still active at the end of a period with how many were active when that period started.
User retention formula:
User retention rate = (Active users at the end of a period ÷ Active users at the start of the period) × 100
For example, a mobile app gets 2,000 new users in January. By the end of February, 500 of those users are still active.
500 ÷ 2,000 × 100 = 25 percent user retention rate.
Teams typically track this across several windows, such as Day 1, Day 7, Day 30, monthly, or quarterly retention, depending on how often the product is meant to be used. A cohort, meaning a group of users who share the same starting point such as signup month, makes this comparison more useful, since it shows whether people who joined in one month stick around longer than people who joined in another. For related figures to track alongside retention, see QuestionPro’s guide to customer retention metrics.
What are the stages of user retention?
The main phases of user retention are onboarding, activation, and habitual use. Each phase shows whether users understand the product, experience its value, and build a reason to return.
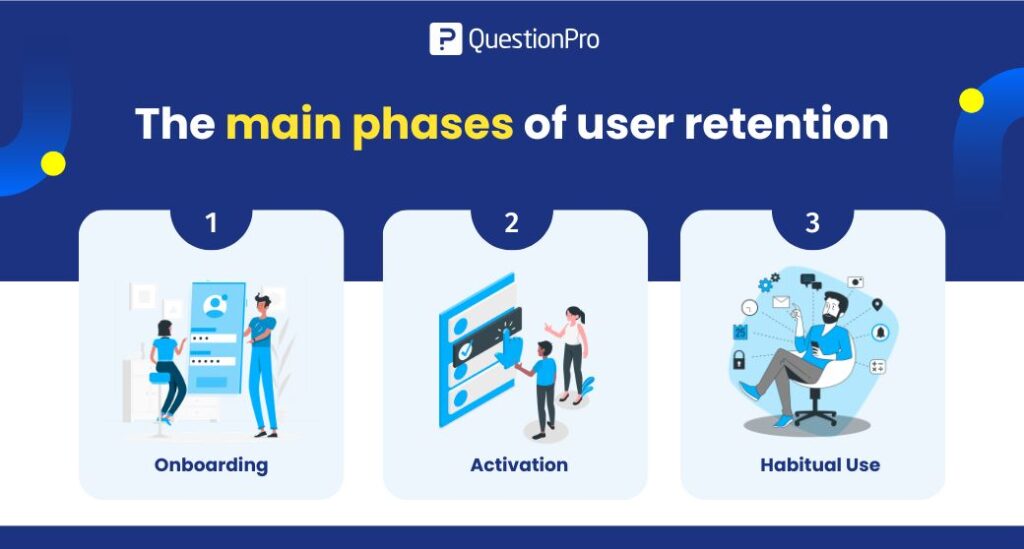
Onboarding
Onboarding is the first stage after signup. It should guide a new user toward one useful action instead of overwhelming them with every feature at once. In a survey platform, that first action might be choosing a template or collecting a first response.
Activation
Activation is the moment a user experiences the product’s core value for the first time. It is defined here as the point where a product stops feeling unfamiliar and starts feeling useful. For a feedback platform, that might be the moment a user views their first set of results.
Habitual use
Habitual use happens when a product becomes part of a user’s routine. This does not require daily use. Some products fit a weekly, monthly, or project-based rhythm, and the goal is matching that natural cadence rather than forcing more frequent visits.
What causes poor user retention? Common mistakes to avoid
Most retention problems trace back to a handful of avoidable mistakes rather than a fundamentally broken product.
| Mistake | Why it hurts retention | Fix |
|---|---|---|
| Overloading onboarding with every feature | Users get confused before finding real value | Guide new users to one clear first action |
| Ignoring inactive users | Teams never learn why people quietly leave | Send a short exit or win-back survey |
| Tracking only usage data | Numbers show what happened, not why it happened | Pair product data with a customer retention survey |
| Treating every user the same | Retention drivers differ by plan, device, or use case | Segment retention by user type before changing anything |
| Measuring retention once and stopping | Retention shifts as the product and market change | Review retention on a recurring schedule, not just once |
Real-world examples of user retention in action
Retention tactics look different depending on the type of product, but the underlying pattern is usually the same: give users a reason to come back before they forget why they signed up.
Habit loops in consumer apps
Many language-learning and fitness apps rely on daily streaks and reminder notifications. The goal is to pull a user back before a streak breaks, since a broken streak is one of the most common points where casual users quietly stop returning.
Team-based activation in B2B software
Workplace communication and project tools often tie activation to a second person joining the account. Once a teammate is invited and a first message or task is shared, retention becomes a function of the whole team’s habits, not just one person’s.
Feedback loops in subscription businesses
Streaming services and subscription commerce brands frequently trigger a short survey or a win-back offer the moment a customer starts the cancellation flow. Tying retention directly to a customer’s stated reason for leaving turns a guess into an actionable fix.
How can you improve user retention?
You improve user retention by helping users reach value faster, removing friction, and learning why people stop returning instead of guessing.
- Simplify onboarding: Remove unnecessary steps and point users toward one useful action first.
- Improve activation: Identify the specific action that makes users understand the product’s value, then design the first session around it.
- Track drop-off points: Find exactly where users stop during signup, setup, or first use.
- Ask inactive users directly: Pair usage data with feedback, including NPS or CSAT follow-ups, to learn whether confusion, missing features, or pricing drove someone away.
- Segment users: Compare retention by plan, device, location, or behavior instead of looking at one blended average.
- Act on what you learn: Close the loop with users after a change ships, so they know their feedback led somewhere.
Retention improves once teams stop guessing. Product behavior shows what users did. Feedback explains why they did it.
How can QuestionPro help with user retention?
QuestionPro can help businesses understand retention by collecting feedback across the user journey, from onboarding through renewal, and connecting that feedback to the usage data teams already track. Instead of only knowing that users stopped logging in, teams can find out why through onboarding surveys, product satisfaction checks, and exit feedback from inactive accounts.
Ask users what happened, look for patterns across accounts, fix the friction point, then follow up to confirm the change worked.
Teams that pair this kind of feedback with QuestionPro Customer Experience software can trace a retention drop back to a specific stage of the journey instead of relying on a hunch.
Retention is a signal, not a finish line
A single retention percentage never tells the whole story by itself. Teams that track retention rate, churn, and activation together, and that talk to both active and inactive users, tend to catch problems earlier than teams that watch a usage dashboard alone.
Better retention usually comes from practical, unglamorous work: clearer onboarding, faster activation, fewer friction points, and a regular habit of asking users what happened. For a longer, more reflective take on why this metric deserves attention beyond the product team, see QuestionPro’s Tuesday CX Thoughts column on why user retention matters for long-term brand loyalty.
Frequently Asked Questions (FAQs)
No. A 90 percent rate is common for subscription services people rely on daily but unrealistic for casual mobile games or seasonal products. Compare a retention rate against products in the same category and usage pattern, not against a single universal target.
Yes. User retention tracks product usage, not billing status, so an active free or trial user still counts. That is why a product can show strong user retention alongside weaker customer retention if few free users ever convert to paying accounts.
Most SaaS and app teams review retention weekly or monthly, since waiting a full quarter can hide a problem for months. Teams launching onboarding or pricing changes often check retention within days to catch early drop-off before it becomes a trend.
Yes. A product can retain many free or low-tier users who rarely convert, which keeps usage numbers healthy while revenue stays flat. That gap is usually why teams track customer retention and customer lifetime value alongside user retention rather than relying on one metric alone.
A retention curve plots the percentage of a cohort still active on each day or week after signup. A curve that keeps dropping toward zero signals a leaky product, while a curve that flattens out at some point usually signals a stable, engaged user base.