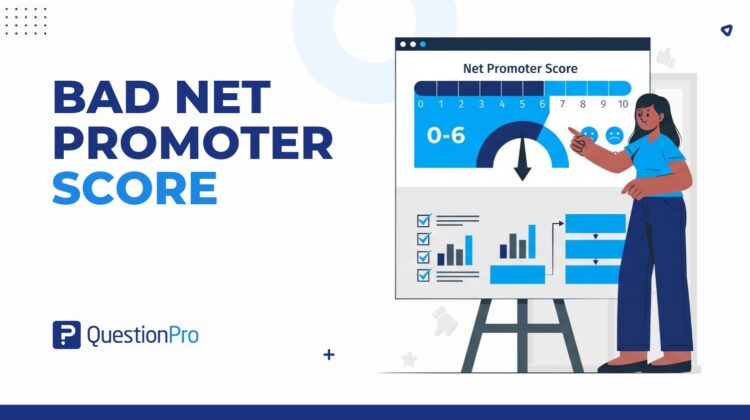
A bad Net Promoter Score (NPS) means more of your customers would warn others away than recommend you. Detractors outnumber promoters, and the score drops below zero. That is the short definition, and it hides a lot of nuance.
A positive score can still be bad when your competitors average far higher. Context decides what bad means for your business.
In this blog, we’ll define a bad NPS score, show how to test whether the number is real, and lay out a 90-day plan to fix it.
What is a bad Net Promoter Score?
A bad Net Promoter Score is any score below zero, which means detractors outnumber promoters among the customers you surveyed. NPS runs from -100 to +100, so a negative result shows that more customers are unhappy enough to discourage others than are happy enough to recommend you.
The score comes from one question: how likely are you to recommend us to a friend or colleague? Customers answer on a 0 to 10 scale, and each answer places them in one of three groups.
- Promoters (9 or 10): Loyal customers who keep buying and recommend you to others.
- Passives (7 or 8): Satisfied customers who feel no strong attachment and may leave for a better offer.
- Detractors (0 to 6): Unhappy customers who may stop buying and may discourage others.
NPS equals the percentage of promoters minus the percentage of detractors. Passives count in the total number of responses but drop out of the subtraction. This guide shows how to calculate NPS step by step, and a built-in NPS survey sorts responses into the three groups for you.
How a score turns negative
A negative score does not need a majority of detractors. Suppose you survey 200 customers. Thirty-six answer 9 or 10, ninety-two answer 7 or 8, and seventy-two answer 0 to 6. That gives 18% promoters and 36% detractors, so NPS is 18 minus 36, or -18.
Notice that passives form the largest group in this example, at 46%. A bad NPS often signals indifference more than anger. Lukewarm customers stay until a better offer arrives.
Bad NPS versus similar terms
Several neighboring terms get mixed up with a bad NPS. Each one points to a different problem, so the label decides where your team looks first.
| Term | What it describes | Example |
|---|---|---|
| Bad NPS | Detractors outnumber promoters, so the score sits below 0 | -18 |
| Low NPS | A positive score that sits well below your industry average | +25 in an industry that averages 68 |
| Falling NPS | A drop against your own earlier result, even if still positive | +40 last year, +28 now |
| Low CSAT | Customer Satisfaction Score: customers rated one interaction poorly | 62% satisfied after a support call |
| Poor CES | Customer Effort Score: a task felt hard to finish | Checkout took too many steps |
| Bad eNPS | Employee Net Promoter Score below 0 | More employees would discourage friends from joining than recommend the workplace |
Is a bad NPS score always negative?
No. A negative score is bad in absolute terms, but a positive score can also be bad when it sits far below your industry average. Judge your number against zero first, then against peers who sell what you sell.
Industry averages show how wide the gap can be. Retently’s 2026 NPS benchmark covers 14 industries, and every average came in positive, from 26 to 68. A score of 25 reads very differently across three of them:
- Financial Services (average 68): A 25 trails the pack by more than 40 points.
- Healthcare (average 37): A 25 sits below average and deserves a root-cause review.
- Internet Software & Services (average 26): A 25 is essentially par.
Negative scores do appear inside individual sectors. Retently’s five-year data shows Communication & Media averaging 19, with a low of -6. A low-looking number can also lead its category. Retently reports that Verizon’s 2019 score of 19 was still the best among internet service providers.
For more sector figures, see our NPS benchmarks by industry. QuestionPro also publishes its CX Benchmarks, which track NPS, CSAT, and CES for U.S. brands every quarter.
What causes a bad Net Promoter Score?
A bad score rarely has a single cause. Detractor comments tend to cluster around a handful of repeat themes, so match each theme to a source before you plan a fix.
| Cause | What detractors often say | First place to look |
|---|---|---|
| Unmet expectations | “It did not do what I was told.” | Sales promises and marketing claims |
| Slow support | “Nobody got back to me.” | Response times and reopened tickets |
| Department silos | “I was passed around.” | Handoff points and transfers per case |
| Rough onboarding | “I never figured it out.” | Product usage in the first 60 days |
| Value gap | “It is not worth the price.” | Recent price changes and renewal notes |
| No follow-up | “I told you this last time.” | Share of feedback that gets a reply |
Silos deserve special attention. When customers must repeat their story to three departments, no single team owns the problem, and the score absorbs the damage.
Is your negative NPS score real? Check the data first
Before you act, confirm that the score reflects your customers and not a quirk of the survey. Two checks matter most: whether you have enough responses, and whether anything distorted who answered or when.
How many responses do you need?
NPS carries more sampling error than most teams expect. Margin of error is the range around a result that likely contains the true value. For NPS at 95% confidence, it equals 1.96 × √((p + d − (p − d)²) ÷ n) × 100. Here p is the share of promoters, d is the share of detractors, and n is the number of responses.
The table applies that formula to a score of -10, built from 30% promoters and 40% detractors.
| Responses | Margin of error | Possible true score |
|---|---|---|
| 50 | ±23 points | -33 to +13 |
| 100 | ±16 points | -26 to +6 |
| 200 | ±12 points | -22 to +2 |
| 400 | ±8 points | -18 to -2 |
| 1,000 | ±5 points | -15 to -5 |
Treat any swing smaller than your margin of error as noise, not a trend.
What else can distort the score?
Sampling is only one risk. Check these four before you present the number to leadership.
- Timing: Surveys sent right after an outage or a price change capture the worst mood.
- Response mix: If only angry customers reply, the score understates loyalty. Compare respondents with your customer base by tier, tenure, and region.
- Channel: Retently notes that people tend to answer more positively when a live person asks. Keep the channel constant from one survey to the next.
- Wording: Changing the question or the scale labels breaks comparison with earlier results.
Does a bad NPS score predict churn?
A bad NPS score signals churn risk across your customer base, but it cannot tell you which individual customer will leave. Churn is the rate at which customers stop buying from you. Treat NPS as an early warning, not a forecast.
The link between loyalty and growth holds at the company level. Bain & Company, the firm that created NPS, found that differences in relative NPS (your score compared with direct competitors) explain between 10% and 70% of the variation in later revenue growth, according to Bain’s Net Promoter System research.
For individual accounts, pair each detractor with behavior data such as login frequency, open support tickets, and renewal date. A detractor who renews in 30 days and has stopped logging in needs a call this week. A detractor with steady usage and a distant renewal can wait for the next step in your plan.
Real-world examples of a bad NPS score
These three composite scenarios show how a bad NPS looks in practice. They reflect common patterns, not data from any single company.
- Regional health system, NPS -8: Detractor comments cite long scheduling waits and confusing bills. The fix starts with online scheduling and a plain-language billing statement, then a re-survey of patients who contacted billing.
- Online retailer, NPS +18: The score is positive, yet the Ecommerce & Retail average of 61 shows a wide gap. Late deliveries and hard returns dominate the comments, so the team prioritizes carrier performance and a simpler returns flow.
- B2B software vendor, NPS -5: Executives who bought the product score it well, while daily users score it poorly. Segmenting by role shows the problem sits in the user experience, not in the sales relationship.
How to improve a bad NPS score in 90 days
Recovery works best as a sequence: validate the data, talk to detractors, fix the top causes, then measure again. The plan below fits one quarter. For the full set of tactics, read our guide to improve Net Promoter Score.
- Days 1 to 14, validate and segment.
Confirm your sample size, then split results by customer tier, tenure, and region.
- Days 1 to 30, close the loop.
Contact every detractor within 48 hours and ask one question: what is the main reason for your score? This walkthrough shows how to convert detractors into promoters.
- Days 15 to 45, find the top three themes.
Code the comments, then rank themes by frequency and revenue exposure.
- Days 30 to 75, fix and announce.
Ship the fixes, then tell the customers who raised each issue what changed.
- Days 75 to 90, measure again.
Send the same question to the same segments through the same channel.
How to decide what to fix first
You will find more problems than you can fix in one quarter. Rank each theme on three criteria: how often detractors mention it, how much revenue sits behind those accounts, and how hard the fix is. The figures below are illustrative.
| Theme | Detractors mentioning it | Revenue exposure | Fix effort | Priority |
|---|---|---|---|---|
| Confusing onboarding | 34% | High | Medium | 1 |
| Slow email replies | 22% | Medium | Low | 2 |
| Missing integration | 9% | Low | High | 3 |
Start with themes that are frequent, costly to ignore, and cheap to fix. Run quick wins alongside long projects, so customers see movement early. A rare theme tied to your largest accounts can outrank a common theme among small ones.
How QuestionPro helps you find the reason behind a bad NPS score
A score tells you that customers are unhappy, not why. QuestionPro Customer Experience closes that gap at the moment of rating. Its NPS Plus question, built on AskWhy, combines the 0 to 10 rating, a root-cause choice, and a comment box in one question. You collect the reason with the score instead of chasing it in a second survey.
Once responses arrive, a heatmap compares NPS across touchpoints such as onboarding, support, and billing. That shows where detractors concentrate. Closed-loop follow-up then lets your team reply to unhappy respondents while the issue is still fresh.
How do you measure whether a bad NPS score is recovering?
Recovery shows up in several numbers, not one. Track the metrics below on the same schedule, using the same question and channel each time.
| Metric | How to check | Healthy signal |
|---|---|---|
| NPS trend | Compare with your score from three to six months ago | A gain of 5 to 10 percent, per Retently’s benchmarking guidance |
| Detractor share | Percent of responses from 0 to 6 | Falls each quarter |
| Promoter share | Percent of responses at 9 or 10 | Rises as passives convert |
| Time to first contact | Hours between a detractor response and your first reply | 48 hours or less |
| Response rate | Completed surveys divided by invitations sent | Holds steady or rises |
| Margin of error | Use the formula above | Smaller than the change you report |
A falling response rate deserves attention. It often means customers stopped believing that anyone reads their answers.
Common mistakes when fixing a bad NPS score
Most failed recoveries share a few predictable errors. Avoid these, and your next survey will tell you something real.
- Chasing the number: Coaching staff to ask for 9s distorts the data and hides the problems you need to see.
- Surveying only happy accounts: A flattering sample raises the score without improving the experience.
- Ignoring passives: They are often one small disappointment away from becoming detractors.
- Reacting to one quarter: A dip smaller than your margin of error is noise.
- Comparing across industries: A 30 can be strong in one sector and weak in another.
- Leaving themes without an owner: Assign one named owner to each theme, or nobody fixes it.
A bad NPS score is a starting point, not a verdict
A bad Net Promoter Score is uncomfortable, but it is also useful. It tells you that customers are willing to be honest, and honest customers give you a map. Verify the number, find the three themes behind it, fix them in plain sight, and measure again with the same method.
The goal is not to hide a weak score. The goal is to earn a better one, one resolved complaint at a time.
Frequently Asked Questions (FAQs)
Yes, especially where switching costs are high or competition is thin. A negative score still signals risk, though. Growth that depends on captive customers can reverse quickly once a credible alternative appears, so track detractor share even while revenue climbs.
Yes. In a global study that Retently summarizes, people in the US, Brazil, India, Indonesia, and Mexico typically answered 9 when they liked a company. South Korea and Japan averaged 7 and 6. Compare scores only within one country.
The math is identical: promoters minus detractors on a 0-to-10 scale. The meaning differs because employees recommend a workplace, not a product. Benchmark against employee surveys from your industry and company size, and never compare eNPS with customer NPS.
Remove only responses that are invalid, such as duplicates, test entries, or bots, and write the rule down before you view results. Deleting honest low scores inflates the number, hides real problems, and makes future comparisons unreliable.
Read it cautiously. With 50 responses, each customer moves the score by two points, so one unhappy account can swing the result. Combine the number with every written comment, and call each detractor personally before drawing conclusions.