If you work with data in any capacity, you must be familiar with the four major data types: nominal, ordinal, interval, and ratio. This blog will concentrate on ordinal data. We’ll define, explore the characteristics, and provide examples of this data.
Continue reading to learn everything you need to know about this data, its uses, analysis, and the difference between nominal and ordinal data.
What is ordinal data?
Ordinal data is a statistical type of quantitative data in which variables exist in naturally occurring ordered categories. However, it cannot be used to determine the distance between the two categories.
In statistics, a group of ordinal numbers indicates this data, and a group of this data is represented using an ordinal scale. The main difference between ordinal and nominal data is that ordinal has an order of categories while nominal doesn’t.
Likert Scale is a popular example of this data. For a question such as: “Please express the importance pricing has for you to purchase a product.”, a Likert Scale will have the following options, which are coded to 1, 2, 3, 4, and 5 (numbers). 1 is lesser than 2, which is lesser than 3, which is lesser than 4, which in turn is lesser than 5.
| Very Important | Important | Neutral | Unimportant | Very Unimportant |
| 1 | 2 | 3 | 4 | 5 |
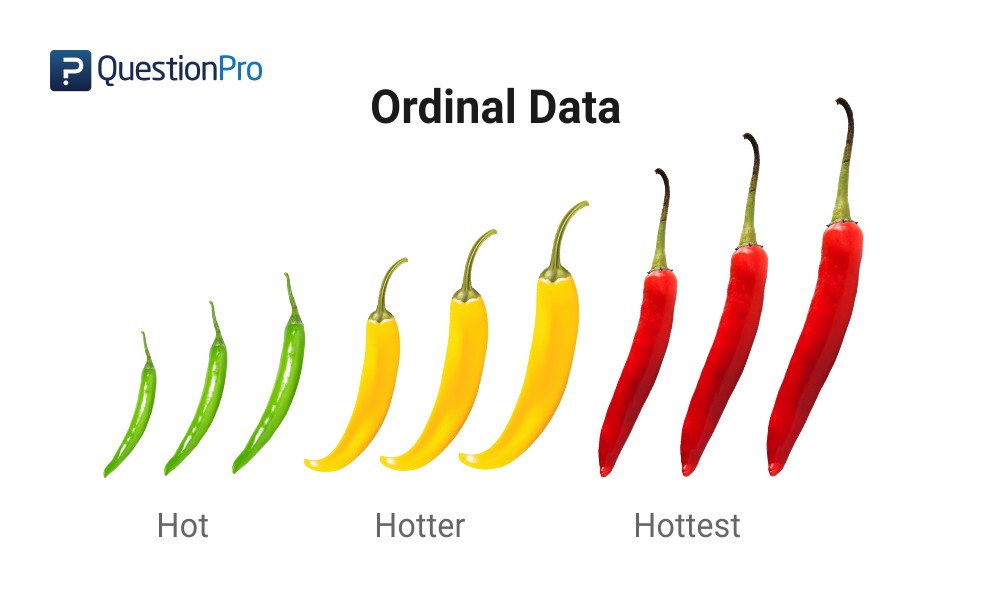
Ordinal data is thus a collection of ordinal variables, i.e., if you have variables in a particular order – “low, medium, high,” they can be represented as this kind of data. There are two important factors to consider for this data:
- Multiple terms represent “order,” such as “High, Higher, Highest,” or “Satisfied, Dissatisfied, Extremely Dissatisfied.”
- The difference between variables is not uniform.
Learn more: Types of Measurement Variables
Uses of ordinal data
This data is an important type of data in many fields and has a wide range of uses in research and practice. Here, we will discuss some key uses of this data:
Surveys/Questionnaires
It is used for surveys and questionnaires due to its “ordered” nature. Statistical analysis is used to collect responses to categorize the respondents based on their responses. In statistical analysis, distinguishing between categorical data and numerical data is essential, as categorical data involves distinct categories or labels, while numerical data consists of measurable quantities.
The insights of this analysis are used to make inferences and draw conclusions about the respondents in relation to specific variables. It is commonly used for this due to its ease of categorization and collation.
Research
Researchers use this type of data to collect useful information about the subject of their research. Medical researchers, for example, will need to collect data when investigating the side effects of a medication given to 50 patients.
Following the administration of the medication, each patient may be asked to complete a form indicating the extent to which they experience some potential side effects.
Customer service
This data is used by businesses to improve overall customer service. When customers use a service or buy a product from a company, they are often asked to fill out a form about their experience. It will assist businesses in improving their customer service.
Job applications
Employers will occasionally use a Likert scale when collecting information from job applicants during the application process. For example, when an applicant is applying for a position as a social media manager, a Likert scale may be used to determine how familiar an applicant is with Facebook, Twitter, LinkedIn, and so on.
Characteristics of Ordinal Data
Ordinal data is one of the four main levels of measurement in statistics, and it has several distinct characteristics that allow it to be differentiated. Below we list 5 of the main ones so that you can recognize them and get an idea of how or when to use them.
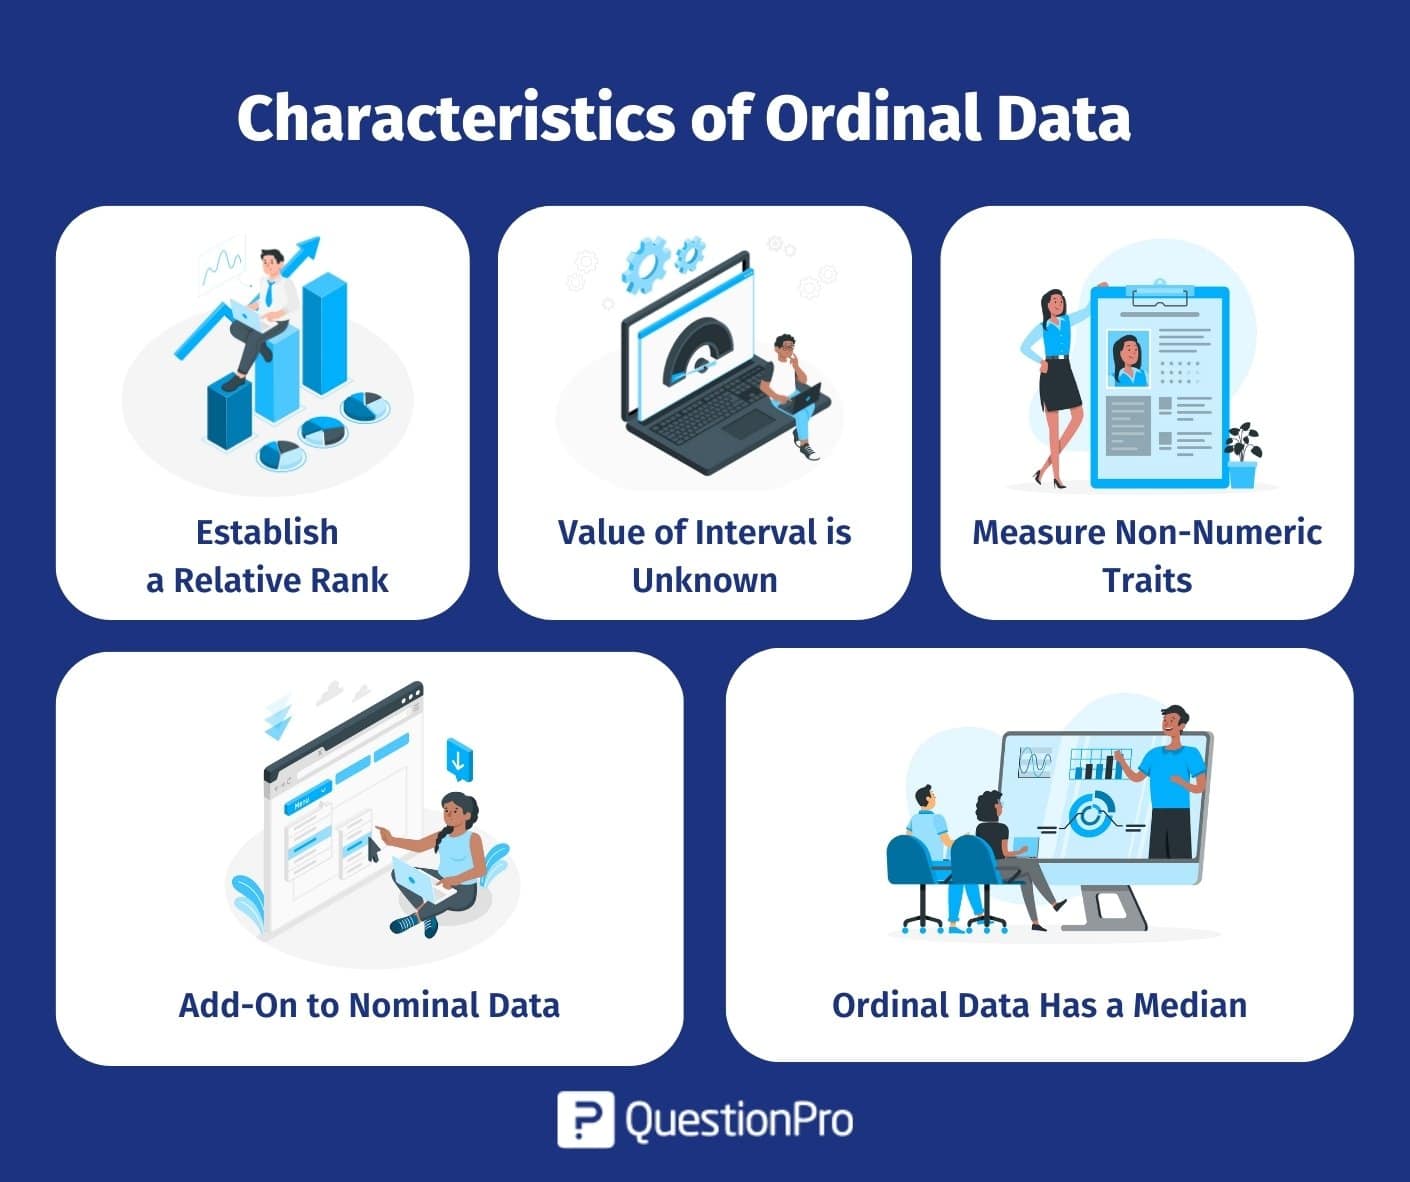
- Establish a relative rank: In the above-mentioned example, Somewhat pleasant is definitely worse than very pleasant, or very unpleasant is worse than somewhat unpleasant. There is clearly a rank within the options – indicating this type of data.
- Value of interval is unknown: The variation between pleasant and pleasant may not be the same as the difference between somewhat unpleasant and very unpleasant. You can not include this interval using this data.
- Measure non-numeric traits: All of the answer options in the previous example are non-numeric, and this data can use to capture feelings such as satisfaction, happiness, frequency, and so on.
- Add-on to nominal data: Nominal data is “labeled” data. It is labeled data in a specific order. In the above mention sample, there is a notable order in the options, which makes it a classic case of this kind of data.
- Ordinal data has a median: The median is the value in the middle of a scale that is not the middle value, and it can calculate with data that has an inherent order.
Statistical Analysis of Ordinal Data
This data analysis is a statistical analysis plan for analyzing data with a natural order or ranking. This type of data is frequently gathered through surveys or questionnaires. Let’s explore how you can analyze your ordinal data:
Easy methods of Ordinal Data analysis
This data is presented in a tabular format to make analysis easier for the researcher. Mosaic plots also establish the relationship between nominal and ordinal data.
For instance, if an organization intends to analyze the number of employees in each hierarchy to make a systematic hiring process for the upcoming year – they can put this data in an ordered tabular format. HR executives will find this data extremely easy to refer to and analyze for any future updates.
Mann-Whitney U test
The Mann-Whitney U test is used to compare two ordinal data groups. This test allows a researcher to conclude that a variable from one sample is greater or lesser than another variable randomly selected from another sample.
For example, psychological researchers can study behavior patterns to compare two different medicines.
Kruskal–Wallis H test
To compare more than two groups of this data, the Kruskal–Wallis H test should be used – In this test, there is no assumption that the data comes from a particular source. This test concludes whether the median of two or more groups is varied. It will show the difference between more than two groups of this data.
For example, a researcher intends to evaluate the impact of stress at work on the quality of work. In that case, the independent variable will be stress at work which ideally will have three stages: no stress, too much stress, and handleable stress, and the quality of work will vary from poor to excellent.
Examples of Ordinal Data
It is a type of categorical data where the categories have a natural order or ranking. Here are some examples of this type of data:
- In a school with 3000 students, there are various categories – freshmen, sophomores, juniors, and seniors. After the term begins, this is the count of each category :
- 1000 – Freshmen
- 800 – Sophomores
- 750 – Juniors
- 450 – Seniors
- An organization conducts a quarterly employee satisfaction survey highlighting this question: “How happy are you with your manager and peers?”
- Extremely Happy – 1
- Happy – 2
- Neural – 3
- Unhappy – 4
- Extremely Unhappy – 5
- According to your preferences, please rate these 5 best-selling books:
- Fire and Fury – 1
- A Higher Loyalty: Truth, Lies, and Leadership – 2
- The Woman in the Window – 3
- The Great Alone – 4
- The Subtle Art of Not Giving a F*ck: A Counterintuitive Approach to Living a Good Life – 5
Are you interested in learning about Average Order Value? Explore to learn more about it by clicking on the topic.
Difference Between Ordinal Data and Nominal Data
Data can be classified into various types in statistics based on their characteristics and properties. Ordinal data and nominal data are two examples of such data.
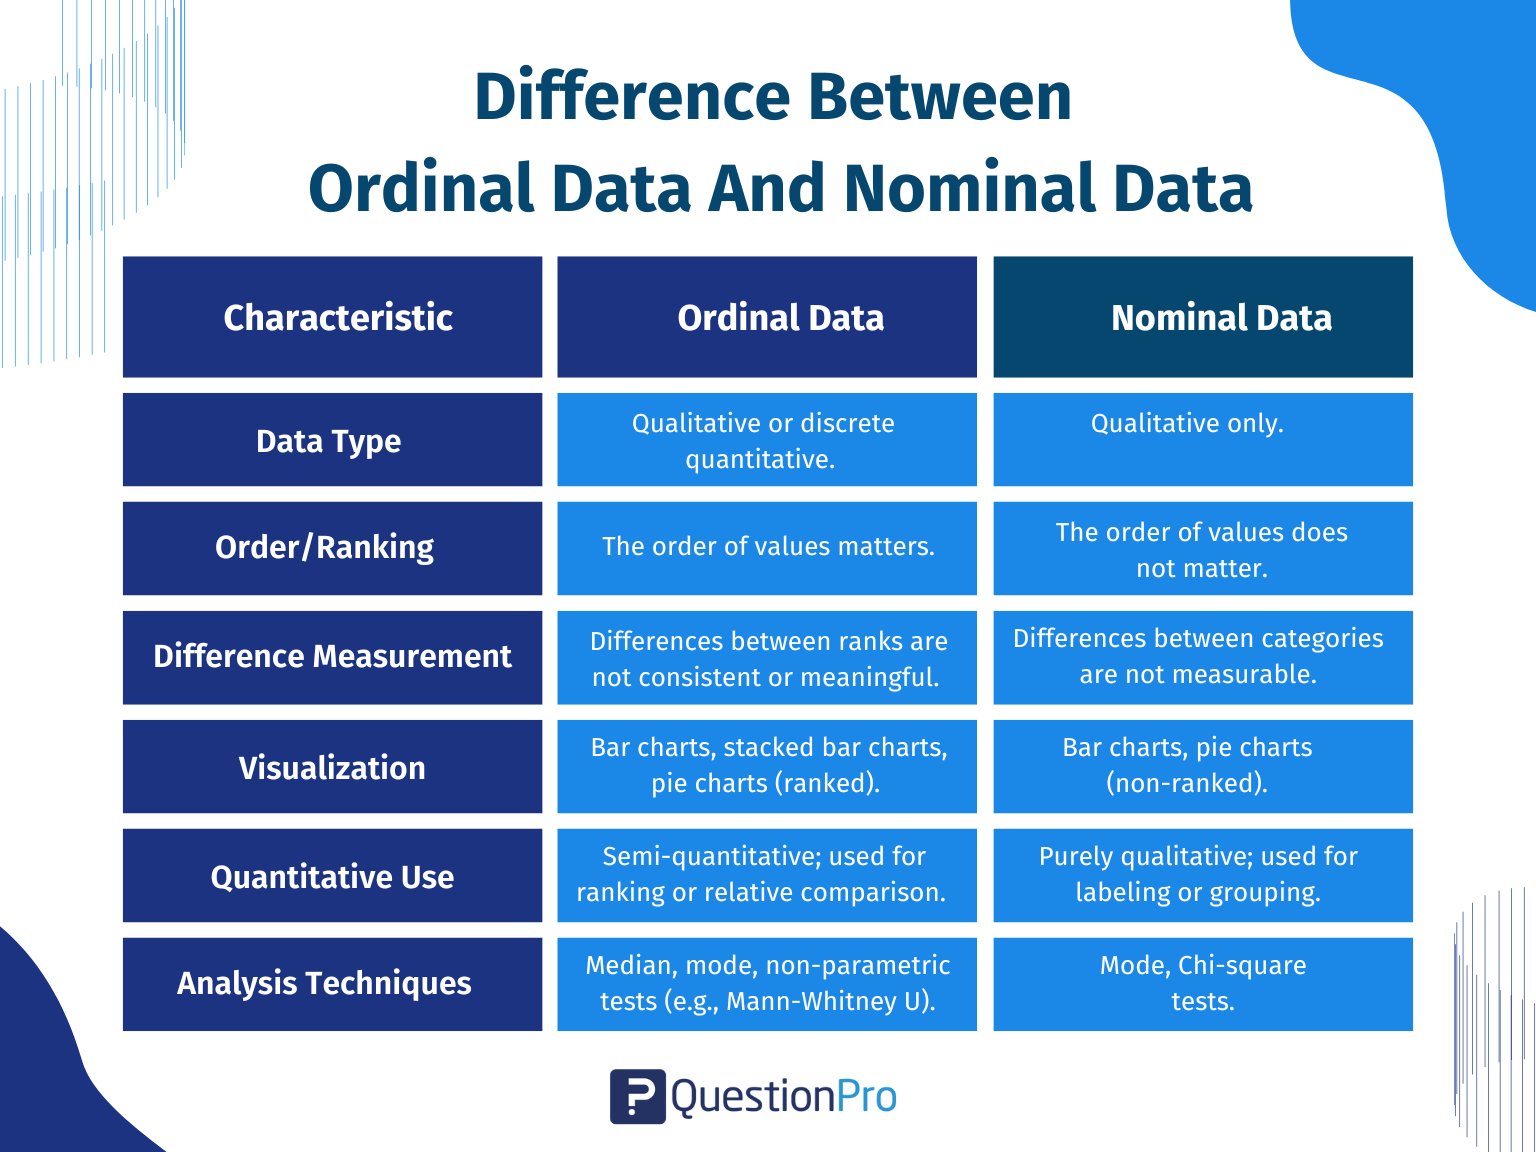
Understanding the difference between ordinal and nominal data is important in many statistical analyses because it determines which analysis methods to use. Here, we will learn some key differences between these two types of data:
- Nominal data is data that is categorized without any particular order or ranking. For example, hair color, gender, and types of cars are all examples of nominal data. Ordinal data, on the other hand, is a type of data that has a natural ordering or ranking. It is categorical data that can be ranked or ordered in accordance with a specific attribute or characteristic.
Examples of ordinal data are the level of education, the range of income, or the grades. - You can count, classify, and categorize nominal data but cannot rank it. On the other hand, ordinal data can rank or order, but the distinction between each category is not always noticeable or measurable.
- Nominal data use pie charts. On the other hand, Ordinal data use a histogram or bar chart.
Here is a table with more notable differences between these two types of data.
Learn more about the differences between: Nominal vs Ordinal scale
How can QuestionPro help with managing ordinal data?
QuestionPro is a survey software platform that provides some features and tools to assist researchers and analysts in dealing with various types of data, including ordinal data. QuestionPro can help with this data in a variety of ways. Here are a few examples:
- Designing surveys: You can quickly create questions appropriate for collecting data using QuestionPro’s survey design interface. You can use rating scales, Likert scales, and other types of ordinal response scales to create questions.
- Data collection: There are many ways to gather data with QuestionPro, including online surveys, surveys for mobile devices, surveys for kiosks, and surveys on paper. You can select the best method suited to your specific research needs.
- Data analysis: QuestionPro has a set of powerful tools for analyzing data that are made just for this data. For example, the software can compute the median, mode, range, quartiles, and other descriptive statistics. You can also generate graphs and charts suitable for visualizing this data, such as box plots, histograms, and scatterplots.
- Reporting: QuestionPro provides various reporting options to help you communicate your insights after you have collected and analyzed your data. Reports can be generated in various formats, including PDF, Excel, and Word, and they can be customized to include only the data relevant to your research.
QuestionPro is a powerful tool for working with ordinal data, and it can help you collect, analyze, and report your data efficiently and effectively.