NPS root cause analysis connects a Net Promoter Score (NPS), the 0 to 10 rating of how likely a customer is to recommend you, to a documented reason. Most companies treat NPS as a number to watch. A dropping score raises a flag, but a flag never explains why a customer is unhappy or about to leave.
Root cause analysis closes that gap. Paired with a structured follow-up question such as AskWhy, a flat rating becomes an early warning system for revenue at risk.
In this guide, we’ll cover what NPS root cause analysis is, how it differs from churn risk, a six-step process, the methods that surface causes, and the mistakes that hide them.
What is NPS root cause analysis?
NPS root cause analysis is the process of identifying the specific reason behind a customer’s NPS rating instead of tracking the score alone. NPS shows how likely someone is to recommend you. It never says what drove that answer.
The analysis adds two layers:
- A follow-up question. It captures the “why” at the moment of feedback.
- A grouping method. It sorts those reasons into themes a team can act on.
For a subscription business, the result might be that most detractor comments point to onboarding delays, not pricing. That finding changes what the retention team does next. Without it, the team could spend months adjusting prices while the real driver goes untouched.
Most programs sort reasons into a handful of buckets, such as product quality, pricing, support, onboarding, and reliability. Keep the list short. A category system with too many options becomes as hard to use as a wall of unsorted comments.
How is an NPS score different from churn risk and root cause?
An NPS score, a root cause, and a churn risk score measure three different things, even though teams often use the terms interchangeably. Defining each one first prevents the most common mistake in a customer experience program. For where a related metric fits, see this comparison of NPS vs CSAT.
| Term | What it measures | What it misses |
|---|---|---|
| NPS score | Overall loyalty and likely word of mouth | The reason behind the score |
| Root cause | The specific driver behind a rating | Whether that driver predicts churn |
| Churn risk score | The probability a customer leaves soon | Why the customer is at risk |
| NPS follow-up question | The raw reason a customer gives | Patterns across many customers |
| Five Whys | The chain of causes behind one incident | Scale across a whole dataset |
Used together, these move a team from knowing something is wrong to knowing what to fix.
Why does a score alone fail to explain churn?
A single NPS number hides the reasons behind it, and the same score can come from very different experiences. That is why a flat or falling score rarely points to a fix.
- Two customers, one rating. One detractor dislikes price. Another is blocked by a broken integration. Both submit a 4.
- Averages blur segments. A healthy overall score can hide a failing region or onboarding cohort.
- Passives stay quiet. Customers rating 7 or 8 rarely complain, yet they leave when a competitor offers more.
Acting on this pays off. Forrester’s 2024 US Customer Experience Index reports that customer-obsessed firms grew revenue 41 percent faster and profit 49 percent faster than other firms, and kept customers 51 percent better. Knowing the specific reason customers are unhappy is where that discipline starts.
How does AskWhy uncover churn drivers?
A generic open text box after an NPS question rarely gives a usable answer, because every customer describes a problem differently. AskWhy, a question type in the QuestionPro Customer Experience platform, structures that follow-up so responses can be counted over time.
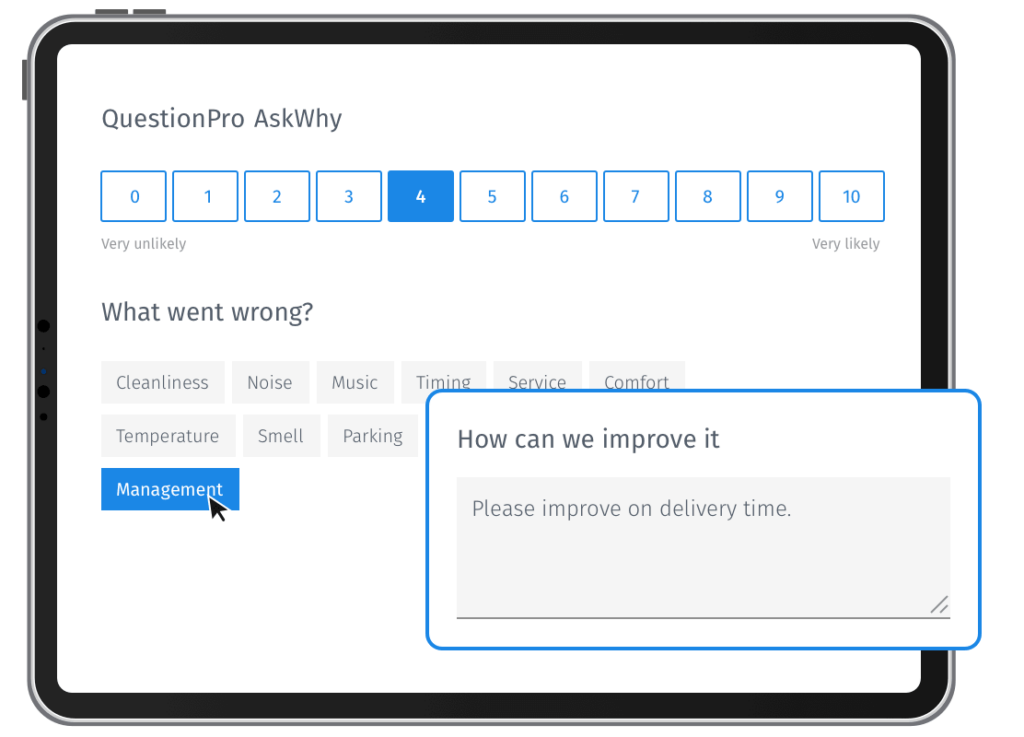
It combines three question types in one:
- NPS rating. Customers answer the standard 0 to 10 question.
- Root cause. They pick the reasons behind the rating.
- Comment and votes. They add an open comment and can vote for feedback from other customers. They can also spread 5 points across aspects to show urgency.
QuestionPro runs sentiment analysis on the open text and shows distribution charts for each aspect. Because the cause and the comment arrive in one response, a team can filter to “detractors who cited reliability” instead of reading every comment. The same data can show which passives are at risk of churn. It runs inside survey software you can send by email, link or in-app.
Step-by-step guide to NPS root cause analysis
Turning a single analysis into a repeatable process takes six deliberate steps. Most teams can set this up without launching a new survey program.
- Add a structured follow-up. Ask “What is the main reason for your score?” with a short list of causes, not an open field alone.
- Segment responses. Split promoters, passives, and detractors. Detractors carry the most urgency, but passives churn with less warning.
- Tag and group causes. Sort reasons into categories such as pricing, product, support, and onboarding.
- Cross-reference account data. Match causes against usage, tickets, and renewal dates. Use the Five Whys on single cases.
- Quantify each theme. Count how often it appears and how strongly it links to low scores.
- Close the loop and act. Route detractor cases to an owner and feed common causes into the roadmap.
Repeat the cycle every survey wave. A fixed weekly or biweekly review catches trends that a quarterly business review would surface weeks too late.
Which follow-up questions work best for each segment?
The best root cause question changes with the score. Each group tells you something different, so each needs its own prompt. For more wording options, see this guide to NPS follow-up questions.
Detractors (0 to 6)
Ask for the main reason, then offer a short list of likely causes plus a comment box. The list makes data easy to count. The comment catches causes you did not expect.
- Question: “What is the main reason for your score?”
- Options: delivery, price, product quality, support, other
Passives (7 to 8)
Ask what would move them to a 9 or 10. Passives often name one missing feature or one friction point, and those answers are cheap to act on.
Promoters (9 to 10)
Ask what they would miss most if the product disappeared. Promoter causes show what to protect while you fix everything else.
- Question: “What do you value most about us?”
How do you analyze NPS root cause data?
Four methods cover most needs, and they work best together. Choose by feedback volume and by the question you are asking.
Theme tagging and text analytics
Tagging sorts open-ended comments into themes. Text analytics software does it automatically.
- Under a few hundred comments: manual tagging works.
- Beyond that: automation saves weeks.
Driver analysis
Driver analysis uses correlation or regression to show which factors move the score most. If delivery speed links more strongly to NPS than packaging, delivery goes first. It works best when respondents also rate several experience attributes.
The Five Whys for single cases
The Five Whys is a technique that repeats the question “why” until a symptom traces back to its real cause. It began in Toyota’s manufacturing practice, as this overview of the five whys explains. Use it on one escalated detractor, not on a whole dataset.
- Start with the complaint: “My renewal call felt pointless.”
- Ask why until you reach a process you can change, such as a missed onboarding milestone.
Correlation versus causation check
A theme that appears often is not always the cause of a low score. Compare customers who mention it with those who do not, then check whether churn or repeat purchase differs between the two groups.
How does NPS+ predict customers likely to churn?
NPS+ is QuestionPro’s extended NPS format that adds root cause questions to the rating. NPS+ pairs the score with reasons so you can see churn drivers, not just churn.
The predictive churn approach works in three moves:
- Isolate. Customers choose one to three reasons from a preset list, which surfaces the top drivers of dissatisfaction.
- Identify. Detractor reasons become the baseline churn drivers.
- Predict. Passives pick from the same list. Those who choose the same reasons as detractors are flagged as likely to churn.
Treat this as a hypothesis to test, not a verdict. QuestionPro’s own example uses illustrative figures, so validate any flagged group against actual renewal data before you change strategy.
Real-world example: From detractor score to a saved account
This example is illustrative, not a real customer. A mid-size software company sees its NPS fall ten points over two quarters. Leadership assumes pricing is the problem.
The team adds a root cause follow-up. A clear pattern appears: most detractors cite slow onboarding, not price or missing features.
Customer success rebuilds the onboarding sequence and contacts accounts flagged as high churn risk. Renewal conversations shift from apologizing for a vague complaint to walking through a specific fix tied to the customer’s own feedback. Detractor volume linked to onboarding then falls, and several at-risk accounts renew.
The lesson is the order of operations. The cause came first, and the fix followed.
How do you prioritize NPS root causes?
Prioritize by weighing how many customers a cause touches against how hard it is to fix. This turns a long list of complaints into an ordered plan.
| Cause profile | Customers affected | Effort to fix | Action |
|---|---|---|---|
| High reach, easy fix | Many | Low | Fix first |
| High reach, hard fix | Many | High | Plan as a project |
| Low reach, easy fix | Few | Low | Fix when convenient |
| Low reach, hard fix | Few | High | Monitor only |
Add revenue at risk when you can. A cause that touches fewer customers but your largest accounts may outrank a common one.
How do you measure the impact of closing the loop?
Root cause analysis proves its value only when a fix changes customer behavior. Measure at the cause level, because company-wide NPS moves slowly and is a poor early signal.
- Root cause response rate.
It shows whether enough customers explain their score. Aim for a rate that rises each wave.
- Time to close the loop.
It shows how fast a detractor gets a reply. A common working target is within 48 hours.
- NPS by root cause tag.
It shows whether a fix moved that group. Look for a gain after the fix.
- Retention by segment.
It shows whether churn changed, not only sentiment.
- Sample per theme.
Aim for 30 to 50 responses before trusting a pattern.
These targets are working rules of thumb, not industry standards. A tag that never moves after a fix is a useful finding too. It usually means the diagnosis was wrong, not that the fix failed. Teams use closed-loop feedback workflows to keep that review from stalling.
What mistakes hide the real churn drivers?
A few habits quietly undermine even a well-designed analysis. Check these before assuming the process itself is broken.
- Skipping the follow-up question and treating the score as the whole picture
- Using one open text field with no categories, which makes tagging inconsistent
- Reading detractor comments closely while ignoring passives
- Waiting for a quarterly report instead of routing responses the day they arrive
- Never linking a root cause tag to renewal or usage data, so a pattern stays a guess
- Changing the category list too often, which breaks quarter-over-quarter comparison
The fix for most of these is the same. Decide who owns each theme before the survey goes out. QuestionPro Customer Experience software can assign that routing.
A score is a symptom, not a diagnosis
An NPS score by itself is a symptom. A structured root cause question turns it into information a retention team can use the same week it arrives, not months later.
The businesses that keep churn low are rarely the ones with the highest NPS. They know exactly why a score moved. They close that loop before a promoter drifts into a passive, and before a passive quietly leaves for a competitor.
Frequently Asked Questions (FAQs)
Ask “What is the most important reason for your score?” and attach a short list of causes. Detractors can explain in their own words while you still get a category your team can tag, track, and act on quickly.
A low NPS score shows a customer is unhappy right now. Churn risk is a broader estimate that combines the score with usage data, support history, and renewal timing to judge how likely that customer is to actually leave.
Run it continuously instead of as a one-time project. Review tagged responses every survey wave, weekly for high-volume programs. That cadence helps a team catch a new churn driver before it spreads across accounts.
Yes. Passives rarely leave negative comments, but their loyalty is weaker than that of promoters, and they can switch without warning. Including passives in your analysis, not only detractors, often reveals churn risk a team would otherwise miss.
Yes, but treat results as directional. With fewer than 30 responses per theme, read comments one by one and apply the Five Whys to each case. Pool several months of data before ranking causes or committing budget.