
Data analysis is a crucial part of the research process. You can only claim that your research was successful once you have analyzed the data and prepared a report. Ratio data is one of the four categories of data levels of measurement. Other types include ordinal, interval, and nominal (categorical).
In this blog, we’ll look more closely at the various aspects of this data. If you want to jump to a specific topic, you can use the following clickable content index:
What is Ratio Data?
Ratio Data is defined as quantitative data, having the same properties as interval data, with an equal and definitive ratio between each data and absolute “zero” being treated as a point of origin. In other words, there can be no negative numerical value in ratio data.
For example:
Four people are randomly selected and asked how much money they have with them. Here are the results: $20, $40, $60, and $80.
- Is there an order to this data? Yes, $20 < $40 < $60 < $80.
- Are the differences between the data values meaningful? Sure, the person who has $40 has $20 more than the person with $20.
- Can we calculate ratios based on this data? Yes, because $0 is the absolute minimum amount of money a person could have with them.
- The person with $80 has four times as much as the person with $20.
Ratio data has all properties of interval data, such as – data should have numeric values, a distance between the two points is equal, etc., but, unlike interval data where zero is arbitrary, in ratio data, zero is absolute.
An excellent example can be the measurement of heights. Height could be measured in centimeters, meters, inches, or feet. It is not possible to have a negative height. For example, when comparing to interval data, the temperature can be – 10 degrees Celsius, but height cannot be negative, as stated above.
It can be multiplied and divided, and this is one of the significant differences between ratio and interval data, which can only be added and subtracted. Here, the difference between 1 and 2 is the same as the difference between 3 and 4, but also, 4 is twice as much as 2. This comparison is impossible in interval data.
Characteristics of Ratio Data
Ratio data is characterized by other data kinds by their unique qualities. The characteristics of data obtained using a ratio scale can be summed up as follows:
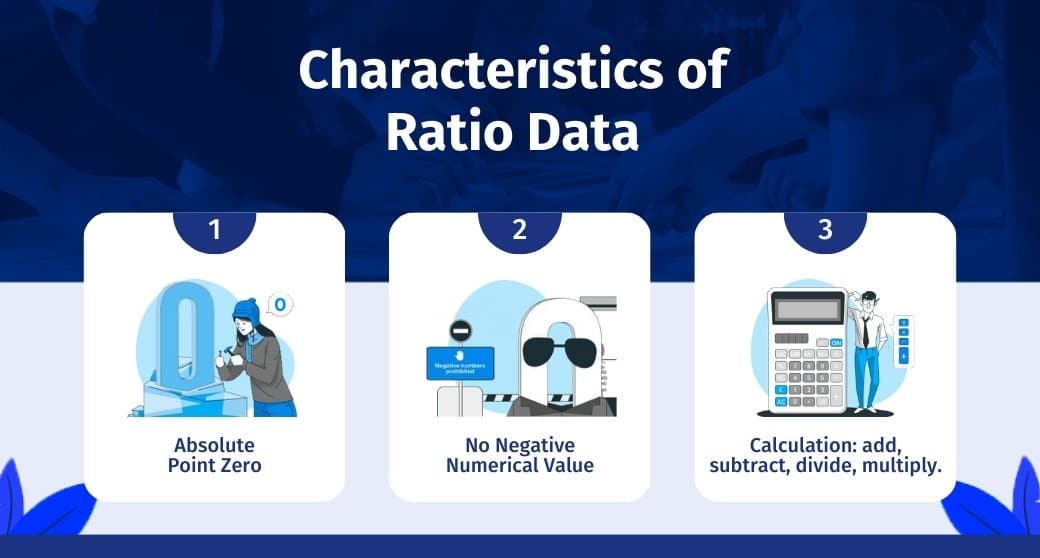
- Absolute Point Zero: It is measured on a ratio scale. One of the distinctive characteristics is the true absolute zero point, which makes the data relevant and meaningful in a manner where it is right to say, “one object is twice as long as the other,” or 4 has twice the value as 2.
- No Negative Numerical Value: It has no negative numerical value. For a value to be a ratio data researcher, one must first evaluate if it meets all the criteria of interval data and has an absolute zero point. For example, weight cannot be negative; -20 Kg doesn’t exist.
- Calculation: Data values can be added, subtracted, divided, and multiplied. A unique statistical analysis is possible for this data. Chi-square can be calculated using a ratio scale. Mean, mode, and median can also be calculated for this kind of data. In statistical analysis, distinguishing between categorical data and numerical data is essential, as categorical data involves distinct categories or labels, while numerical data consists of measurable quantities.
LEARN ABOUT: Statistical Analysis Methods
Ways to Calculate Ratio Data
It may be calculated using a variety of approaches according to its equidistant and meaningful zero attributes. Because of this, it is frequently used and appreciated in the field of market research.
The data collected on the ratio scale can be calculated in four ways. These four methods are:
- Grouping: You may determine whether or not the same or different ratio variables by comparing them.
- Sorting: You can evaluate the variables’ degrees of influence. It is also possible to calculate if one value exceeds or falls short of another.
- Difference: You can multiply or divide the ratio variables.
- Magnitude: Depending on your research, you can derive the ratio variables by multiplying and dividing them.
Imagine weighing a tennis ball and a cricket ball to discover whether or not the former is heavier and by how much. This is a simple way to depict this kind of data.
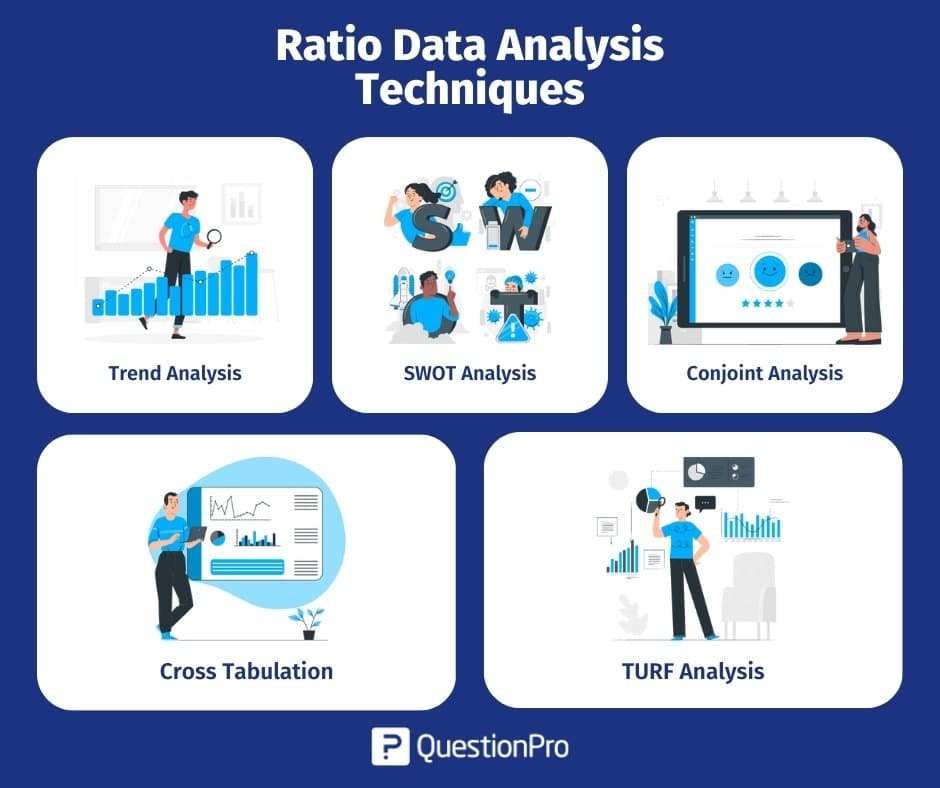
Ratio Data Analysis Techniques
Ratio data, alongside the 3 other variable measurement scales, is fundamentally a quantitative data-capturing method. This means all types of statistical analysis techniques can be applied. Below are some of the popular analysis techniques:
-
Trend analysis
Trend analysis is a popular analysis technique used to draw trends and insights by capturing survey data over a certain period of time. In other words, trend analysis is conducted by capturing data using a ratio scale survey in multiple iterations, using the same question. Trend analysis also plays a critical role in predictive analysis, where a set of time-bound data is compared and analyzed for predicting future trends.
-
SWOT Analysis
Analysis conducted to evaluate an organization’s strengths, weaknesses, opportunities, and threats is called SWOT analysis and is widely used to evaluate ratio data. Strengths and weaknesses are internal aspects of an organization, while opportunities and threats are external to an organization. An organization can measure this kind of data to evaluate market competition as well as plan future marketing activities using the SWOT analysis results.
LEARN ABOUT: Level of Analysis
-
Conjoint Analysis
Conjoint Analysis is an advanced-level market research technique usually implemented to analyze how individuals make complicated decisions on a ratio scale. It helps find important factors for customers before they make decisions when they have multiple options available at their disposal. Marketers can test their websites, conduct price research, or improve product features using conjoint analysis.
-
Cross Tabulation
Cross-tabulation, in statistics, is a method to understand the relationship between multiple variables. The contingency table, also known as a crosstab, is used to establish a correlation between multiple ratio data variables in a tabular format. Informed decisions can be taken after analyzing the data from a contingency table. Market researchers usually analyze customer intent and product performance using cross-tabulation as they provide a comparison between two or more variables.
-
TURF Analysis
TURF analysis stands for Totally Unduplicated Reach and Frequency analysis- a method that allows a marketer to analyze the potential of market research for a combination of products and services. It evaluates the ratio data of customers reached by a particular source of communication and its frequency. This unit of analysis technique is used by researchers to understand whether a new product or service will be well-received in the target market or not. This analysis method was used mainly for designing media campaigns but has expanded to being used in product distribution and line analysis.
Difference Between Ratio Data and Interval Data
Quantitative data includes both ratio and interval data (numerical data). The main difference between the interval and ratio scales is that only ratio data have a true zero, whereas interval data do not. Both have an equal distance between consecutive values, so you can add and subtract from them.
As a result, Interval data cannot be split or multiplied while ratio can, which means that Interval data cannot accept negative values.
The measurement levels are yet another significant distinction between interval and ratio scales. The size and magnitude of a defined unit can be measured using an interval scale in many ways. On the other hand, the ratio scale can quantify size and magnitude as a ratio of one defined unit to another.
To effectively express data, every statistician must clearly understand the differences between the two scales.
Examples of Ratio Data in Survey
Following are the most commonly used examples that can be used in surveys:
What is your weight in kgs?
- Less than 50 kg
- 51-60 kg
- 61-70 kg
- 71-80 kg
- 81-90 kg
- Above 90 Kg
What is your height in feet and inches?
- Less than 5 feet.
- 5 feet 1 inch – 5 feet 5 inches
- 5 feet 6 inches- 6 feet
- More than 6 feet
What is the number of burgers you can eat daily?
- 1-2
- 2-3
- 3-4
- 4-5
- 5-6
- More than 6
Conclusion
Ratio data is especially useful for understanding trends and patterns. By comparing the links between various data, we may better understand anything from corporate performance to customer behavior.
While conducting surveys and research, you must become familiar with the various data types. Understanding the various data types can guide your decision-making around the types of questions to ask and the methods to use while analyzing the data.
But when dealing with big datasets, data analysis can be time-consuming and difficult. The survey software QuestionPro can help with that. With the help of cutting-edge reporting capabilities, our software facilitates the collection and analysis of data and enables you to identify trends and patterns easily.
LEARN ABOUT: Average Order Value
Therefore, think about giving QuestionPro a try right away if you’re trying to take advantage of data in your business. With our robust software and knowledgeable support staff, you’ll be well on your way to improving decisions and achieving success.