Customer insights analysis turns scattered feedback, a five-star rating here, a two-line complaint there, into a clear picture of what customers value and where a product or service falls short. It combines survey responses, behavioral data, and direct comments into patterns a team can actually act on.
Most businesses collect plenty of feedback. Far fewer turn it into decisions. The gap between the two is analysis: sorting signal from noise, connecting a score to the reason behind it, and pointing a team toward the next right move.
This blog covers what customer insights analysis involves. It explains how the practice differs from raw customer insights and market research, the metrics worth tracking, and a step-by-step process for turning your own feedback data into action.
What is customer insights analysis?
Customer insights analysis is the process of interpreting customer feedback, behavior, and interaction data to understand why customers think, feel, and act the way they do. That understanding then guides business decisions, going beyond a satisfaction score to explain the story behind the number.
Raw customer insights are the individual pieces of information: a survey response, a support ticket, a click pattern. Customer insights analysis is what happens next. It groups those pieces, spots the patterns across them, and translates a pattern into a specific action, like redesigning a checkout step or updating a feature.
In short, customer insights analysis turns:
- Individual feedback into patterns
- Patterns into a specific business decision
Customer Insights vs. Market Research vs. Consumer Research
These three terms get used interchangeably, but they answer different questions.
| Term | What it answers | Example |
|---|---|---|
| Customer insights | What an individual customer thinks, feels, or needs right now | A customer says your checkout process is confusing |
| Customer insights analysis | Why a pattern exists across many customers, and what to do about it | 30% of negative reviews mention checkout, so the team redesigns the flow |
| Market research | What an entire market or industry needs, independent of any single customer relationship | A study on whether demand exists for a new product category |
| Consumer research | How and why people make purchase decisions, often before they become customers at all | A study on what drives someone to choose one running shoe brand over another |
For a closer look at how research categories differ, see QuestionPro’s guide to market research vs. marketing research.
What you can achieve with customer insights analysis
Customer insights analysis does more than describe your customers. It gives you a foundation for decisions that would otherwise rely on guesswork, and it applies whether the goal is retention, growth, or a better product roadmap.
A deeper understanding of your customers
Analysis reveals patterns a single conversation never would. It can show you:
- What motivates customers to buy or leave
- Which features or services they actually care about
- How different customer segments behave differently
That knowledge lets you design experiences that resonate instead of guessing what might.
Faster, more confident decisions
With clear patterns in hand, teams stop debating opinions and start acting on evidence, whether that means launching a product, adjusting a marketing message, or retraining a support team.
Personalized customer experiences
Understanding unique needs across segments lets a business tailor its outreach instead of sending the same message to everyone. In practice, that looks like:
- Targeted recommendations based on past purchases
- Promotions customized for specific audience groups
- Content that matches individual interests rather than a generic average
Higher retention and loyalty
Customers who see a company act on their feedback trust that company more. Acting on insights is what turns a one-time buyer into a repeat customer, and repeat customers are measurably more valuable than new ones, as the retention metric below shows.
Stronger growth and innovation
Recurring complaints and unmet needs often point directly at the next product opportunity. Common growth signals include:
- A feature request that shows up across unrelated customer segments
- A complaint that keeps resurfacing despite small fixes
- A competitor gap customers mention without being asked
Spotting those gaps before a competitor does is one of the most underused benefits of a consistent insights practice.
How to turn customer feedback into insights: Step-by-step
Analyzing customer insights sounds technical, but a simple, repeatable process makes it straightforward.
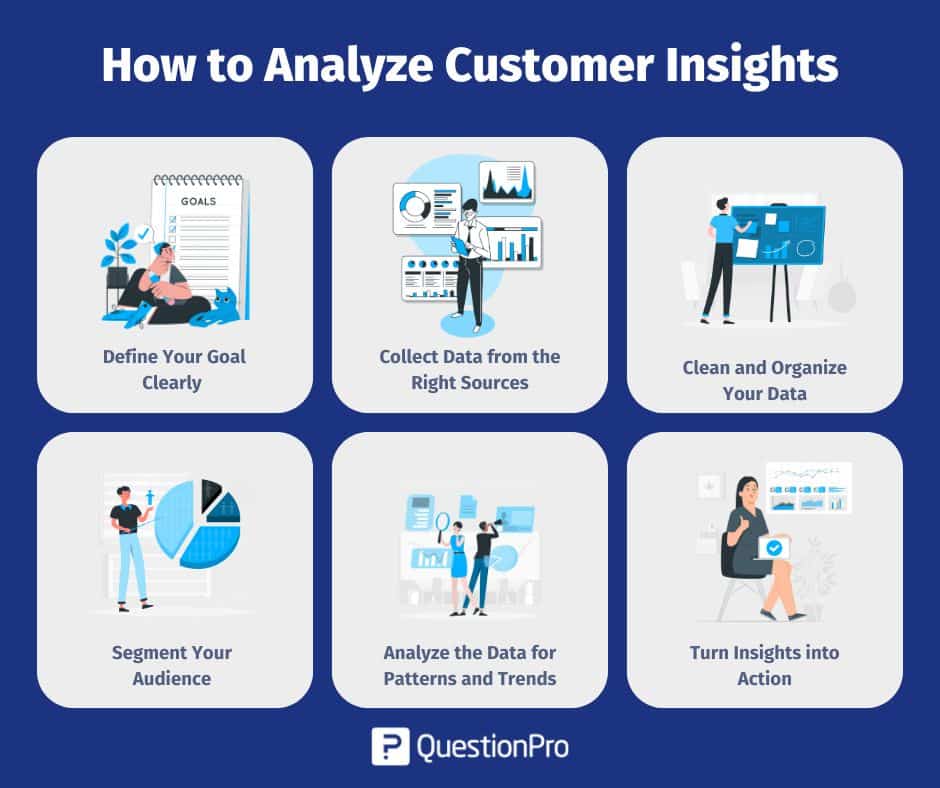
Step 1: Define your goal clearly
Before launching any survey, decide what you want to learn. A goal might be to:
- Measure satisfaction after a product launch
- Understand why customers stop using a service
- Test reactions to a new feature or pricing plan
A clear goal keeps every question focused and every answer useful later.
Step 2: Collect data from the right channels
Gather feedback from the channels where customers actually interact with a business. Common sources include post-purchase and post-call surveys, email, live chat and support tickets, social media, app and website behavior, SMS, and point-of-sale data. Mapping these touchpoints against a customer journey makes it easier to see where feedback is missing and where it is overwhelming.
Step 3: Clean and organize your data
Before analysis starts, a quick cleanup pass saves hours later:
- Remove duplicate or incomplete responses
- Flag irrelevant or spam entries
- Tag each remaining response positive, neutral, or negative
Standardized survey software keeps this step manageable by keeping responses comparable across every channel used in Step 2.
Step 4: Segment your audience
Customers are not one group. Useful ways to segment include:
- Demographics, such as age, location, or industry
- Purchase behavior, such as first-time versus repeat buyers
- Satisfaction level, such as promoters versus detractors
Segmenting first prevents a blended average score from hiding what is really going on.
Step 5: Analyze for patterns and trends
Look for repeated words, common ratings, and themes that keep resurfacing. If a fifth of the responses mention slow delivery, that is a signal, not a coincidence. Visual tools like charts and word clouds make patterns easier to spot and to share with a team.
Step 6: Turn insights into action
An insight that never reaches a decision is not yet useful. The final step has three parts:
- Assign the fix to a specific owner
- Set a timeline for the change
- Follow up with customers once it ships
Teams that visibly close the loop see higher response rates on the next survey.
Key metrics to track in customer insights analysis
The right metrics show not just how customers feel, but where to focus next.
Customer satisfaction (csat)
CSAT measures satisfaction with a specific product, service, or interaction. It is typically collected on:
- A 1-to-5 scale
- A 1-to-10 scale
Either way, it gives an immediate read on whether a specific touchpoint is meeting expectations.
Net promoter score (nps)
NPS measures overall loyalty by asking how likely a customer is to recommend a business, on a 0-to-10 scale. Based on that score, respondents fall into one of three groups:
- Promoters, who rate 9 or 10
- Passives, who rate 7 or 8
- Detractors, who rate 0 through 6
Customer retention rate
Retention rate tracks the percentage of customers who keep doing business with a company over a set period. Research from Bain & Company’s Frederick Reichheld, discussed in Harvard Business Review, found that a 5% increase in retention can raise profits by 25% to 95%. That makes retention one of the most consequential numbers a business can move.
Customer lifetime value (clv)
CLV estimates the total revenue a customer generates over the full relationship with a business. It typically factors in:
- Average purchase value
- Purchase frequency
- Average customer lifespan
That total helps prioritize which retention efforts are worth the investment and which acquisition channels bring in customers worth keeping.
Churn rate
Churn rate is the percentage of customers who stop doing business with a company in a given period. A rising churn rate is an early warning sign, and tracking it alongside CSAT and NPS usually reveals which specific experience is driving the drop-off.
Common mistakes in customer insights analysis
Most failed insights programs share a small set of avoidable mistakes.
- Collecting feedback without a clear goal.
Surveys that try to measure everything usually clarify nothing.
- Reading scores without the comments behind them.
A CSAT of 3 out of 5 means something different for a shipping delay than for a rude support call.
- Treating all customers as one segment.
A blended average can hide the fact that loyal customers and at-risk customers are reporting the same score for opposite reasons.
- Stopping at the report.
Insights that never reach a decision-maker rarely turn into a fix, no matter how well the report is designed.
- Waiting too long to close the loop.
Customers who gave feedback months ago have usually assumed it was ignored, which makes them less likely to respond next time.
Example: How customer insights analysis drove real change
An online clothing retailer noticed a dip in repeat customers and sent a satisfaction survey to find out why. Two patterns stood out:
- Customers loved the product quality but found checkout too slow
- Several mentioned frustration over limited payment options
With that pattern in hand, the team streamlined the checkout flow and added PayPal and mobile payment options. A follow-up survey a month later showed a measurable rise in repeat purchases and more positive comments about checkout specifically. The fix worked because the analysis pointed at one concrete problem instead of a vague goal to “improve the experience.”
How QuestionPro supports customer insights analysis
Turning raw feedback into insight takes more than a single survey tool. QuestionPro’s Customer Experience platform covers the full loop described throughout this article:
- Building targeted surveys and running the CSAT and NPS questions covered above
- Segmenting responses by demographic or behavior without exporting data to a separate tool
- Real-time dashboards that surface patterns as responses come in, so a spike in negative checkout feedback shows up the same day rather than at the end of a quarterly report
- Cross-tabulation that breaks results down by customer segment, and trend tracking that shows whether last quarter’s fix actually moved the needle
Make customer insights analysis an ongoing habit
Customer insights analysis is not a one-time project. Customer needs shift, new competitors enter, and last year’s fix eventually stops being enough.
Businesses that revisit their metrics on a regular schedule, and that keep closing the loop with customers, catch problems while they are still small and spot opportunities before competitors do. The businesses that get the most from customer feedback are rarely the ones with the fanciest dashboard. They are the ones that consistently connect a pattern in the data to a specific decision, then check whether that decision actually worked.
Frequently Asked Questions (FAQs)
Customer insights are individual pieces of feedback, like one survey response or comment. Customer insights analysis is the process of grouping those pieces across many customers to find a pattern, then turning that pattern into a specific business decision or fix.
Most businesses review core metrics like CSAT and NPS monthly and run a deeper analysis quarterly, after a launch, or following a major process change. Continuous channels like support tickets are worth scanning weekly so problems surface before they scale.
At minimum, a way to collect structured feedback, like survey software, and a way to organize and segment responses. Many businesses start with a survey platform and a spreadsheet, then move to dedicated analytics tools as feedback volume grows.
Group responses by theme and customer segment, then look for patterns that repeat across multiple respondents rather than single outliers. Once a pattern is clear, assign it to a specific team with a deadline. Insights become actionable only when someone owns the fix.
There is no universal number. For a 95% confidence level with a 5% margin of error, QuestionPro’s sample size calculator puts the figure at roughly 385 responses for a large customer base, with smaller, well-defined segments needing fewer.