In statistical analysis, the level of measurement of variables is crucial since it influences the type of analysis possible. Nominal data provide the smallest amount of detail, while interval and ratio data provide the highest level of detail; these differences reflect the differences between the four primary levels of measurement (nominal, ordinal, interval, and ratio).
LEARN ABOUT: Level of Analysis
To have an understanding of the fundamentals of nominal data, this is the place to be. In this blog, we’ll go over the basics of this data analysis, including what it is, how to identify it, and some examples.
What is Nominal Data?
Nominal data is “labeled” or “named” data which can be divided into various groups that do not overlap. Data is not measured or evaluated in this case; it is just assigned to multiple groups. These groups are unique and have no common elements.
The order of the data collected can’t be established using nominal data; thus, if you change the order of data, the significance of the data will not be altered.
In Latin nomenclature, “Nomen” means – Name. Nominal data does present a similarity between the various items, but details regarding this similarity might not be disclosed. This is merely to make the data collection and analysis process easier for researchers. In some cases, it is also called “Categorical Data.”
If binary data represents “two-valued” data, this data represents “multi-valued” data, and it can’t be quantitative. It is considered to be discrete. For example, a dog can be a Labrador or not.
Learn about: Nominal Scale
Characteristics of Nominal Data
Let’s discuss the characteristics of nominal data using this question:
- Q. What is your ethnicity?
- Central Asian
- Indonesian
- West Asian
- Japanese
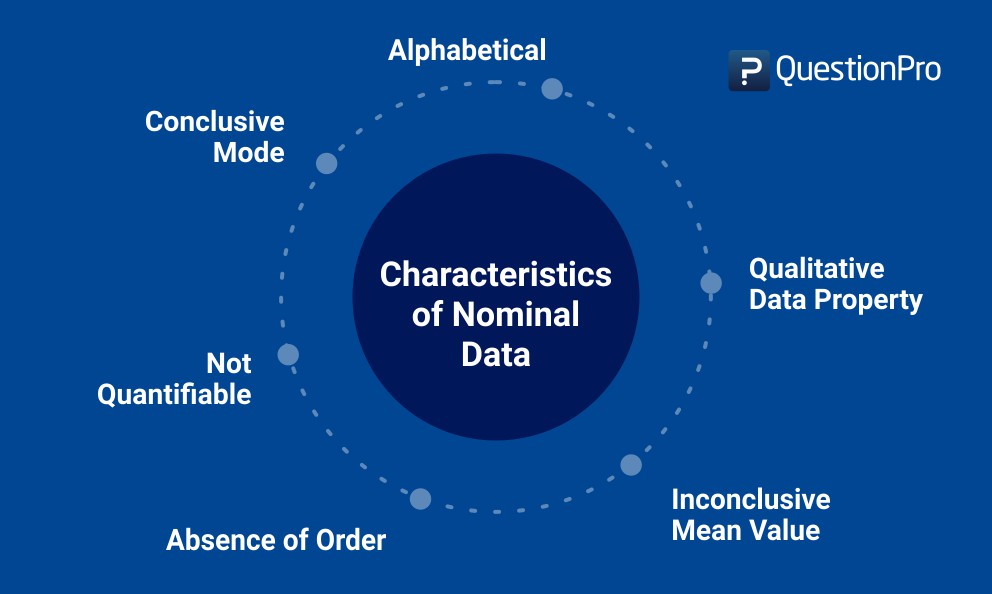
Now, its main characteristics are:
- Nominal data can never be quantified: It will always be in the form of nomenclature, i.e., a survey sent to Asian countries may include a question such as the one mentioned in this case.
Here, statistical, logical, or numerical analysis of data is not possible, i.e., a researcher can’t add, subtract or multiply the collected data or conclude that variable 1 is greater than variable 2. - Absence of order: Unlike ordinal data, nominal data can also never be assigned a definite order. In the above example, the order of answer options is irrelevant to the answers provided by the respondent.
- Qualitative property: Collected data will always have a qualitative property – answer options are highly likely to be qualitative in nature.
- Can’t calculate Mean: The mean of it can’t be established even if the data is arranged in alphabetical order. In the above-mentioned example, it is impossible for a researcher to calculate the mean of responses submitted for ethnicities because of the qualitative nature of options.
- Conclude a Mode: Asking a large sample of individuals to submit their preferences – the most common answer will be the mode. In the provided example, if Japanese is the answer submitted by a larger section of a sample, it will be the mode.
- Data is mostly alphabetical: In most cases, nominal data is alphabetical and not numerical – for example, in the mentioned case. Non-numerical data also can be categorized into various groups.
Learn more: Quantitative Data
Nominal Data Analysis
Most nominal data is collected via questions that provide the respondent with a list of items to choose from, for example:
- Q1. Which state do you live in? ____ (followed by a drop-down list of states)
- Q2. Which of the following items do you normally choose for your pizza toppings? (Select all that apply)
- Spinach
- Pepperoni
- Olives
- Sardines
- Sausage
- Extra cheese
- Onions
- Tomatoes
- Other (please specify) _______________
There are three ways that nominal data can be collected. In the first example, the respondent is given space to write in their home state. This is an open-ended question that will eventually be coded with each state being assigned a number. This information could also be provided to the respondent in the form of a list, where they would select one option.
The second example is in the form of multiple response questions where each category is coded 1 (if selected) and 0 if not selected. It also incorporates an open-end component allowing the respondent the option of writing in a category not included in the list. These ‘Other (please specify)’ responses’ will need coding if they are to be analyzed.
Nominal data is analyzed using percentages and the ‘mode,’ which represents the most common response(s). For a given question, there can be more than one modal response, for example, if olives and sausage were both selected the same number of times.
Multiple response questions, e.g., the pizza topping example listed above, allow researchers the ability to create a metric variable that can be used for additional analysis. In this scenario, the respondent can select any or all options providing you with a variable that ranges from zero (none selected) to the maximum number of categories. This becomes a useful tool for consumer behavioral segmentation.
Learn more: Market segmentation

Descriptive Statistics
The distribution of the data can be determined using descriptive statistics. We can use two descriptive statistics methods for this data:
- Frequency distribution table: This is designed to organize nominal data in some order. This kind of table makes it easy to see how many responses there were for each category in the variable.
- Central tendency: This is commonly known as a mode. It serves as a measure of where the majority of values are. However, only one mode can be estimated for this data because it is only qualitative.
LEARN ABOUT: Descriptive Analysis
Graphical Analysis
The graphical analysis involves presenting the entire data in a visual format. Like descriptive statistics, visualizing your data helps you see what it is telling more easily. These methods can be used on the complete data set in the table and a sample taken from it.
- Bar Chart: The frequency of each response is graphically represented as a bar rising vertically from the horizontal axis in a bar chart, which is mostly utilized. Each bar’s height is inversely correlated with the frequency of the relevant answer.
- Pie Chart: The percentage frequency of each sample of the nominal dataset can be represented by a pie chart, which is also used.
The researcher typically uses a pie chart to represent percentages (or fractions), while a bar chart is typically used to represent distribution frequencies (mode).
Categorization of Nominal Data
Nominal data requires categorization based on similarities and differences to be properly analyzed. In this method, researchers can compare their research findings by matching them to a similar collection of data that has not been investigated.
- Matched Category: Samples from the same nominal data variable set are grouped together in the matched category. Improved statistical results are the primary goal of matching, which is accomplished by reducing the influence of confounding factors.
- Unmatched Category: Unmatched samples contain variables that are unconnected to one another. It’s a random selection from several different datasets with no commonalities.
Statistical Tests
Statistical tests allow you to test a hypothesis by delving deeper into the information that the data is revealing, whereas descriptive statistics, graphical analysis, and categorization only summarize the nominal data for straightforward analysis. In statistical analysis, distinguishing between categorical data and numerical data is essential, as categorical data involves distinct categories or labels, while numerical data consists of measurable quantities.
For nominal and ordinal data, non-parametric statistical tests are used. Therefore, you may do the popular Chi-square test when examining a nominal dataset:
- Chi-square goodness of fit test: This test determines if the sample of data is typical of the entire population of data. The test is applied when information is gathered via random sampling from a single population.
- Chi-square independence test: This examines the relationship between two nominal variables. Testing hypotheses enables determining the independence of two nominal variables from a single sample.
Nominal Data Examples
In each of the below-mentioned examples, there are labels associated with each of the answer options only for the purpose of labeling. For instance, in the first question, each dog breed is assigned numbers, while in the second question, both genders are assigned corresponding initials solely for convenience.
- Q1. In the U.S., there is a huge section of people who love and own dogs. For a firm dealing with taking care of dogs while the owners are away, a question such as this can be useful to filter their target market: What is the most loved breed of dogs?
- Dalmatian – 1
- Doberman – 2
- Labrador – 3
- German Shepherd – 4
- Q2. For a travel agency looking to launch a travel plan purely for a sample of individuals, this is the most basic question: Who loves to travel more?
- Men – M
- Women – W
- Q3. A real estate agent based out of New York will be highly inclined to understand the answer to this question: Which type of houses are preferred by the residents of New York City?
- Apartments – A
- Bungalows – B
- Villas – C
Learn about: Types of Variable Measurement Scales
Using QuestionPro Research Suite for Nominal Data Collection and Analysis
QuestionPro Research Suite is a platform for surveys and research that may be used to examine nominal data. The platform provides numerous features and tools for data analysis, such as:
- Question Types: Question types, including single-select, multiple-select, and open-ended questions, are available in QuestionPro and can be used to gather nominal data.
- Data Collection: QuestionPro offers a variety of data collection options, including internet surveys, email invitations, and mobile surveys.
- Data Visualization: The platform offers interactive data visualization choices like pie charts and bar graphs.
- Data Analysis: The built-in data examination module in QuestionPro offers descriptive statistics for the analysis of nominal data, including frequency and percentage distribution.
- Segmentation: The platform has segmentation features that let users divide nominal data into groups based on various demographic, behavioral, or psychographic segmentations traits.
- Reports: QuestionPro offers customizable reports for summarizing and sharing findings with decision-makers.
Use QuestionPro Research Suite to collect and analyze nominal data to learn about your audience. Our platform lets you create and distribute online demographic surveys to collect age, gender, education, occupation, and more. Our data visualization tools and data analysis module will help you immediately interpret the results.
LEARN ABOUT: Average Order Value
Take this chance to improve your research skills and accomplish your objectives. Start your nominal data analysis journey right away with a free trial!