



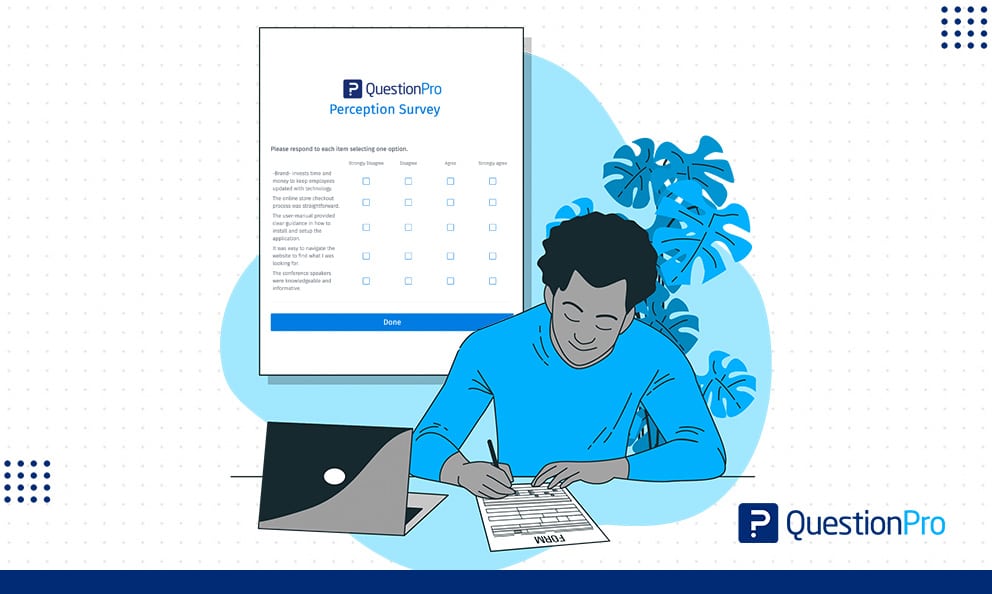
A perception survey measures what people actually believe about a brand, product, workplace, or organization. It shows what leaders assume, then checks that against reality. Customers, employees, students, and patients all form opinions before anyone asks a formal question. Those opinions shape buying decisions, retention, and trust. Because perception rarely matches intention, organizations that skip this step often fix the wrong problem.
In this article, we’ll cover the five main types of perception surveys and the question formats that work best for each. We also cover how perception surveys differ from satisfaction surveys and sentiment analysis. You’ll find a ready-to-use template with sample questions, a decision guide for picking the right survey type, and the mistakes that quietly wreck perception data.
What is a perception survey?
A perception survey is a structured research tool. It finds out how a specific audience thinks and feels about a brand, product, workplace, or organization. Researchers run it with customers, employees, students, patients, or the general public, depending on what they need to learn. Every question is built around the respondent’s own experience and impressions, not objective facts.
A perception survey can take several forms:
- A single question, like a one-item Net Promoter Score check
- A full questionnaire with 15 to 20 items
- An online form, paper questionnaire, phone interview, or in-person conversation
The choice of format usually comes down to the audience, the timeline, and the budget for the project. What separates a perception survey from a generic feedback form is intent. Every question exists to surface a belief, association, or feeling, not just rate a single transaction.
Perception survey vs. Satisfaction survey vs. Sentiment analysis
These three terms get used interchangeably, but they measure different things. Mixing them up leads teams to draw the wrong conclusion from the right data.
| Aspect | Perception survey | Satisfaction survey | Sentiment analysis |
|---|---|---|---|
| What it measures | Beliefs, associations, and overall impressions | Fulfillment with a specific interaction or transaction | Emotional tone extracted from existing text or speech |
| Typical trigger | Ongoing brand, culture, or product tracking | Right after a purchase, support call, or service visit | Reviews, social posts, open-ended survey answers |
| Data source | Direct survey questions to a defined audience | Direct survey questions tied to one experience | Existing unstructured text, analyzed after the fact |
| Example question | “What comes to mind when you think of our brand?” | “How satisfied were you with today’s delivery?” | No question asked; tone is scored automatically |
A perception survey and a satisfaction survey can live in the same questionnaire. But they answer different questions. One asks how people feel about the whole entity. The other asks how they felt about one moment with it.
Types of perception surveys
Most organizations run one or more of five common perception survey types. Each one targets a different relationship or stakeholder group:
- Brand image and market positioning
- The customer relationship across every touchpoint
- Internal workplace culture and trust
- How a product performs against expectations
- Physical and psychological safety at work
01. Brand perception survey
A brand perception survey finds out what comes to mind when someone hears a company’s name, sees its logo, or reads its tagline. It asks respondents to describe associations rather than rate features. Open-ended and word-association questions work best here.
An athletic apparel company that wants to be seen as energetic and performance-driven can ask respondents what they picture when they see its logo. The team then compares those answers against the brand identity it’s trying to build. Recurring themes, reassuring or worrying, show exactly where perception and intention have drifted apart. This type of survey typically covers:
- Top-of-mind associations with the brand name and logo
- Trust and credibility compared to competitors
QuestionPro’s brand awareness survey template offers a starting point for this kind of study.
02. Customer perception survey
A customer perception survey asks what people think about the products, services, and organization behind them. It can span customer service, product design, delivery speed, and ease of use. Perception forms across every touchpoint, not just the sale.
Expectations shape perception as much as reality does. Two customers can have the same experience and rate it completely differently, based on what they expected going in. A retailer running this survey after a slow shipping period will typically see scores drop, even among customers whose orders arrived on time. Expectations shifted for the whole customer base. Pairing this with QuestionPro’s customer satisfaction survey templates gives a fuller picture of both the transaction and the relationship behind it.
03. Culture perception survey
A culture perception survey gathers employee opinions on whether the workplace feels open, fair, trustworthy, and psychologically safe. Some organizations extend this outward. They ask people outside the company, or even tourists in the case of a national tourism board, what they believe about a culture they’ve only observed from a distance.
Trust is the variable that moves everything else in this category. Gallup’s 2026 State of the Global Workplace report found that only 20% of employees worldwide were engaged in 2025. That decline cost the world economy an estimated $10 trillion in lost productivity. A culture perception survey is one of the few tools that can catch a trust or engagement slide before it shows up in turnover numbers.
- Trust in leadership and management follow-through
- Sense of fairness in recognition and promotion decisions
- Comfort raising concerns without fear of retaliation
04. Product perception survey
A product perception survey compares what customers expected a product to do against what they actually experienced. The gap between assumption and reality is the useful data point here, not the raw satisfaction score.
A software company launching a “one-click” setup feature might find that users rated the actual setup a 6 out of 10. Marketing had promised near-instant results. That six-point gap is more actionable than the raw score alone. It points directly at the marketing claim that needs adjusting. QuestionPro’s product survey templates include several formats built for this kind of expectation-versus-reality comparison.
05. Health and safety perception survey
A health and safety perception survey asks staff whether they consider the workplace physically and psychologically safe. It covers everything from equipment hazards to emergency preparedness. Schools and universities also run versions of this survey to understand whether students feel safe on campus.
This category tends to reveal a communication gap more than a policy gap. SHRM data found that roughly 1 in 7 Americans do not feel safe at work. That figure keeps safety perception surveys relevant well beyond high-hazard industries like construction and manufacturing. QuestionPro’s employee safety survey template covers both physical hazards and less visible psychological safety factors.
- How confident staff feel reporting a hazard without repercussions
- Whether emergency drills happen often enough to feel routine
- How seriously staff believe leadership takes safety concerns
Common question types used in perception surveys
Perception surveys draw on five recurring question formats. Most well-built questionnaires mix at least two or three to balance depth with completion time.
- Multiple choice questions let respondents pick one or more preset options. The survey administrator has full control over how answers get grouped and analyzed.
- Graphical questions, including star ratings, thumbs up/down, sliders, and smiley-face scales, work well for quick emotional reactions. They keep long surveys from feeling repetitive.
- Ordering questions, such as rank-order or drag-and-drop formats, reveal the relative importance a respondent places on a set of options.
- Matrix questions arrange several related statements as rows against a shared answer scale in the columns. This saves space and keeps related questions visually grouped.
- Open-ended questions collect free-text answers when a fixed list of choices would flatten a nuanced opinion. They’re the richest source for spotting language and themes a closed question would miss.
Example perception survey template with sample questions
The questions below work as a starting framework for any of the five perception survey types. Swap in the relevant subject for each bracketed placeholder.
- Open with a broad impression question.
“What do you think of our [brand/organization]?” This open-ended starter surfaces the respondent’s own language before any preset options can shape their answer.
- Add a scaled expectations question.
“On a scale of 1-10, how well have we met your expectations?” This gives a trackable number for comparing survey to survey.
- Ask a word-association question.
“What comes to mind when you think of our [brand/tagline/logo]?” Best left open-ended so themes emerge naturally.
- Probe the emotional response.
“How would you describe your feelings about our [product/service/organization]?” A numeric scale alone would miss this.
- Ask about the lived experience.
“How was your experience using our [product or service]?”
- Include a loyalty indicator.
“On a scale of 1-10, how likely are you to recommend us to a friend or colleague?” This is the standard Net Promoter Score question. QuestionPro’s NPS survey template builds an entire questionnaire around it.
- Close with an open floor.
“Do you have any other feedback or suggestions?” This catches anything the structured questions didn’t ask.
How to choose the right type of perception survey
The right survey type depends on which relationship you’re trying to understand. It isn’t about which template is easiest to launch first.
| Goal | Best survey type | What to focus on |
|---|---|---|
| Understand market positioning | Brand perception survey | Logo, tagline, and top-of-mind associations |
| Improve service or product delivery | Customer perception survey | Support quality, ease of use, delivery experience |
| Assess workplace trust and morale | Culture perception survey | Fairness, communication, psychological safety |
| Validate a product promise | Product perception survey | Expectation versus actual experience |
| Reduce workplace risk | Health and safety perception survey | Hazard awareness, reporting comfort, drill frequency |
Many organizations run more than one type on a rotating schedule instead of picking just one. Brand, customer, and culture perception can drift independently of each other.
How to measure and analyze perception survey results
A perception survey only becomes useful once you have a large enough sample. You also need a consistent way to score the answers over time.
For sample size, most researchers treat 100 respondents as the practical floor for a small, defined population. For a population of 10,000 or more, aim for 385 respondents to keep the margin of error near 5%. Larger, ongoing brand or culture tracking studies often use samples in the 500 to 1,000 range. This keeps small shifts in perception from getting lost in statistical noise.
Once responses are in, a few consistent metrics make comparison possible over time:
- Average scaled score across your 1-10 or Likert-scale questions, tracked survey over survey rather than in isolation
- Net Promoter Score, calculated by subtracting the percentage of detractors (0-6 ratings) from promoters (9-10 ratings)
- Theme frequency in open-ended answers, grouping recurring words or phrases so loud comments don’t get mistaken for a trend
Run the same core questions on a consistent schedule, such as quarterly or twice a year. That way, movement in the numbers reflects a real shift, not just a change in who happened to respond.
Common mistakes to avoid in perception surveys
Perception data loses value fast when the survey itself introduces bias or gets treated as a one-time checkbox.
- Leading questions.
Asking “How much do you love our new packaging?” assumes a positive answer and skews the data before anyone responds.
- Relying on a single question.
One NPS score can flag a problem, but it can’t explain the “why” without an open-ended follow-up.
- Skipping a baseline.
Without an earlier survey to compare against, a single perception score has no context.
- Ignoring open-text answers.
Numeric averages hide the specific frustrations or praise sitting inside the comments.
- Running it once and shelving it.
Perception shifts with every product launch, PR moment, or leadership change. A survey run once loses relevance within a year.
Creating a perception survey with QuestionPro
Building a perception survey usually means combining several question types into one flow. Skip logic keeps that flow from feeling repetitive for the respondent.
QuestionPro’s survey logic lets a low expectations score automatically trigger a follow-up open-ended question. A high score skips straight to the recommendation question instead. Each respondent only sees questions relevant to what they’ve already told you. That same logic applies across brand, culture, product, and safety perception surveys, since the underlying need is identical: tailor the next question to the last answer.
For teams building a broader research program around this kind of tracking, QuestionPro’s research software supports the full cycle from questionnaire design through longitudinal analysis.
Turning perception survey data into action
A perception survey is only as useful as the decision it changes. The real payoff comes from comparing results against a baseline. It also comes from sharing themes with the team that can act on them, and repeating the study often enough to catch a shift before it becomes a crisis.
- Set a repeat schedule before you launch the first survey, not after you see the results.
- Share open-ended themes with the team closest to the problem, not just leadership.
- Compare every new wave against the last one, not against an assumed ideal score.
Frequently Asked Questions (FAQs)
Most perception surveys work best between 7 and 15 questions. Shorter surveys raise completion rates, but a survey that’s too brief risks missing the “why” behind a score. Balance length against how much nuance the topic actually needs.
Yes, especially for culture and health and safety perception surveys. Respondents are far more likely to share honest concerns about leadership or hazards when their name isn’t attached to the answer.
Quarterly works well for fast-moving areas like customer or product perception. Culture and brand perception surveys are often run twice a year, since those beliefs shift more slowly and need a bigger gap to show real change.
Online perception surveys in the US typically see response rates between 10% and 30%, depending on the audience and incentive offered. Internal employee surveys usually land at the higher end, since existing trust in the organization drives participation.
Yes, though it’s best kept to two closely related types, such as brand and customer perception. Stacking unrelated categories, like safety and brand, into a single flow tends to confuse respondents and dilute the data for both.



