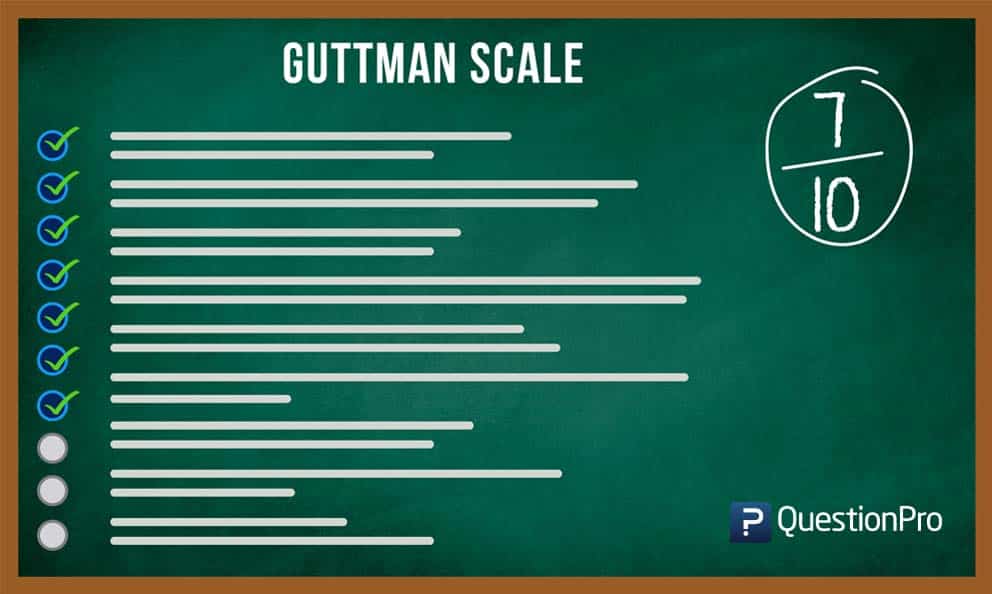
Guttman Scale Definition
Guttman scale is one of the three unidimensional scales, the other two being – Likert Scale and Thurstone Scale. Guttman scale also called cumulative scaling or scalogram analysis is created with elements that can possibly be ordered in a hierarchical manner. It is representative of the extreme “attitude” of respondents, i.e. extremely positive or negative, about the subject in-hand.
This scale is used by researchers in situations where a unidimensional scale for a continuum of opinions is required. “Uni”-dimensional scale indicates that the answer options have only one measurement parameter, i.e., a range of numbers can be associated with the scale. For instance, “On a scale of 0-10, how satisfied are you with the service of this airline?” – can be indicated with unidimensional answer options.
Guttman scale has a list of statements. It can be inferred that respondents who agree to the statement placed at the end of this list, would have agreed to all the other statements above the last one. Each statement will have a corresponding weight associated with it. The cumulation of the weight according to respondent feedback will help researchers in predicting the number of statements agreeable to the respondents. For example, on a 5 scale Guttman scale, if a respondent scores 3 – it indicates that he/she has agreed to the first 3 statements of the scale if a different respondent scores 5 – it indicates that he/she has agreed to all the statements on this cumulative scale.
The main goal of this scale is to filter those respondents who comply with 100% of the statements mentioned in the scale. But, practically it is highly improbable that respondents totally comply with a series of statements and thus, scalogram analysis is conducted to evaluate the closest set of statements that the target audience agrees with. Bogardus scale is a populat example of the Guttman scale.
Learn more: Likert Scale Examples
Guttman Scale Characteristics
- Unidimensional in nature: Guttman scale has statements in the order of difficulty – from the least difficult to the most difficult and is thus, unidirectional in nature. In a 10-item Guttman scale, if a respondent score 8 – it is indicative of the fact that the respondent agrees with the first 8 statements of the scale and disagrees with the last two statements of the scale.
- Deterministic model: The responses are considered according to the last agreed statement of the scale and are cumulative of the responses. The answers to all the statements can be judged on the basis of this cumulative score due to the deterministic nature of this scale.
- Reproducible questions are added: Guttman scale only has questions which are reproducible, which means that those questions which will not be able to produce desired results will be eliminated from the scale and only those questions which can boost the purpose of scalability will be included.
- Ordinal nature of data: The list of statements is arranged in an ordinal manner, i.e., from the minimum important statement to the maximum important statement.
Learn more: Ordinal Scale
Steps for developing a Guttman Scale with Examples
To explain the process of developing a Guttman scale in detail, we will be considering an example – After the school shootings across the U.S., should laws be designed for the staff and administration to carry guns to school? It has been a raging topic amongst students after the intensity of the shootings has enhanced over the past few years. There are five main steps in the process of developing a Guttman scale.
- Clarify the objective of using Guttman scale: Every scaling method should have a clearly defined objective for effective implementation. In the above-mentioned example, if students wish to calculate a cumulative score of those in support of staff and administration possessing guns in school – this can be their objective for conducting a Guttman scale. In the objective, it needs to be made clear whether all staff members or just some possessing guns will fulfill the purpose.
- Create a list of statements: In order to gain desired insights about designing of laws, those in charge can create a list of statements for the scale or involve specialists so that effective statements can be included in the scale.
-
- I support the prohibition of sales of gun bump stocks.
- I do not support any regulations on gun sales to the civilian population.
- I support the prohibition of gun sales to civilians altogether.
- I support stricter background checks during the process of gun sales.
- I support prohibiting gun sales to mentally ill people.
Guttman scale statements are often expected to be 80-100 in number for reasonable results.
Learn more: Teacher Evaluation Surveys
- Associate values to each of the statements: The experts involved in the process of developing the statements should assign values to each of the statements according to their importance to the topic of laws against school shootings. The experts are expected to answer Yes – if the statement is in favor of laws against school shootings and No- if the statement is not in favor of laws against school shootings. Also, a very critical aspect needs to be addressed at this step – the values assigned should not involve personal opinions of the experts and instead should merely be on the basis of their contribution towards laws for school shootings.
- Structurize the Guttman scale for analysis: Analysis of Guttman scale is the most important step. The answers received for various statements can be represented in a Matrix.
| Respondent | Statement 1 | Statement 2 | Statement 3 | Statement 4 | Statement 5 |
| 5 | Yes | Yes | Yes | Yes | Yes |
| 10 | Yes | Yes | Yes | Yes | – |
| 15 | Yes | Yes | Yes | – | – |
| 16 | Yes | – | – | Yes | – |
| 20 | Yes | Yes | – | – | – |
| 21 | – | – | – | – | – |
In the above-mentioned matrix, in the first row, if someone agrees to statement 5, it indicates that the individual must have agreed to the preceding statements, i.e. – statement 1 to statement 4.
Also, there can be exceptions in the respondent answers but generally, those respondents who agree to statement 4 would have agreed to the statements 1 to statement 3.
In case there is a restrictive list of statements, it is extremely convenient for marketers to analyze data but when a large data is collected, analysis becomes a tough step. In that case, marketers are expected to analyze a subset that is closest to the desired cumulative.
Learn more: Guide to Market Research Surveys
There are various statistical analysis techniques to analyze collected data to form a closest to ideal Guttman scale. This quantitative data also represents the value of each of the items in the scale.
- Administer the Scale: After deciding the various items (statements) of the scale, it is time to administer answers obtained for each of the items. Respondents have to just submit their agreement towards each of the statement.
For the example of laws against school shooting, the order of the statements can be as mentioned below:
- I do not support any regulations on gun sales to civilian population.
- I support stricter background checks during the process of gun sales.
- I support the prohibition of sales of gun bump stocks.
- I support prohibiting gun sales to mentally ill people.
- I support prohibition of gun sales to civilians altogether.
Guttman Scale Applications with Examples
Guttman scale is popular in social scaling applications and also while calculating organizational culture, education or achievement evaluation in general.
Learn more: Supervisor Evaluation
Application 1: Guttman scale is used to evaluate an organization’s hierarchical structure.
By including questions that analyze the employee hierarchy such as:
- I am willing to contribute towards the social causes supported by my organization.
- I am willing to work longer hours to complete the assigned task.
- I am willing to communicate better with my team members.
- I am willing to attend conferences and seminars
Application 2: This cumulative scaling method can also be used to measure a customer journey.
In this case, the below-mentioned questions can be a part of the scale:
- I could easily solve my problem by contacting the customer service team.
- I could get the products delivered to my doorstep.
- I could get in touch with the support team quickly.
- I could look for the required products easily on the company’s website.
- I could make the payment for the products easily.
Learn more: Customer Satisfaction Surveys
Guttman Scale Advantages
- Highly hierarchical and structured in nature: Due to the hierarchical and structured nature of this scale, it can be extremely productive in short surveys and questionnaires. For example, to analyze social distance, employee hierarchy, stages of evolution etc.
- Implemented to gain insights for multiple queries: Guttman scale includes multiple statements for the respondents to answer which occupies a short space in an online survey.
- More intuitive than other uni-dimensional scales: The way in which the answers are represented in this scale makes Guttman scale extremely intuitive for users.
- Produces data in a ranked manner: The statements mentioned in this scale have their degree of importance and values associated accordingly. Thus, the results of this scale are in terms of ranks.
Learn more: Interval Scale