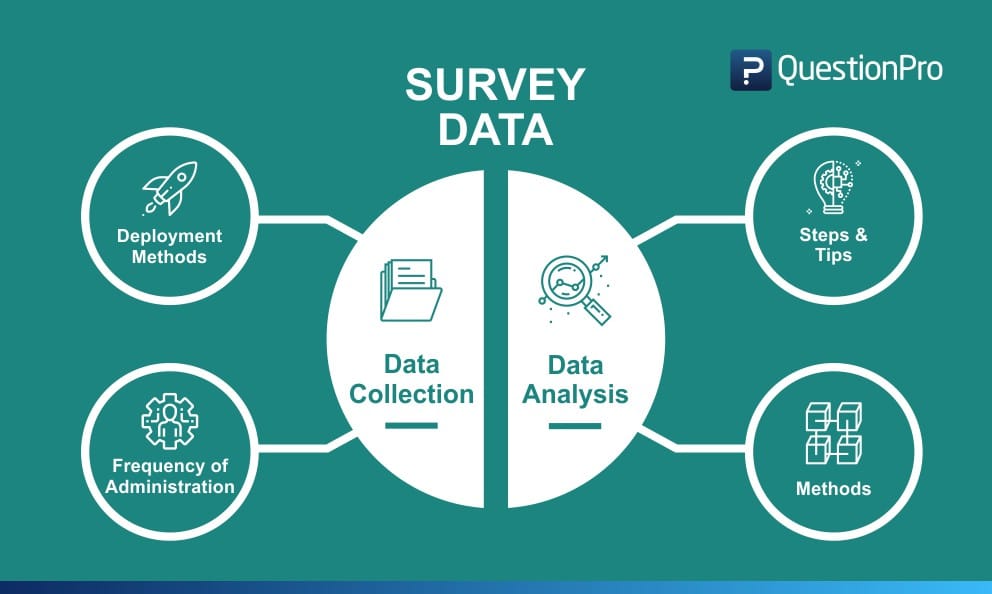
Survey data is defined as the resultant data that is collected from a sample of respondents that took a survey. This data is comprehensive information gathered from a target audience about a specific topic to conduct research. There are many methods used for survey data collection and statistical analysis.
Various mediums are used to collect feedback and opinions from the desired sample of individuals. While conducting survey research, researchers prefer multiple sources to gather data such as online surveys, telephonic surveys, face-to-face surveys, etc. The medium of collecting survey data decides the sample of people that are to be reached out to, to reach the requisite number of survey responses.
LEARN ABOUT: Survey Sample Sizes
What is a Survey Data Collection
Factors of collecting survey data such as how the interviewer will contact the respondent (online or offline), how the information is communicated to the respondents etc. decide the effectiveness of gathered data.
LEARN ABOUT: telephone survey
Survey Data Collection Methods with Examples
The methods used to collect survey data have evolved with the change in technology. From face-to-face surveys, telephonic surveys to now online and email surveys, the world of survey data collection has changed with time. Each survey data collection method has its pros and cons, and every researcher has a preference for gathering accurate information from the target sample.
The survey response rates for each of these data collection methods will differ as their reach and impact are always different. Different ways are chosen according to specific target population characteristics and the intent to examine human nature under various situations.
Types of survey data based on deployment methods:
There are four main survey data collection methods – Telephonic Surveys, Face-to-face Surveys, and Online Surveys.
- Online Surveys
Online surveys are the most cost-effective and can reach the maximum number of people in comparison to the other mediums. The performance of these surveys is much more widespread than the other data collection methods. In situations where there is more than one question to be asked to the target sample, certain researchers prefer conducting online surveys over the traditional face-to-face or telephone surveys.
Online surveys and survey analysis software are effective and therefore require computational logic and branching technologies for exponentially more accurate survey data collection vs any other traditional means of surveying. They are straightforward in their implementation and take a minimum time of the respondents. The investment required for survey data collection using online surveys is also negligible in comparison to the other methods. The results are collected in real-time for researchers to analyze and decide corrective measures.
A very good example of an online survey is a hotel chain using an online survey to collect guest satisfaction metrics after a stay or an event at the property.
Learn more: Quality Of Life Survey Questions + Sample Questionnaire Template
Online surveys are safe and secure to conduct. As there is no in-person interaction or any direct form of communication, they are quite useful in times of global crisis. For instance, many organizations moved to contactless surveys during the pandemic. It helped them ensure that the employees are not experiencing any COVID-19 symptoms before they come to the office.
Learn more: Contactless Health-Screen Survey Questions + Sample Questionnaire Template
- Face-to-face Surveys
Gaining information from respondents via face-to-face mediums is much more effective than the other mediums because respondents usually tend to trust the surveyors and provide honest and clear feedback about the subject in-hand.
Researchers can easily identify whether their respondents are uncomfortable with the asked questions and can be extremely productive in case there are sensitive topics involved in the discussion. This online data collection method demands more cost-investment than in comparison to the other methods. According to the geographic segmentation or psychographic segmentation, researchers must be trained to gain accurate information.
For example, a job evaluation survey is conducted in person between an HR or a manager with the employee. This method works best face-to-face as the data collection can collect as accurate information as possible.
LEARN ABOUT: Workforce Planning Model
- Telephone Surveys
Telephone surveys require much lesser investment than face-to-face surveys. Depending on the required reach, telephone surveys cost as much or a little more than online surveys. Contacting respondents via the telephonic medium requires less effort and manpower than the face-to-face survey medium.
If interviewers are located at the same place, they can cross-check their questions to ensure error-free questions are asked to the target audience. The main drawback of conducting telephone surveys is that establishing a friendly equation with the respondent becomes challenging due to the bridge of the medium. Respondents are also highly likely to choose to remain anonymous in their feedback over the phone as the reliability associated with the researcher can be questioned.
For example, if a retail giant would like to understand purchasing decisions, they can conduct a telephonic, motivation, and buying experience survey to collect data about the entire purchasing experience.
LEARN ABOUT: Anonymous Surveys
- Paper Surveys
The other commonly used survey method is paper surveys. These surveys can be used where laptops, computers, and tablets cannot go, and hence they use the age-old method of data collection; pen and paper. This method helps collect survey data in field research and helps strengthen the number of responses collected and the validity of these responses.
A popular example or use case of a paper survey is a fast-food restaurant survey, where the fast-food chain would like to collect feedback on its patrons’ dining experience.
Types of survey data based on the frequency at which they are administered:
Surveys can be divided into 3 distinctive types on the basis of the frequency of their distribution. They are:
- Cross-Sectional Surveys
Cross-sectional surveys is an observational research method that analyzes data of variables collected at one given point of time across a sample population or a pre-defined subset. The survey data from this method helps the researcher understand what the respondent feels at a certain point. It helps measure opinions in a particular situation.
For example, if the researcher would like to understand movie rental habits, a survey can be conducted across demographics and geographical locations. The cross-sectional study, for example, can help understand that males between 21-28 rent action movies and females between 35-45 rent romantic comedies. This survey data helps for the basis of a longitudinal study.
LEARN ABOUT: Real Estate Surveys
- Longitudinal Surveys
Longitudinal surveys are those surveys that help researchers to make an observation and collect data over an extended period of time. This survey data can be qualitative or quantitative in nature, and the survey creator does not interfere with the survey respondents.
For example, a longitudinal study can be carried out for years to help understand if mine workers are more prone to lung diseases. This study takes a year and discounts any pre-existing conditions.
- Retrospective Surveys
In retrospective surveys, researchers ask respondents to report events from the past. This survey method offers in-depth survey data but doesn’t take as long to complete. By deploying this kind of survey, researchers can gather data based on past experiences and beliefs of people.
For example, if hikers are asked about a certain hike – the conditions of the hiking trail, ease of hike, weather conditions, trekking conditions, etc. after they have completed the trek, it is a retrospective study.
LEARN ABOUT: Powerful Survey Generator
Survey Data Analysis
After the survey data has been collected, this data has to be analyzed to ensure it aids towards the end research objective. There are different ways of conducting this research and some steps to follow. They are as below:
Survey Data Analysis: Steps and Tips
There are four main steps of survey data analysis:
- Understand the most popular survey research questions: The survey format questions should align with the overall purpose of the survey. That is when the collected data will be effective in helping researchers. For example, if a seminar has been conducted, the researchers will send out a post-seminar feedback survey. The primary goal of this survey will be to understand whether the attendees are interested in attending future seminars. The question will be: “How likely are you to attend future seminars?” – Data collected for this question will decide the likelihood of success of future seminars.
- Filter obtained results using the cross-tabulation technique: Understand the various categories in the target audience and their thoughts using cross-tabulation format. For example, if there are business owners, administrators, students, etc. who attend the seminar, the data about whether they would prefer attending future seminars or not can be represented using cross-tabulation.
- Evaluate the derived numbers: Analyzing the gathered information is critical. How many of the attendees are of the opinion that they will be attending future seminars and how many will not – these facts need to be evaluated according to the results obtained from the sample.
- Draw conclusions: Weave a story with the collected and analyzed data. What was the intention of the survey research, and how does the survey data suffice that objective? – Understand that and develop accurate, conclusive results.
Survey Data Analysis Methods
Conducting a survey without having access to the resultant data and the inability to drawing conclusions from the survey data is pointless. When you conduct a survey, it is imperative to have access to its analytics. It is tough to analyze using traditional survey methods like pen and paper and also requires additional manpower. Survey data analysis becomes much easier when using advanced online data collection methods with an online survey platform such as market research survey software or customer survey software.
LEARN ABOUT: Top 12 Tips to Create A Good Survey
Statistical analysis can be conducted on the survey data to make sense of the data that has been collected. There are multiple data analysis methods of quantitative data. Some of the commonly used types are:
- Cross-tabulation: Cross-tabulation is the most widely used data analysis methods. It uses a basic tabulation framework to make sense of data. This statistical analysis method helps tabulate data into easily understandable rows and columns, and this helps draw parallels between different research parameters. It contains data that is mutually exclusive or have some connection with each other.
- Trend analysis: Trend analysis is a statistical analysis method that provides the ability to look at survey-data over a long period of time. This method helps plot aggregated response data over time allows drawing a trend line of the change, if any, of perceptions over time about a common variable.
- MaxDiff analysis: The MaxDiff analysis method is used to gauge what a customer prefers in a product or a service across multiple parameters. For example, a product’s feature list, the difference with the competition, ease of use and likert scale, pricing, etc. form the basis for maxdiff analysis. In a simplistic form, this method is also called the “best-worst” method. This method is very similar to conjoint analysis, but it is much easier to implement and can be interchangeably used.
LEARN ABOUT: System Usability Scale
- Conjoint analysis: As mentioned above, conjoint analysis is similar to maxdiff analysis, only differing in its complexity and the ability to collect and analyze advance survey data. This method analyzes each parameter behind a person’s purchasing behavior. By using conjoint analysis, it is possible to understand what exactly is important to a customer and the aspects that are evaluated before purchase.
- TURF analysis: TURF analysis or Total Unduplicated Reach and Frequency analysis, is a statistical research methodology that assesses the total market reach of a product or service or a mix of both. This method is used by organizations to understand the frequency and the avenues at which their messaging reaches customers and prospective customers. This helps them tweak their go-to-market strategies.
- Gap analysis: Gap analysis uses a side-by-side matrix question type that helps measure the difference between expected performance and actual performance. This statistical method for survey data helps understand the things that have to be done to move performance from actual to planned performance.
- SWOT analysis: SWOT analysis, another widely used statistical method, organizes survey data into data that represents the strength, weaknesses, opportunities, and threats of an organization or product or service that provides a holistic picture of competition. This method helps to create effective business strategies.
- Text analysis: Text analysis is an advanced statistical method where intelligent tools make sense of and quantify or fashion qualitative and open-ended data into easily understandable data. This method is used when the survey data is unstructured.


