

- Custom Variable Widget
- Priority Matrix
- Heatmap Widget
- Grid Widget
- Weighted mean widget
- Comment List widget
- Widget Filters
- Ranking List Widget
- Distribution Chart
- NPS Widget
- Trend Widget
- Word Cloud Widget
- Cross tab widget
- KPI Comparison Widget
- Bubble chart
- Custom Metric Trend Chart
- Trend Comparison Widget

NPS Widget
What is a NPS widget?
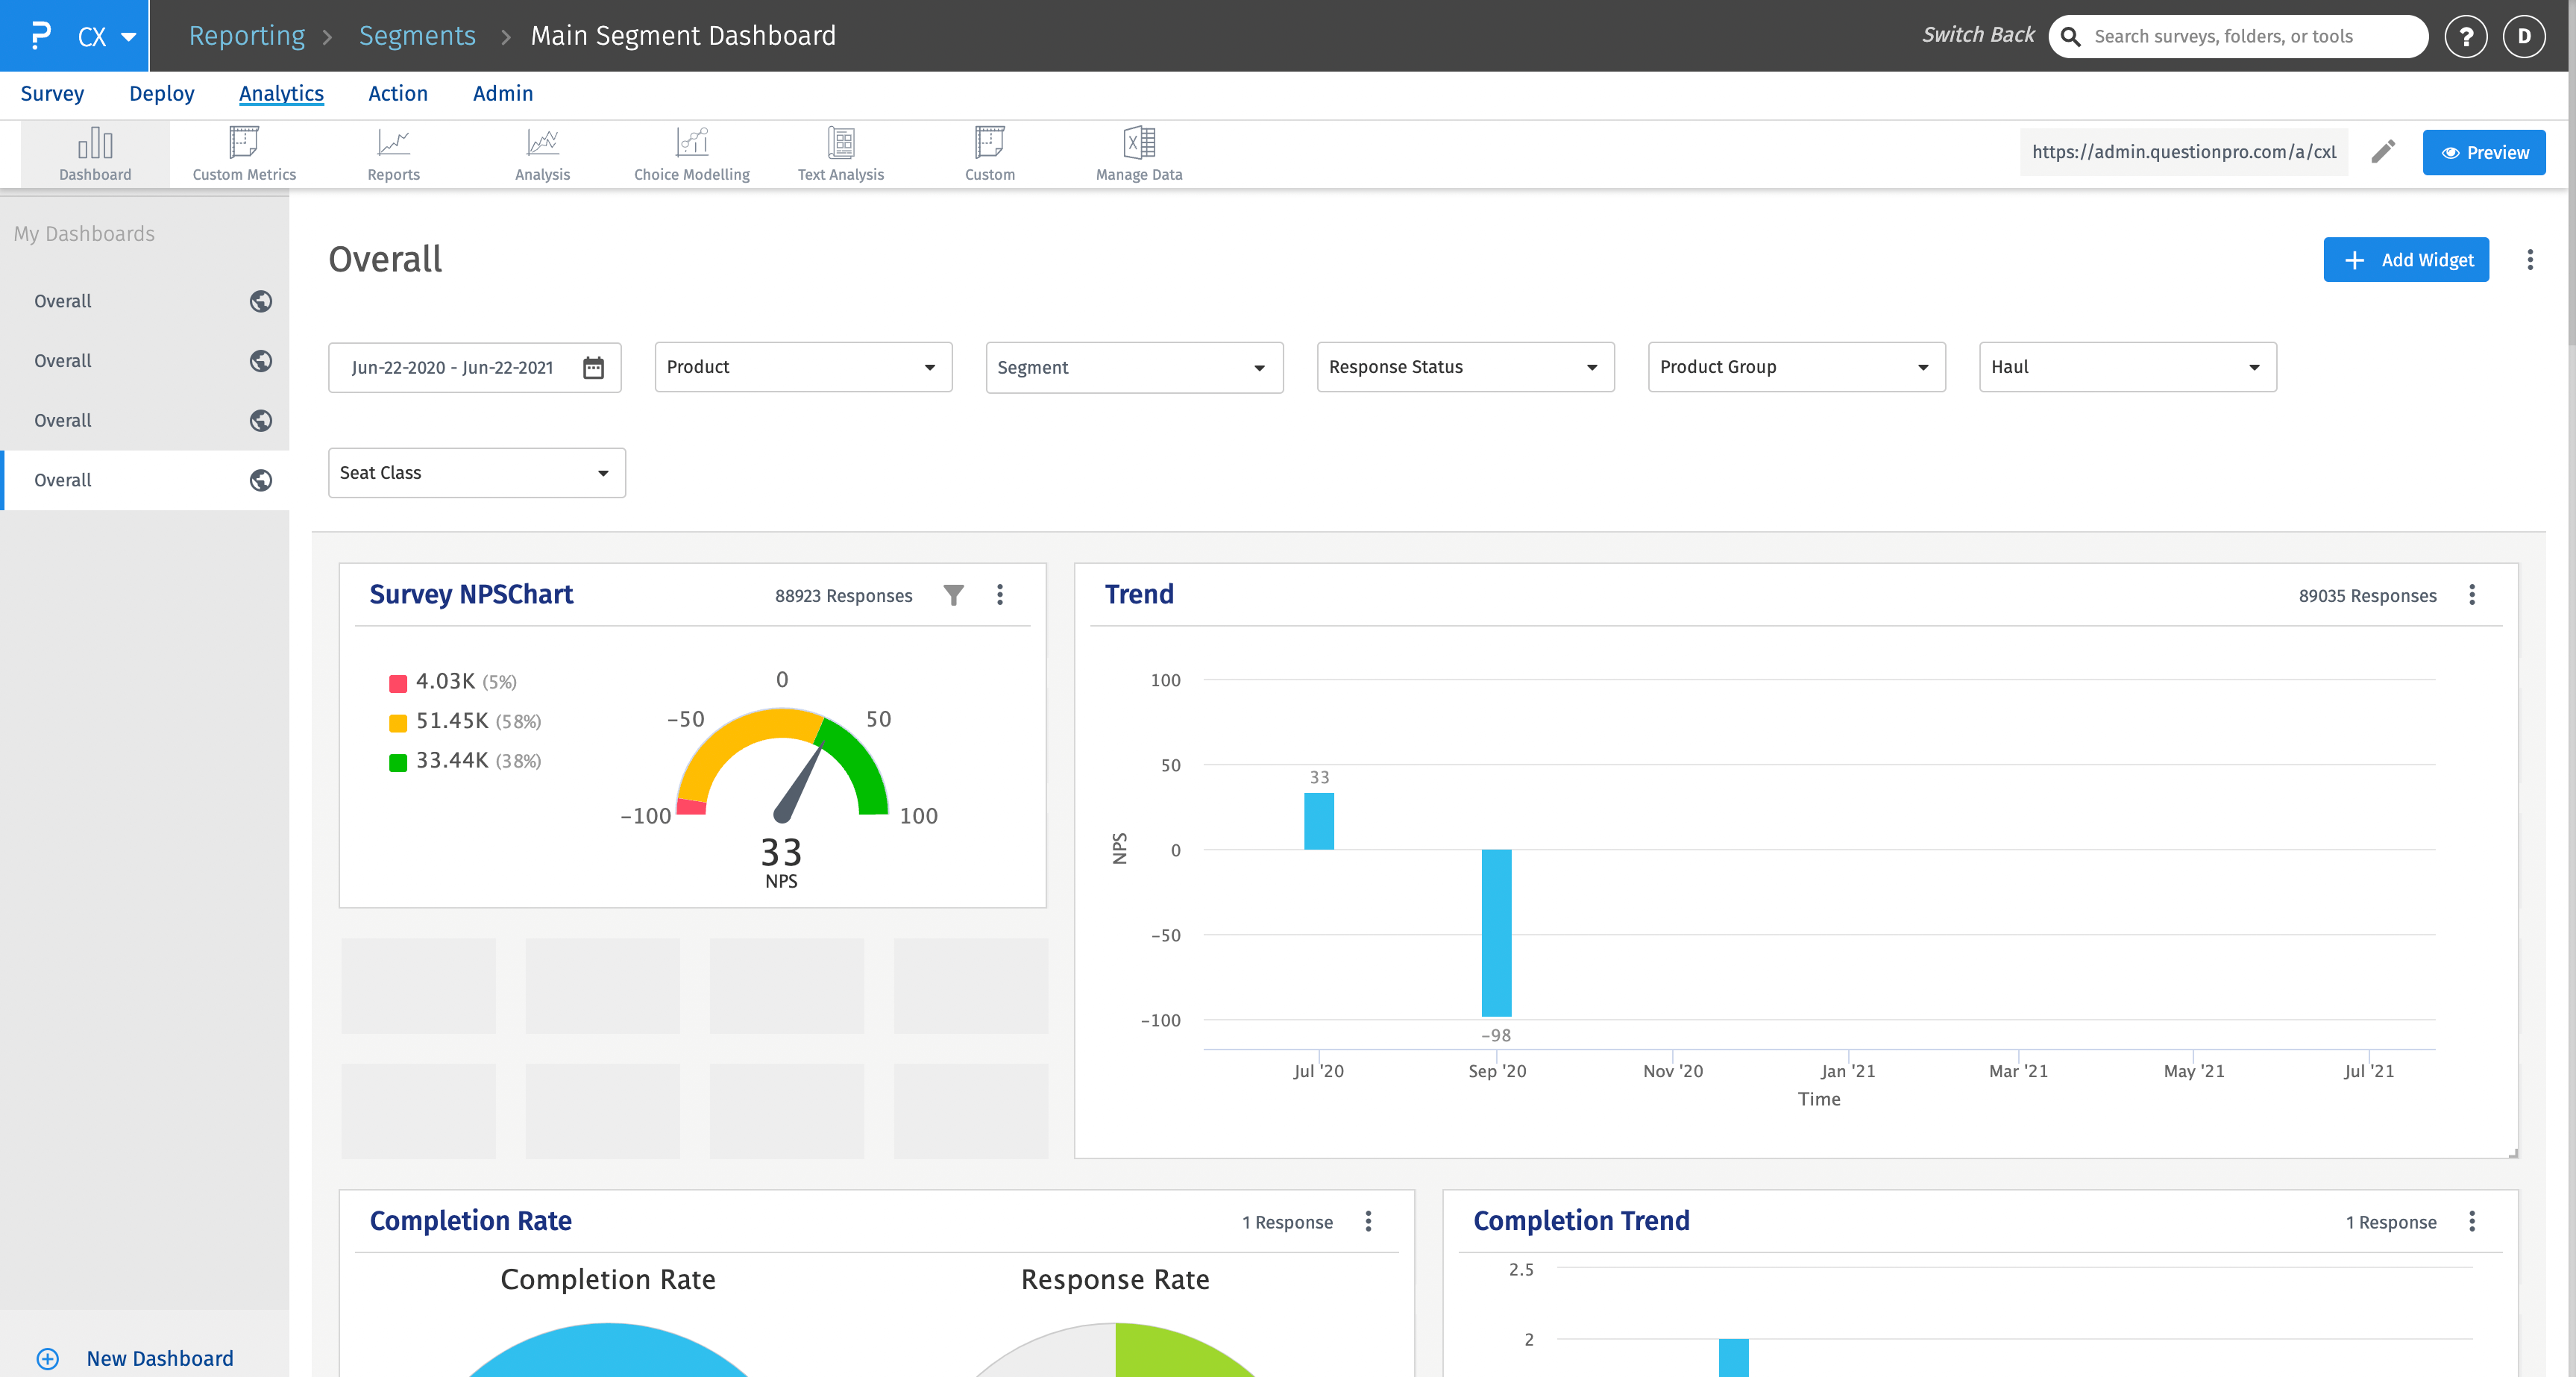
A Net Promoter Score (NPS) chart in a customer experience management platform is a visual representation of the Net Promoter Score metric.
The NPS chart provides a quick overview of customer sentiment and loyalty. It helps businesses identify the proportion of promoters, passives, and detractors in their customer base and track changes over time. By monitoring the NPS score and the distribution of responses, businesses can assess the effectiveness of their customer experience initiatives, identify areas for improvement, and track their progress in building customer loyalty and advocacy.
The NPS chart typically consists of
NPS Score: The NPS score is calculated by categorizing respondents into three groups based on their survey responses:
- Promoters (score 9-10): These are customers who are highly likely to recommend your company. They are considered loyal and enthusiastic advocates.
- Passives (score 7-8): These are customers who are relatively neutral and may not actively promote or detract from your brand. They have a moderate level of satisfaction.
- Detractors (score 0-6): These are customers who are unlikely to recommend your company. They may have had a negative experience or are dissatisfied.
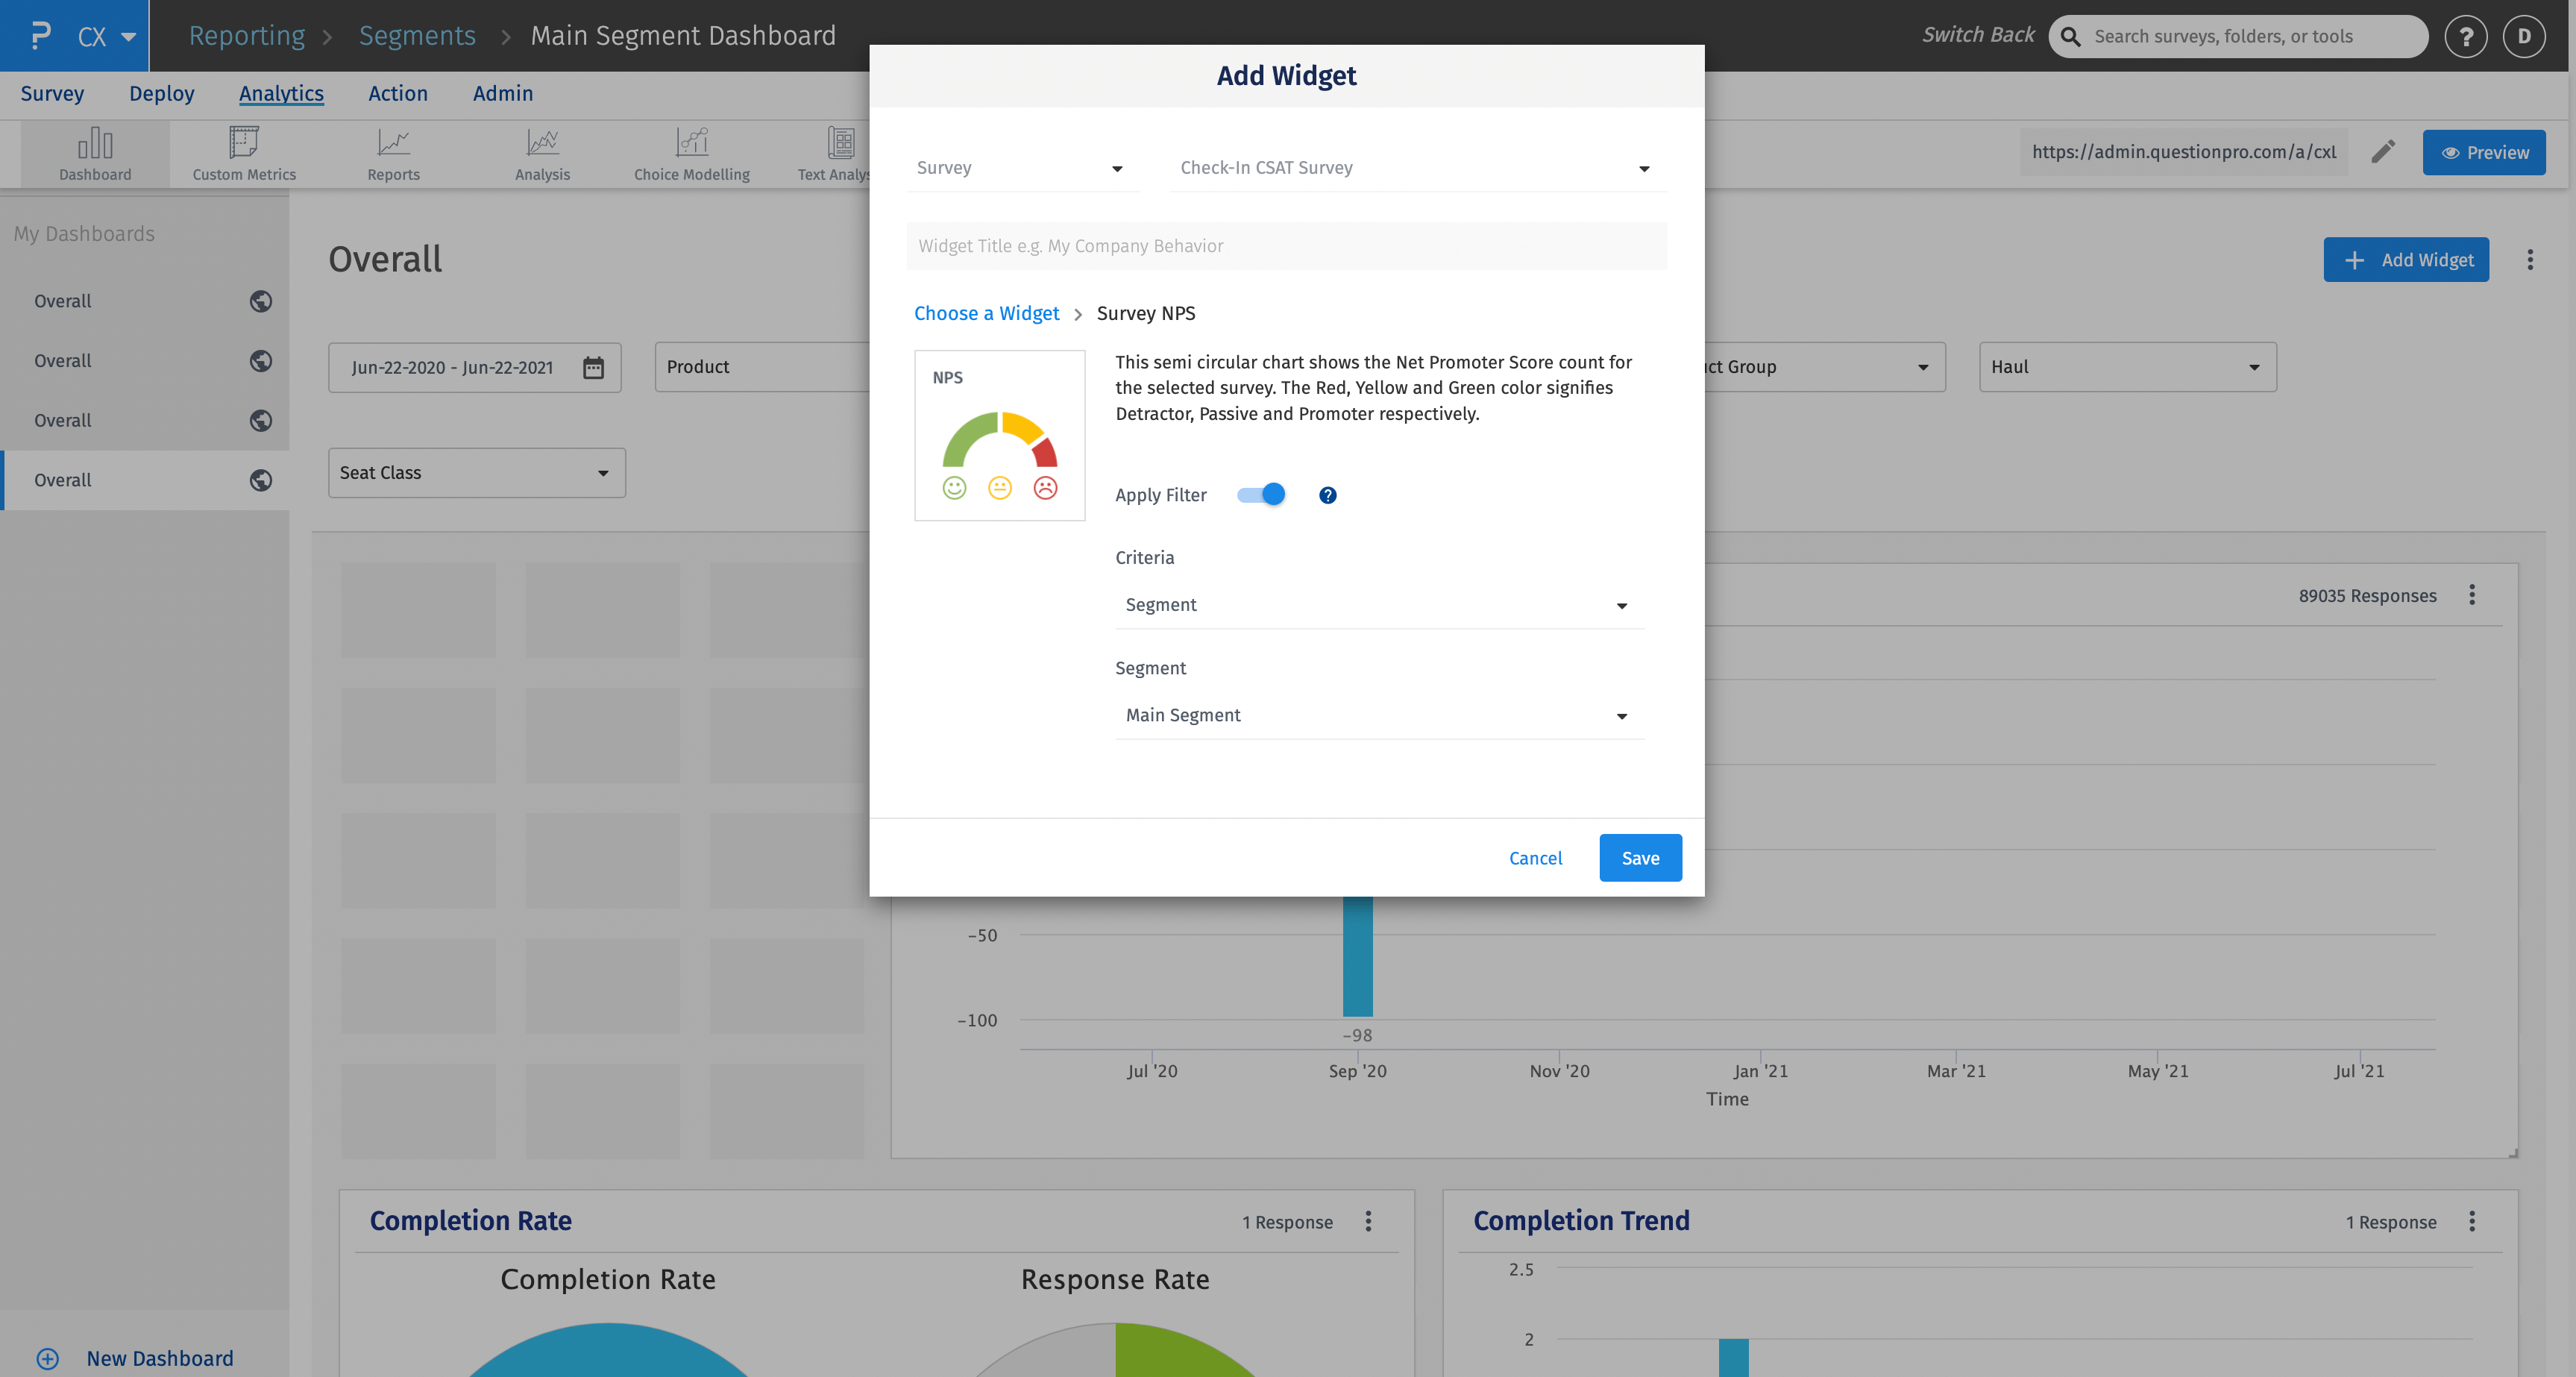
How to add NPS widget at the survey level?
Follow the steps below to add a NPS widget at survey level.
- Click on Add widget button. Select the NPS widget. You can select the criteria that includes segments, products, product groups or custom variables.
- NPS widget will be added in the dashboard.
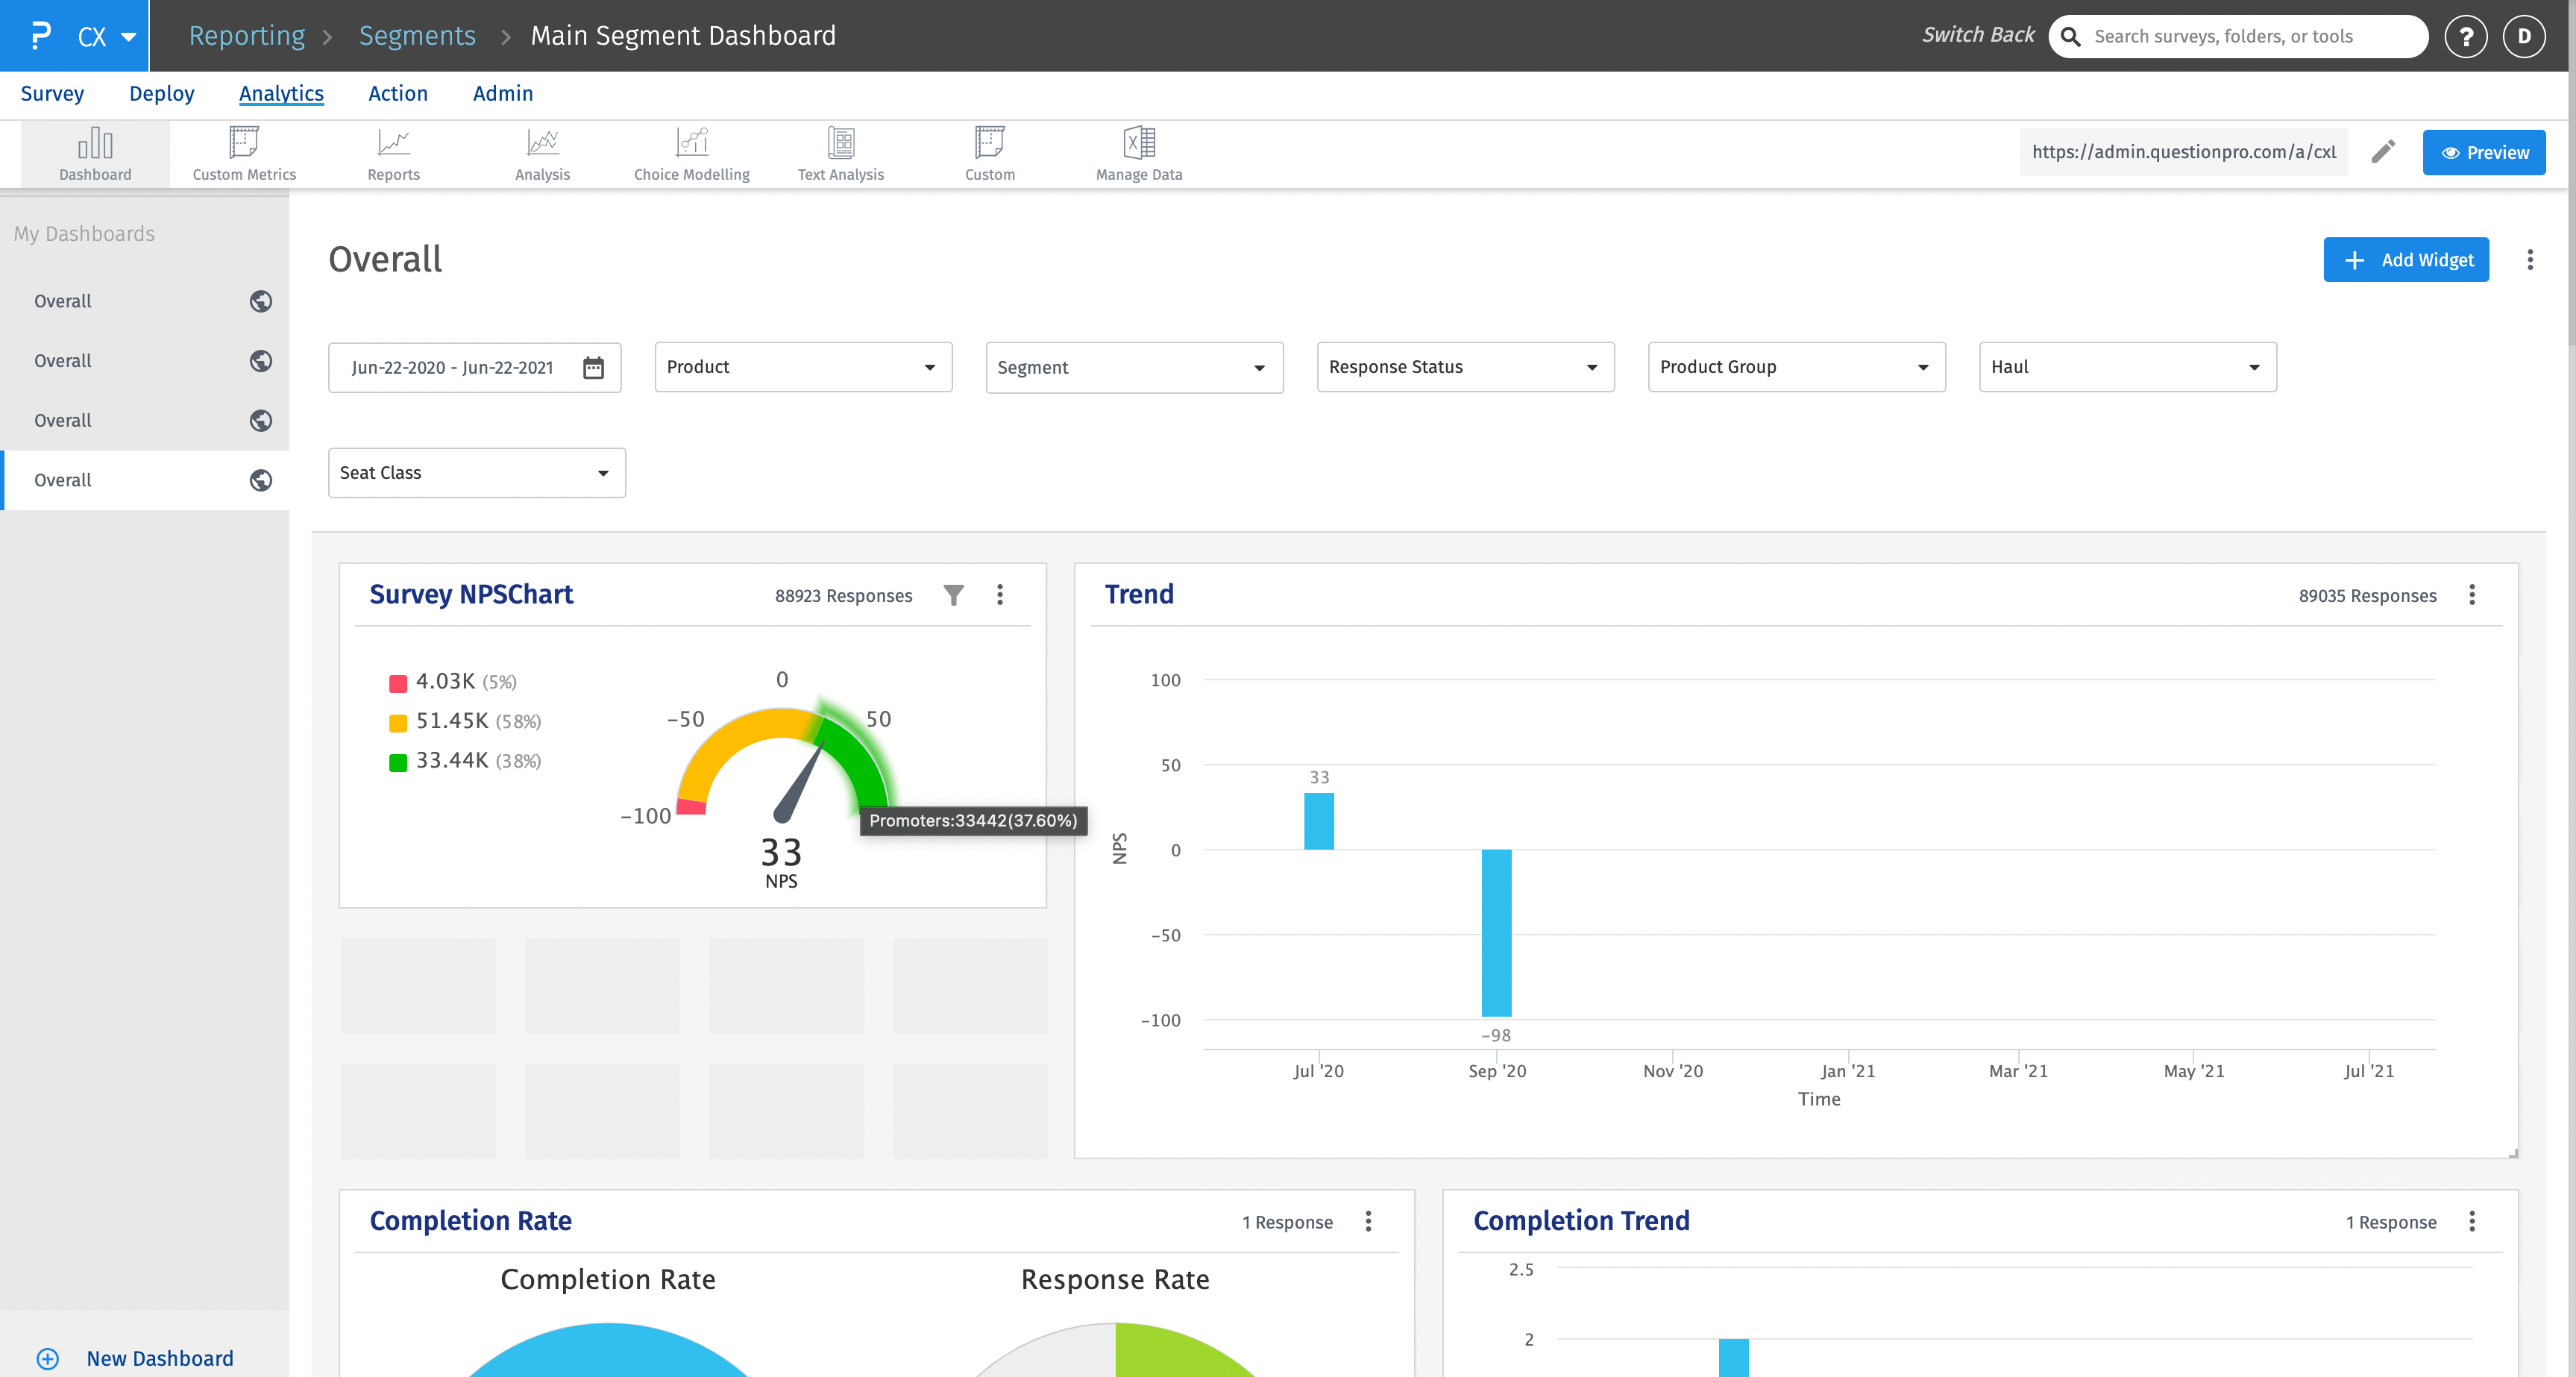
- On hover over the colors of the chart, you can see the total number of detractors, promoters and neutral respondants in counts and percentage
You may also be interested in...